. 2022 Jan 1;15(1):dmm049137.
doi: 10.1242/dmm.049137. Epub 2022 Jan 31.

Two cell line models to study multiorganic metastasis and immunotherapy in lung squamous cell carcinoma

Affiliations

Two cell line models to study multiorganic metastasis and immunotherapy in lung squamous cell carcinoma

Karmele Valencia et al. Dis Model Mech. .

Abstract

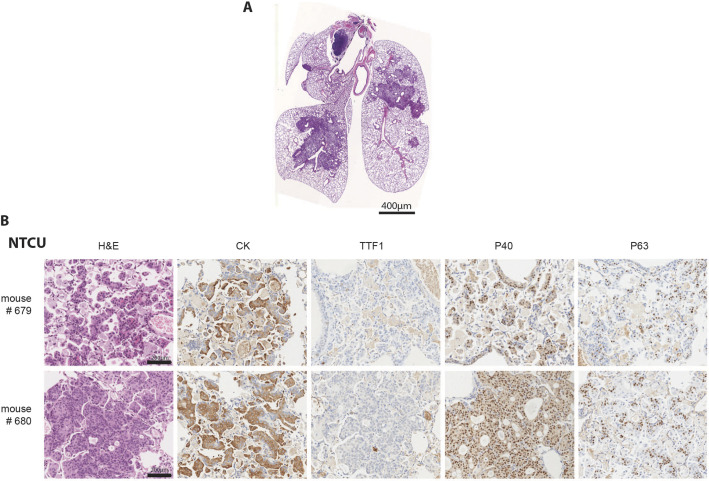
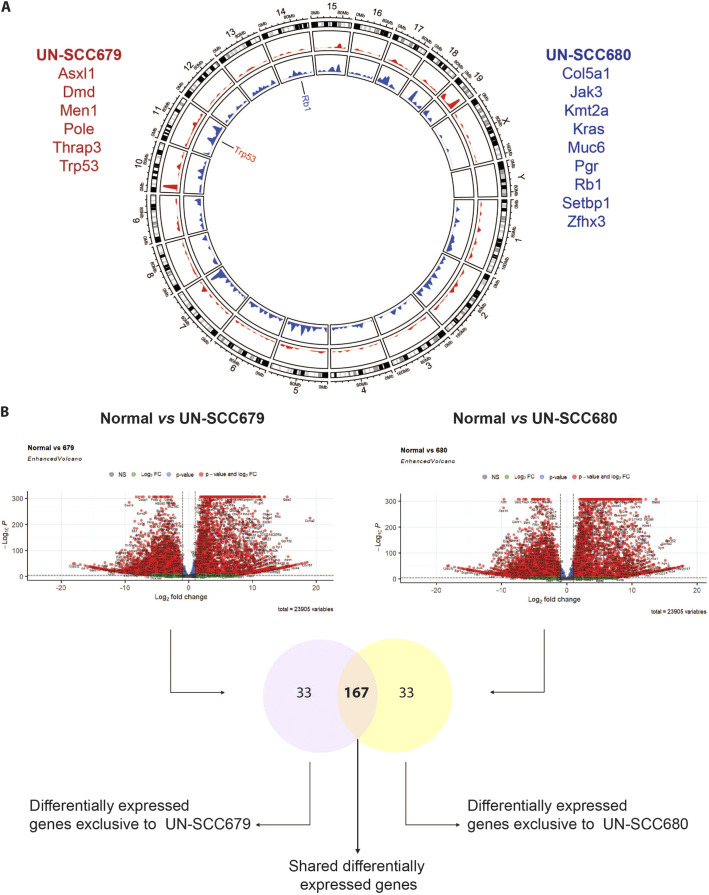
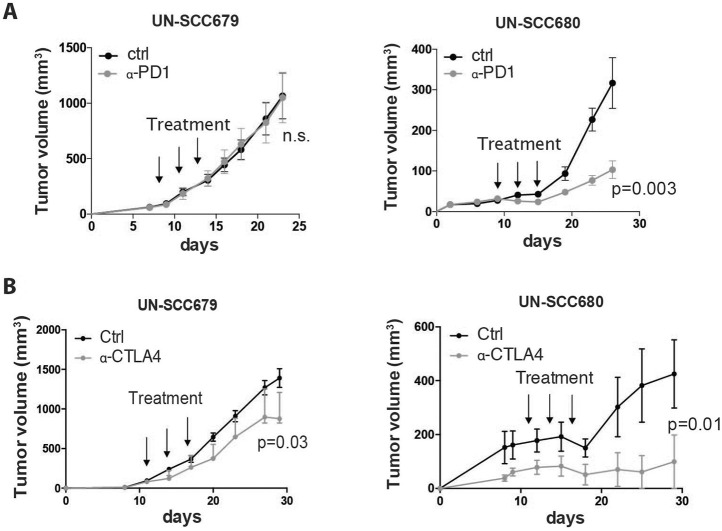
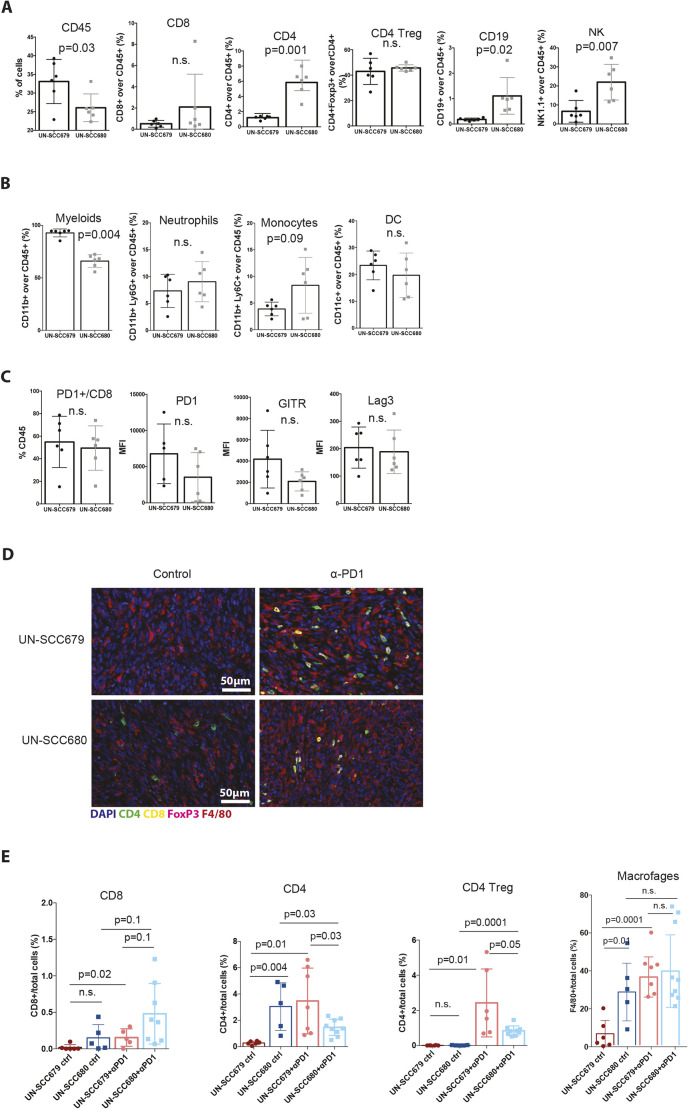
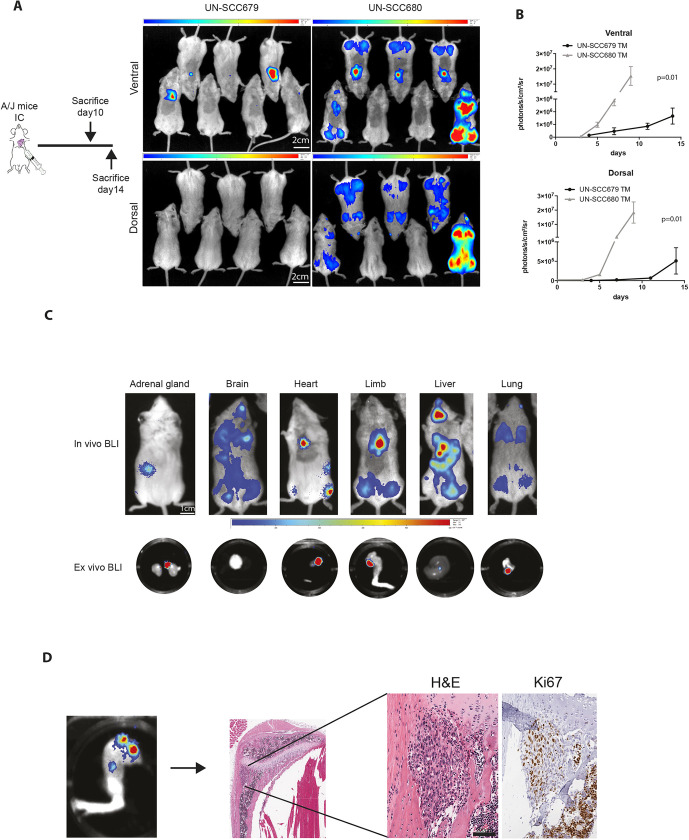
There is a paucity of adequate mouse models and cell lines available to study lung squamous cell carcinoma (LUSC). We have generated and characterized two models of phenotypically different transplantable LUSC cell lines, i.e. UN-SCC679 and UN-SCC680, derived from A/J mice that had been chemically induced with N-nitroso-tris-chloroethylurea (NTCU). Furthermore, we genetically characterized and compared both LUSC cell lines by performing whole-exome and RNA sequencing. These experiments revealed similar genetic and transcriptomic patterns that may correspond to the classic LUSC human subtype. In addition, we compared the immune landscape generated by both tumor cells lines in vivo and assessed their response to immune checkpoint inhibition. The differences between the two cell lines are a good model for the remarkable heterogeneity of human squamous cell carcinoma. Study of the metastatic potential of these models revealed that both cell lines represent the organotropism of LUSC in humans, i.e. affinity to the brain, bones, liver and adrenal glands. In summary, we have generated valuable cell line tools for LUSC research, which recapitulates the complexity of the human disease.

Keywords: Immunotherapy; Lung cancer; NTCU-mouse model; RNASeq; Squamous; Syngeneic cell lines.


Conflict of interest statement

Competing interests R.K. is founder of PearlRiver Bio (now part of Centessa Pharmaceuticals), founder of NEO New Oncology (now part of Siemens Healthcare), and received consulting honoraria from PearlRiver Bio and NEO New Oncology. L.M.M. received a research grant from Astra-Zeneca and BMS, and is a licensed patent co-holder on Complement in LC early detection in AMADIX.

Figures

Fig. 1.
Fig. 1.
Immunohistochemical characterization. (A) Lungs of A/J mice bearing NTCU-induced tumors. Tumor location and morphology are consistent with squamous lung cancer (LUSC). Scale bar: 400 µm. (B) Histological sections of lung tumor lesions in the above mouse model. H&E staining shows typical LUSC morphology of tumor cells, and immunochemistry staining for cytokeratin (CK), thyroid transcription factor 1 (TTF1), P40 and P63 matches that of LUSC histology. Scale bars: 200 µm.
Fig. 2.
Fig. 2.
Genomic characterization of UN-SCC679 and UN-SCC680 cell lines obtained from NTCU-induced lung tumors in A/J mice. (A) Circle plot shows Mus musculus chromosome coordinates at the outside circular layer of the tumor. In the inside layers, mutation positions and frequencies in UN-SCC679 (red) and UN-SCC680 (blue) cell lines are plotted. Genes labeled in the circle plot represent those mutated in UN-SCC cell lines specific for LUSC. Listed in red are cancer-driving genes mutated in UN-SCC679. Listed in blue are cancer-driving genes mutated in UN-SCC680. (B) Flow chart comparing RNASeq data. First, data from each cell line (UN-SCC679 and UN-SCC680) were compared to those from normal lung. Differentially expressed genes are shown in a volcano plot, showing the significance versus the log2 fold change of gene expression on y- and x-axes, respectively. The y-axis represents the negative log of the P-value, the x-axis represents the log of the fold-change between the two conditions are shown. Red dots indicate genes with adjusted P-values <5×10⁻⁵ and log2 fold changes >2. Green dots indicate genes that do not meet the P-value requirement. Dots on the right side of the plots indicate genes that are overexpressed in the two UN-SCC cell lines when compared to control cells. Dots on the left side of the plots indicate genes that are downregulated in the two UN-SCC cell lines when compared to control cells. The Venn diagram shows genes that are differentially expressed in UN-SCC679 and UN-SCC680 cells. Common and different differentially expressed genes are listed in Table S5.
Fig. 3.
Fig. 3.
Response to immunotherapy. (A) Average tumor volume of isografts obtained from mouse UN-SCC679 and UN-SCC680 tumors treated with three doses of 100 µg of anti-PD-1 antibody (α-PD1) or PBS (ctrl) when they had reached a volume of 75 mm3 (n=6 per group). Significance was analyzed by t-test. (B) Average tumor volume of isografts from mouse UN-SCC679 and UN-SCC680 tumors treated with three doses of 100 µg of anti-CTLA4 (α-CTLA4) or PBS when they had reached a volume of 75 mm3 (n=6 per group). Significance was analyzed by t-test.
Fig. 4.
Fig. 4.
Immune landscape characterization. (A) Relative quantification of CD45+ and lymphoid cells infiltrating UN-SCC679 and UN-SCC680 tumors. (B) Relative quantification of myeloid cells infiltrating UN-SCC679 and UN-SCC680 tumors. (C) Relative quantification of immune exhaustion markers CD8+ cells infiltrating UN-SCC679 and UN-SCC680 tumors. Plotted is the Median Fluorescence Intensity (MFI). Analyses were made at day 13 post inoculation (n=6 per group). Significance was analyzed by t-test. (D) VECTRA images showing the main immune cell populations infiltrating UN-SCC679 and UN-SCC680 tumors that had been control treated or treated with anti-PD-1 antibody (α-PD1). (E) Relative quantification of CD8, CD4, CD4 Treg (defined as CD4+, FOXP3+) cells and macrophages (F4/80+) infiltrating UN-SCC679 and UN-SCC680 tumors that had been control treated or treated with anti-PD-1 antibody represented as target cells/total cells in percent. n.s., not significant.
Fig. 5.
Fig. 5.
Metastatic features of UN-SCC679 and UN-SCC680 cell lines derived from NTCU-induced tumors. (A) Left: Schematic outline of the experiment. Signs of morbidity (cachexia or reduced mobility) were used as the endpoint for the experiment. Right: Representative bioluminescence images of mice in ventral and dorsal position at day 7 after intracardiac inoculation. Scale bars: 2 cm. Color bars: ventral min 6.41, max 45 counts; dorsal min 3.39, max 17.4 counts. (B) Quantification bioluminescence imaging (n=7 per group was analyzed by t-test). (C) Representative bioluminescence images (BLI) showing tumor cells in different metastatic organs. Top: Whole in vivo mice images. Bottom: Luminescence in ex vivo organs. Scale bar: 1 cm. Color bars: min 0.1x10⁻³, max 0.6x10⁻³ counts. (D) Representative images of a hindlimb. Tumor burden in histological sections from an UN-SCC680-bearing mouse was assessed by staining with H&E and Ki-67. Scale bar: 200 µm.

References

    1. Ajona, D., Ortiz-Espinosa, S., Lozano, T., Exposito, F., Calvo, A., Valencia, K., Redrado, M., Remã­Rez, A., Lecanda, F., Alignani, D.et al. (2020). Short-term starvation reduces IGF-1 levels to sensitize lung tumors to PD-1 immune checkpoint blockade. Nat. Cancer 1, 75-85. 10.1038/s43018-019-0007-9 - DOI - PubMed
    1. Azpilikueta, A., Agorreta, J., Labiano, S., Pérez-Gracia, J. L., Sánchez-Paulete, A. R., Aznar, M. A., Ajona, D., Gil-Bazo, I., Larrayoz, M., Teijeira, A.et al. (2016). Successful immunotherapy against a transplantable mouse squamous lung carcinoma with anti-PD-1 and anti-CD137 monoclonal antibodies. J. Thorac. Oncol. 11, 524-536. 10.1016/j.jtho.2016.01.013 - DOI - PubMed
    1. Bankhead, P., Loughrey, M. B., Fernández, J. A., Dombrowski, Y., Mcart, D. G., Dunne, P. D., Mcquaid, S., Gray, R. T., Murray, L. J., Coleman, H. G.et al. (2017). QuPath: Open source software for digital pathology image analysis. Sci. Rep. 7, 16878. 10.1038/s41598-017-17204-5 - DOI - PMC - PubMed
    1. Bailey, M. H., Tokheim, C., Porta-Pardo, E., Sengupta, S., Bertrand, D., Weerasinghe, A., Colaprico, A., Wendl, M. C., Kim, J., Reardon, B.et al. (2018). Comprehensive characterization of cancer driver genes and mutations. Cell 173, 371-385.e18. 10.1016/j.cell.2018.02.060 - DOI - PMC - PubMed
    1. Bhateja, P., Chiu, M., Wildey, G., Lipka, M. B., Fu, P., Yang, M. C. L., Ardeshir-Larijani, F., Sharma, N. and Dowlati, A. (2019). Retinoblastoma mutation predicts poor outcomes in advanced non small cell lung cancer. Cancer Med. 8, 1459-1466. 10.1002/cam4.2023 - DOI - PMC - PubMed

Publication types