

Despite National Declines In Kidney Failure Incidence, Disparities Widened Between Low- And High-Poverty US Counties
- PMID: 34871085
- PMCID: PMC10076227
- DOI: 10.1377/hlthaff.2021.00458
Despite National Declines In Kidney Failure Incidence, Disparities Widened Between Low- And High-Poverty US Counties
Abstract
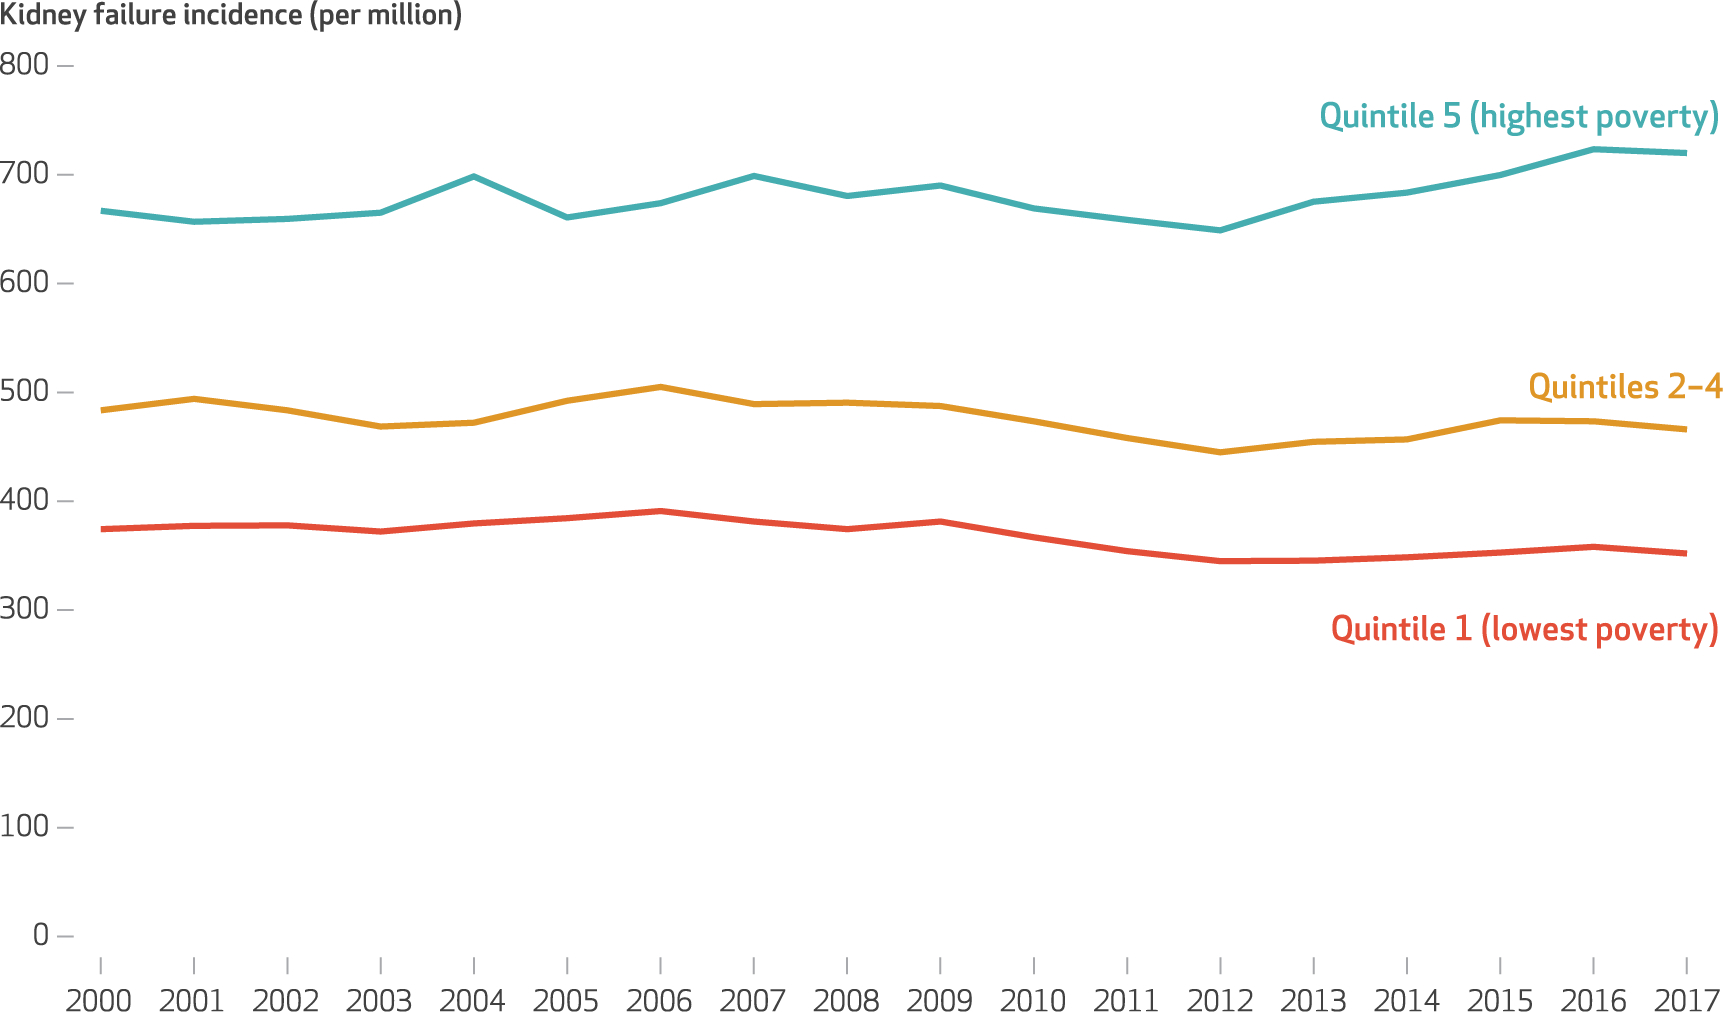
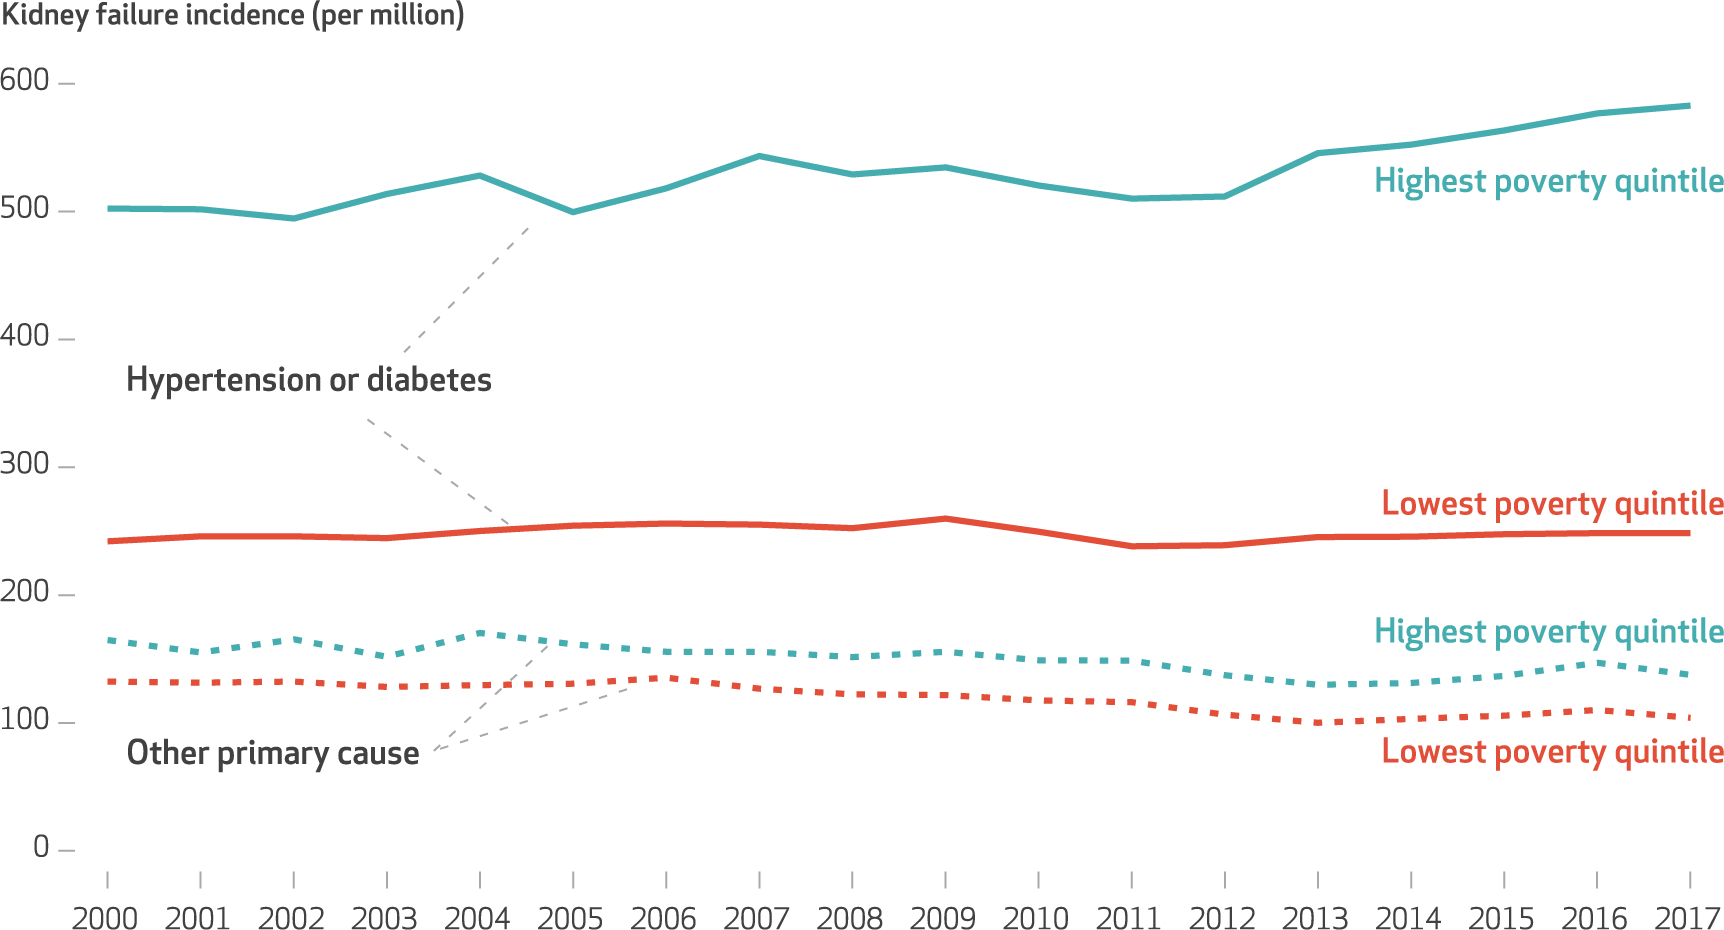
National estimates suggest that kidney failure incidence is declining in the US. However, whether this trend is evident in areas with socioeconomic disadvantage is unknown. We examined trends in kidney failure incidence by county-level poverty between 2000 and 2017 and divided the study period into period 1 (2000-05), period 2 (2006-11), and period 3 (2012-17). The magnitude of disparity in kidney failure incidence between high- and low-poverty counties increased from 42.8 more incident cases per million in high-poverty counties in period 1 to 100.1 more in period 3. Despite a national decline, kidney failure incidence increased in high-poverty counties, and disparities between high- and low-poverty counties widened from 2000 to 2017. Achieving the Department of Health and Human Services objective of reducing incident kidney failure cases by 25 percent by 2030 will require focused attention on preventing kidney failure in counties with higher poverty.
Figures
References
-
- US Renal Data System. US Renal Data System 2019 annual data report: epidemiology of kidney disease in the United States [Internet]. Bethesda (MD): USRDS; 2019. [cited 2021 Oct 1]. Available from: https://usrds.org/media/2371/2019-executive-summary.pdf
-
- Vart P, Gansevoort RT, Joosten MM, BÜltmann U, Reijneveld SA. Socioeconomic disparities in chronic kidney disease: a systematic review and meta-analysis. Am J Prev Med. 2015;48(5):580–92. - PubMed
-
- Norris K, Nissenson AR. Race, gender, and socioeconomic disparities in CKD in the United States. J Am Soc Nephrol. 2008;19(7):1261–70. - PubMed
Publication types
Grants and funding
LinkOut - more resources
Full Text Sources