. 2021 Dec 16;49(22):12785-12804.
doi: 10.1093/nar/gkab1156.

VID22 counteracts G-quadruplex-induced genome instability

Affiliations

VID22 counteracts G-quadruplex-induced genome instability

Elena Galati et al. Nucleic Acids Res. .

Abstract

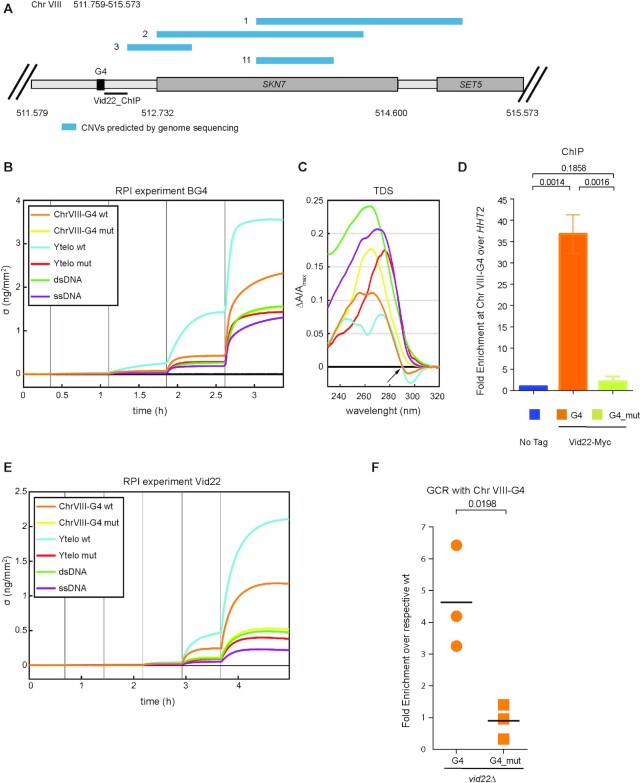
Genome instability is a condition characterized by the accumulation of genetic alterations and is a hallmark of cancer cells. To uncover new genes and cellular pathways affecting endogenous DNA damage and genome integrity, we exploited a Synthetic Genetic Array (SGA)-based screen in yeast. Among the positive genes, we identified VID22, reported to be involved in DNA double-strand break repair. vid22Δ cells exhibit increased levels of endogenous DNA damage, chronic DNA damage response activation and accumulate DNA aberrations in sequences displaying high probabilities of forming G-quadruplexes (G4-DNA). If not resolved, these DNA secondary structures can block the progression of both DNA and RNA polymerases and correlate with chromosome fragile sites. Vid22 binds to and protects DNA at G4-containing regions both in vitro and in vivo. Loss of VID22 causes an increase in gross chromosomal rearrangement (GCR) events dependent on G-quadruplex forming sequences. Moreover, the absence of Vid22 causes defects in the correct maintenance of G4-DNA rich elements, such as telomeres and mtDNA, and hypersensitivity to the G4-stabilizing ligand TMPyP4. We thus propose that Vid22 is directly involved in genome integrity maintenance as a novel regulator of G4 metabolism.


Figures

Figure 1.
Figure 1.
Genome-scale screen for synthetic dosage fitness defects with DDC2 overexpression identifies VID22. Effect of DDC2 overexpression on cell fitness. (A) Tenfold serial dilutions of exponentially growing wild-type cells carrying empty vector or DDC2 under the control of the GAL1 promoter were spotted on rich medium plates containing either glucose or galactose and raffinose as the carbon source. Cells were exposed to UV (50 J/m2), or mock-treated. Images were taken after three days of incubation at 28°C. (B) Schematic representation of the DDC2 synthetic dosage lethality screen. The galactose-inducible DDC2 gene (GAL1pr-DDC2), or the empty vector, was introduced into the yeast deletion collection (YKO) by crossing the collection with query strains containing the plasmids. Haploid strains containing each gene deletion and the plasmid were isolated using SGA methodology. Each strain was pinned to media containing galactose to induce DDC2 expression. Synthetic dosage fitness defects were evident when colonies were smaller in GAL1pr-DDC2 than in empty vector. (C) The overlap of the DDC2 SDL genes for the three replicate screens is plotted as a Venn diagram. The number of positives in each replicate is indicated, as are the 10 genes identified in all three screens. (D) Spatial analysis of functional enrichment. On the left, the yeast genetic interaction similarity network is annotated with GO biological process terms to identify major functional domains (45). Thirteen of the 17 domains are labeled and delineated by colored outlines. On the right, the network is annotated with the 52 DDC2 SDL genes. The overlay indicates the functional domains annotated on the left. Only nodes with statistically supported enrichments (SAFE neighborhood enrichment P-value < 0.05) are colored. (E) The DDC2VID22 SDL interaction is validated by growth analysis. Wild-type and vid22Δ cells were transformed with the empty vector or with the GAL1pr-DDC2 plasmid. Tenfold serial dilutions of exponentially growing cultures were spotted on glucose and galactose plus raffinose plates to repress or induce Ddc2 overexpression, respectively. Images were taken after three days of incubation at 28°C. (F) Spontaneous DNA damage checkpoint activation was evaluated by monitoring phosphorylation of the checkpoint proteins Ddc2 (Ddc2-3HA) and Rad53. Protein extracts from wild-type or vid22Δ cells expressing Ddc2-3HA were analyzed by western blotting with anti-HA and with anti-Rad53 antibodies. Arrows indicate the phosphorylated forms of Ddc2 and Rad53. (G) The cell cycle distribution of exponentially growing cultures was determined by flow cytometry of logarithmic phase wild-type (G1-25.9%; S-19%; G2-54.2%) and vid22Δ (G1-34.3%; S-22.4%; G2-38.3%) cultures from three independent replicates. The positions of cells with 1C and 2C DNA contents are indicated.
Figure 2.
Figure 2.
vid22Δ cells accumulate gross chromosomal rearrangements and chromosome duplications. DNA was prepared from wild-type and eleven independent vid22Δ mutants and chromosomes were fractionated by pulsed-field gel electrophoresis. The positions of the 16 chromosomes are indicated on the left. * indicates chromosome size changes; d indicates chromosome duplications.
Figure 3.
Figure 3.
Genome sequence analysis of vid22Δ mutants reveals preferential genome instability at G4-rich loci. (A) The intersection of predicted G4 elements (17) with small (less than 2 Kb) copy number alterations detected by genome sequencing of eleven vid22Δ mutants. The overlap of chromosome coordinates of small CNVs detected in genome shotgun sequences of vid22Δ mutants and G4 elements in the yeast genome predicted by (17) are plotted as a Venn diagram. The indicated P-value of the intersection is from the Fisher's exact test. (B) Comparison of the distribution of expected an observed distance of CNV predictions from G4 elements. Frequency distribution of observed distance of predicted CNV from G4 elements is represented in blue. The expected distance distribution, estimated by 1000 independent random resampling of a matched number of genomic windows of identical size, is represented in red. Distances in base pairs (bp) are represented on the X axis, frequencies on the Y axis. (C) The inferred mtDNA copy number of eleven vid22Δ mutant strains. The copy number of mtDNA relative to the wild-type strain was inferred by comparing ratios of mitochondrial read counts, using quantile normalization and GC content normalization.
Figure 4.
Figure 4.
Vid22 is important for the maintenance of telomere homeostasis. Genomic DNA was prepared from wild-type and the eleven independent vid22Δ strains. DNA was digested with XhoI or SalI, fractionated on agarose gel, and hybridized with the indicated probes. (A) Southern blot and schematic for XY’-type telomeres. (B) Southern blot and schematic for 4 different X-type telomeres: IL, XIR, IIIL, XVL. The probe for the XIR telomere cross-reacts with telomere IIIL (as described in (56)). The band corresponding to XIR of clone number 2 is indicated with *.
Figure 5.
Figure 5.
Gross chromosomal rearrangements and cell lethality induced by G4 DNA in vid22Δ. (A) Schematic representation of the left arm of Chr V in strains used for GCR assay. The G4 or the G4-mutated cassettes were inserted at the PRB1 locus. PCM1 is the essential gene nearest to the left telomere; URA3 and CAN1 are the two genetic markers used to select for chromosome arm loss or interstitial deletions. (B) The plot represents the fold enrichment obtained with GCR experiments. The fold enrichment is the ratio of the GCR rate between vid22Δ and wild type containing the same cassette. Each data point is from an independent fluctuation test, with n ≥ 3 for each strain. The horizontal bars indicate the mean CGR rate for each strain (N = 3 independent experiments). An unpaired Student's t-test was used to compare the means of measurements and the p-value is indicated. (C) Partial sequences of the two cassettes inserted at PRB1 locus. The underlined Gs are essential for G4-DNA formation; bold Gs in G4-mutated sequence were substituted with C to abolish G4 formation. (D) Survival curve after TMPyP4 treatment. Wild-type and vid22Δ strains were treated for 2 hours with TMPyP4 at the indicated concentration and plated on YEPD. The percentage of survival was reported (N = 3 independent experiments). An unpaired Student's t-test was used to compare the means of measurements and the p-value is indicated.
Figure 6.
Figure 6.
Vid22 binds to and controls the stability of Chr VIII-G4 region. (A) Graphical representation of genomic features associated with the Chr VIII 511.759–515.573 genomic locus. A G4 element predicted by (17) is indicated. Copy Number Variations (CNVs) detected at this region in vid22Δ strains in this study are indicated with blue bars. The region analyzed by qPCR for ChIP is indicated with a solid black line. (B) In vitro ability of the predicted Chr VIII-G4 sequence to form G4 structure. Analysis of the interaction of the BG4 antibody with different DNA sequences using the Reflective Phantom Interface (RPI) technique: control G4-forming sequence (Ytelo) and the mutated form Ytelo mut (123), unrelated ssDNA or dsDNA sequences, ChrVIII-G4 and ChrVIII-G4 mut. Increase of the surface density (σ) was measured over time upon antibody binding for the rising concentration of BG4 in solution (T = 25°C, and c = 10 μM). The vertical lines mark the time where BG4 concentration was increased step-wise from 0 to 10 nM. (C) Thermal difference spectra (TDS) of sequences used in the RPI experiment. Each spectrum is computed subtracting the absorbance spectrum at 20°C from the absorbance spectrum at 90°C and then normalized for the maximum amplitude at low temperature to allow a direct comparison among the different sequences. A neat isosbestic point associated with G-quadruplex forming species at 290nm is present (black arrow) both in Ytelo and ChrVIII-G4, while being absent in every other species studied. Y axis is stretched to fit the high TDS amplitude of ChrVIII-G4 mut, ssDNA and dsDNA. (D) ChIP-qPCR of Vid22 at the G4 predicted region (17) at the Chr VIII SKN7 locus. ChIP was performed in wild type (No Tag), Vid22-13Myc (G4) and Vid22-13Myc harbouring two point mutations in the G4 predicted region (G4-mutated). Fold enrichment of Vid22 at Chr VIII was calculated relative to the internal standard HHT2. Data are represented as mean ± SEM of N = 3 independent experiments. (E) Analysis of interaction of Vid22 with DNA forming G4 structures using the Reflective Phantom Interface (RPI) as reported in panel B. Vid22 concentration was increased step-wise from 0 to 50 nM. (F) The plot represents the fold enrichment obtained with GCR assays in which PRB1 locus was substituted with Chr VIII region (Figure 5A). The fold enrichment is the ratio of the GCR rate between vid22Δ and wild-type strain containing the same cassette. Each data point is from an independent fluctuation test, with n ≥ 3 for each strain. The horizontal bars indicate the mean GCR rate for each strain (N = 3 independent experiments). (D–F) An unpaired Student's t-test was used to compare the means of measurements and the p-value is indicated.

References

    1. Lindahl T. Instability and decay of the primary structure of DNA. Nature. 1993; 362:709–715. - PubMed
    1. Hoeijmakers J.H.J. DNA damage, aging, and cancer. N. Engl. J. Med. 2009; 361:1475–1485. - PubMed
    1. Bartek J., Lukas J.. DNA damage checkpoints: from initiation to recovery or adaptation. Curr. Opin. Cell Biol. 2007; 19:238–245. - PubMed
    1. Suijkerbuijk S.J.E., Kops G.J.P.L.. Preventing aneuploidy: the contribution of mitotic checkpoint proteins. Biochim. Biophys. Acta - Rev. Cancer. 2008; 1786:24–31. - PubMed
    1. Lazzaro F., Giannattasio M., Puddu F., Granata M., Pellicioli A., Plevani P., Muzi-Falconi M.. Checkpoint mechanisms at the intersection between DNA damage and repair. DNA Repair (Amst). 2009; 8:1055–1067. - PubMed

Publication types

MeSH terms

Substances