. 2022 Jan:55:101414.
doi: 10.1016/j.molmet.2021.101414. Epub 2021 Dec 3.

Increased glycolysis affects β-cell function and identity in aging and diabetes

Affiliations

Increased glycolysis affects β-cell function and identity in aging and diabetes

Naoya Murao et al. Mol Metab. 2022 Jan.

Abstract

Objective: Age is a risk factor for type 2 diabetes (T2D). We aimed to elucidate whether β-cell glucose metabolism is altered with aging and contributes to T2D.

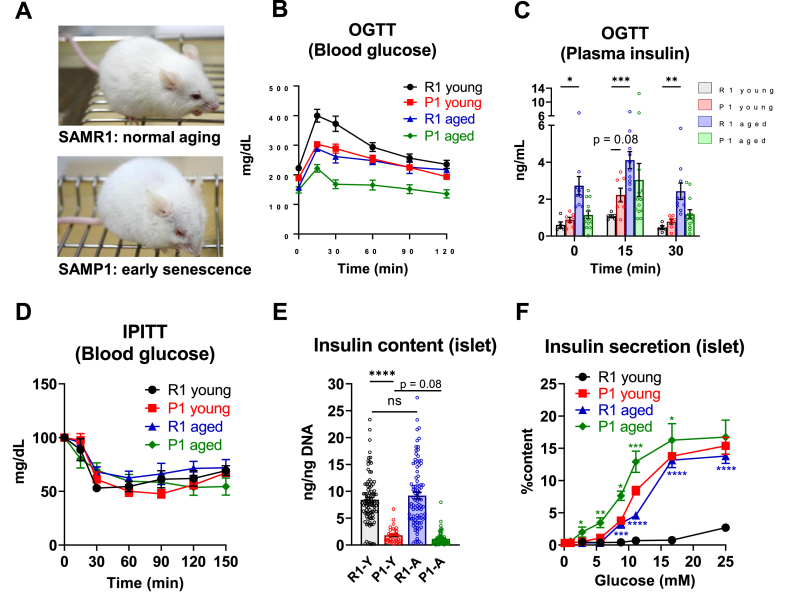
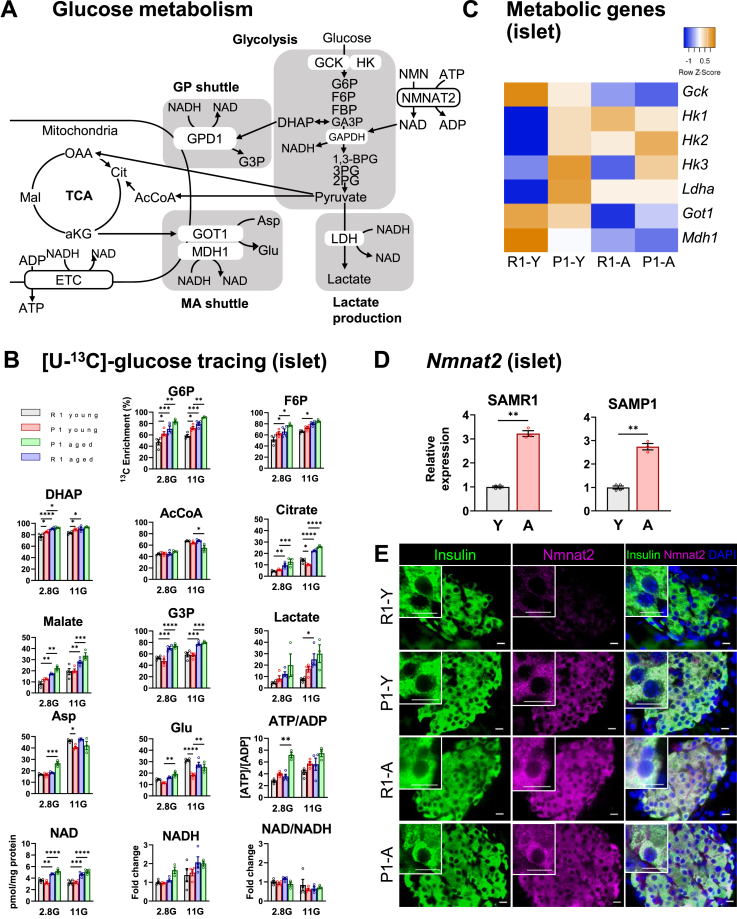
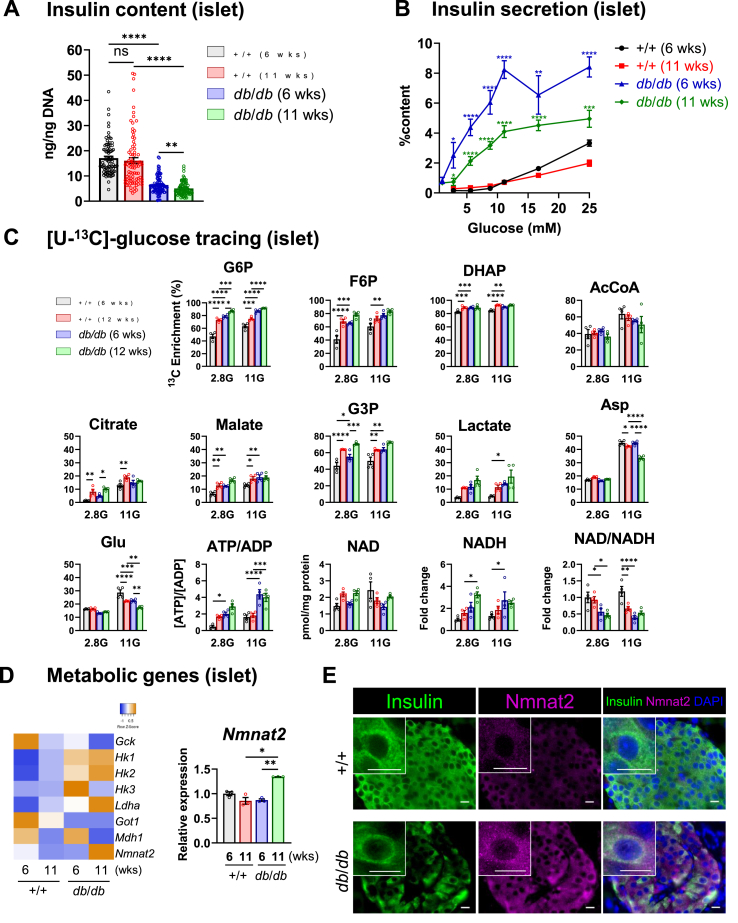
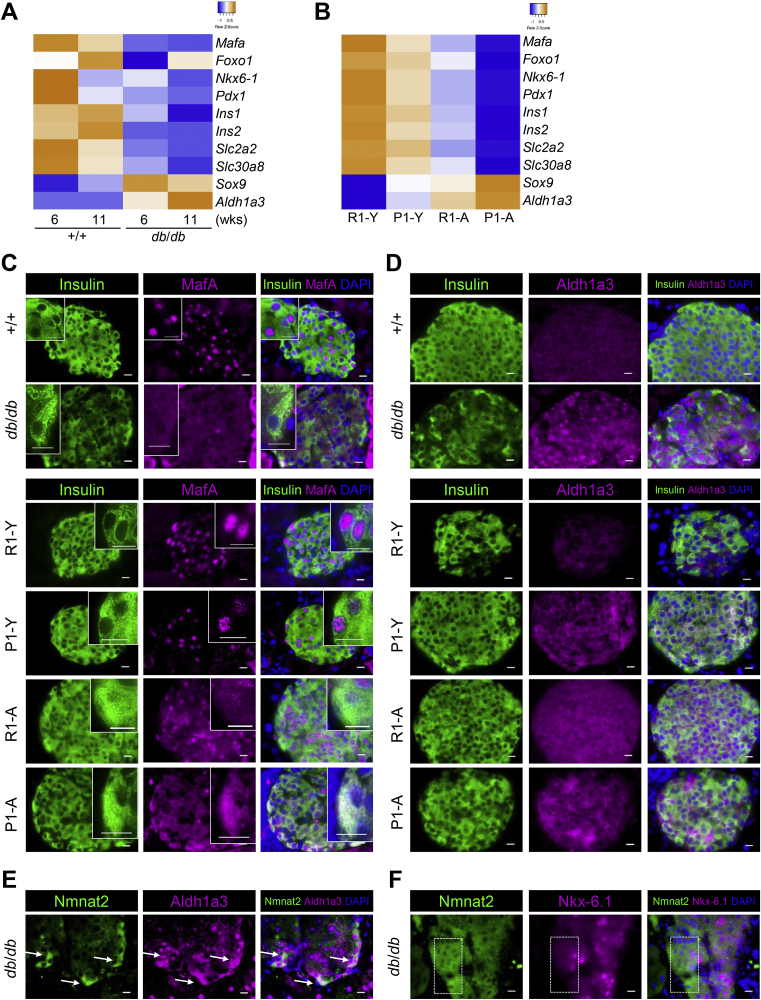
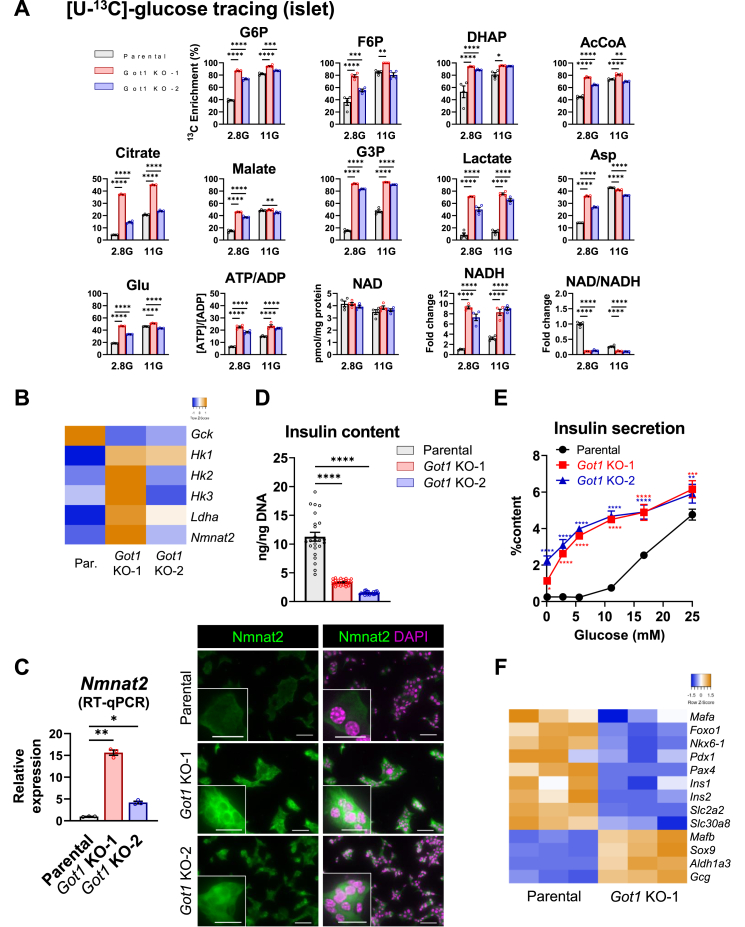
Methods: We used senescence-accelerated mice (SAM), C57BL/6J (B6) mice, and ob/ob mice as aging models. As a diabetes model, we used db/db mice. The glucose responsiveness of insulin secretion and the [U-13C]-glucose metabolic flux were examined in isolated islets. We analyzed the expression of β-cell-specific genes in isolated islets and pancreatic sections as molecular signatures of β-cell identity. β cells defective in the malate-aspartate (MA) shuttle were previously generated from MIN6-K8 cells by the knockout of Got1, a component of the shuttle. We analyzed Got1 KO β cells as a model of increased glycolysis.

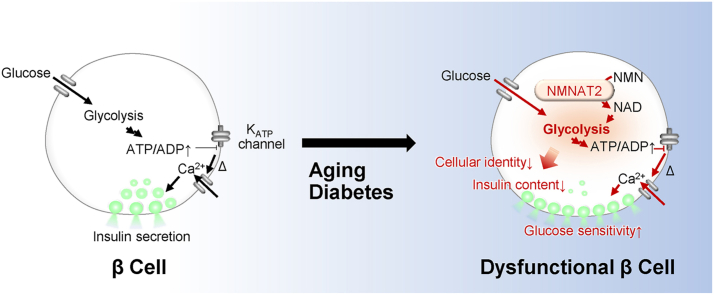
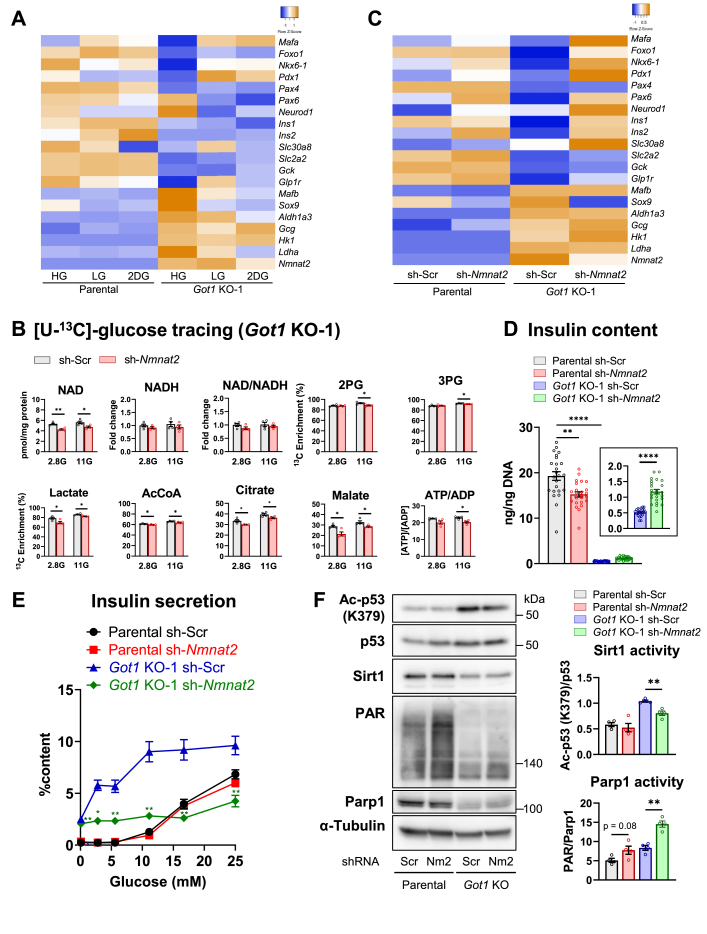
Results: We identified hyperresponsiveness to glucose and compromised cellular identity as dysfunctional phenotypes shared in common between aged and diabetic mouse β cells. We also observed a metabolic commonality between aged and diabetic β cells: hyperactive glycolysis through the increased expression of nicotinamide mononucleotide adenylyl transferase 2 (Nmnat2), a cytosolic nicotinamide adenine dinucleotide (NAD)-synthesizing enzyme. Got1 KO β cells showed increased glycolysis, β-cell dysfunction, and impaired cellular identity, phenocopying aging and diabetes. Using Got1 KO β cells, we show that attenuation of glycolysis or Nmnat2 activity can restore β-cell function and identity.

Conclusions: Our study demonstrates that hyperactive glycolysis is a metabolic signature of aged and diabetic β cells, which may underlie age-related β-cell dysfunction and loss of cellular identity. We suggest Nmnat2 suppression as an approach to counteract age-related T2D.

Keywords: Aging; Diabetes; Glycolysis; Insulin; NAD; β cells.


Figures

Image 1
Graphical abstract
Figure 1
Figure 1
Increased β-cell glucose sensitivity leads to reduced glucose excursions in aged mice. (A) Senescent appearance of aged SAMP1 (67 wks) in comparison with age-matched SAMR1. (B) Oral glucose tolerance test (OGTT). R1 Young (R1-Y): 19 wks, n = 8; P1-Y: 19 wks, n = 12; R1 aged (R1-A): 67 wks, n = 4; P1-A: 67 wks, n = 4. See also Supplementary Figure 1C and D. (C) Plasma insulin levels during OGTT. R1-Y: 17 wks, n = 5; P1-Y: 17 wks, n = 8; R1-A: 76 wks, n = 9; P1-A: 76 wks, n = 13. Statistical comparisons were made by repeated-measures two-way ANOVA with Tukey's post hoc test. (D) Intraperitoneal insulin tolerance test (IPITT). R1-Y: 26 wks, n = 7; P1-Y: 26 wks, n = 8; R1-A: 76 wks, n = 7; P1-A: 76 wks, n = 4. See also Supplementary Figure 1H. (E) Insulin content normalized to the DNA content in islets. R1-Y: 22 wks, n = 94; P1-Y: 32 wks, n = 32; R1-A: 97 wks, n = 91; P1-A: 82 wks, n = 71. Statistical comparisons were made by one-way ANOVA with Dunnett's post hoc test between the indicated pairs. Adjusted p-value is indicated. (F) Dose-dependent effects of glucose on insulin secretion from islets. R1-Y: 22 wks, P1-Y: 32 wks, R1-A: 94 wks, P1-A: 82 wks, n = 10–16 for each. Statistical comparisons were made by Welch's unpaired t-test between R1-Y and R1-A, or P1-Y and P1-A. Data are represented as mean ± SEM. ∗p < 0.05, ∗∗p < 0.01, ∗∗∗p < 0.001, ∗∗∗∗p < 0.0001, ns: not significant.
Figure 2
Figure 2
Aged islets show upregulated glucose metabolism and altered cytosolic NAD metabolism. (A) Schematic overview of glucose metabolism. Metabolites and genes assessed in the following experiments are indicated. G6P, glucose 6-phosphate; F6P, fructose 6-phosphate; FBP, fructose 1,6-bisphosphate; GA3P, glyceraldehyde 3-phosphate; DHAP, dihydroxyacetone phosphate; G3P, glycerol 3-phosphate; 1,3-BPG, 1,3-bisphosphoglycerate; 3PG, 3-phosphoglycerate; 2PG, 2-phosphoglycerate; AcCoA, acetyl CoA; Cit, citrate; aKG, α-ketoglutarate; OAA, oxaloacetate; Asp, aspartate; Glu, glutamate; NMN, nicotinamide mononucleotide; ETC, electron transport chain. (B) [U-13C]-glucose tracing experiment in SAM islets. Enrichment of 13C for the indicated metabolites following a 1-h incubation with 2.8 mM (2.8G) or 11.1 mM [U-13C]-glucose (11G) were measured. For NAD and NADH, intracellular content is indicated. R1-Y (25 wks, n = 4), P1-Y (25 wks, n = 4), R1-A (55 wks, n = 4), P1-A (55 wks, n = 3). Statistical comparisons were made by two-way ANOVA with Tukey's post hoc test. See also Supplementary Figure 8A for other metabolites. (C) Expression of metabolic genes in SAM islets assessed by RT-qPCR. Means of each group are visualized. Heatmap scale is Z score for the number of deviations away from the row mean. R1-Y: 27 wks, n = 4; P1-Y: 27 wks, n = 4; R1-A: 97 wks, n = 3; P1-A: 50 wks, n = 3. See Supplementary Table 1 for quantitative values. (D) Expression of Nmnat2 in islets assessed by RT-qPCR. Statistical comparisons were made by Welch's unpaired t-test. R1-Y: 27 wks, n = 4; R1-A: 97 wks, n = 3; P1-Y: 27 wks, n = 4; P1-A: 50 wks, n = 3. (E) Immunofluorescence staining of the pancreatic sections from SAM mice for Insulin (green) and Nmnat2 (magenta). Nuclei were stained with DAPI (blue). R1-Y: 16 wks; P1-Y: 16 wks; R1-A: 84 wks; P1-A: 84 wks. Scale bars, 10 μm. Insets show the representative cells. Data are represented as mean ± SEM for B and D. ∗p < 0.05, ∗∗p < 0.01, ∗∗∗p < 0.001, ∗∗∗∗p < 0.0001.
Figure 3
Figure 3
Diabetic islets show altered function and metabolism similar to aged islets. (A) Insulin content in islets normalized to the DNA content. +/+ (6 wks): n = 85; +/+ (12 wks): n = 85; db/db (6 wks): n = 102; db/db (12 wks): n = 87. Statistical comparisons were made by one-way ANOVA with Dunnett's post hoc test between the indicated pairs. (B) Dose-dependent effects of glucose on insulin secretion from +/+ and db/db islets. n = 10–16 for each. Asterisks indicate significant differences from age-matched +/+ by Welch's unpaired t-test. (C) [U-13C]-glucose tracing experiment in +/+ and db/db islets. Enrichment of 13C for the indicated metabolites following a 1-h incubation with 2.8 mM (2.8G) or 11.1 mM [U-13C]-glucose (11G) were measured. For NAD and NADH, the intracellular content is indicated. n = 4 for each. Statistical comparisons were made by two-way ANOVA with Tukey's post hoc test. See also Supplementary Figure 9E for other metabolites. (D) Left, expression of metabolic genes in +/+ and db/db islets at 6 and 11 weeks of age assessed by RT-qPCR. n = 3 for each. Right, the relative expression of Nmnat2. Statistical analysis was performed by one-way ANOVA with Dunnett's post hoc test between the following comparisons: +/+ (6 wks) vs. +/+ (11 wks), +/+ (6 wks) vs. db/db (6 wks), db/db (6 wks) vs. db/db (11 wks), and +/+ (11 wks) vs. db/db (11 wks). Means of each group are visualized. The heatmap scale is Z score for the number of deviations away from the row mean. See Supplementary Table 3 for quantitative values. (E) Immunofluorescence staining of the pancreatic sections from +/+ (25 wks) and db/db (25 wks) for Insulin (green) and Nmnat2 (magenta). Nuclei were stained with DAPI (blue). Scale bars, 10 μm. Insets show the representative cells. Data are represented as mean ± SEM for (A)–(D). ∗∗p < 0.01, ∗∗∗p < 0.001, ∗∗∗∗p < 0.0001, ns, not significant.
Figure 4
Figure 4
Altered expression of β-cell identity genes in aged and diabetic islets. (A)–(B): Expression of β-cell identity genes in islets assessed by RT-qPCR. Means of each group are visualized. Heatmap scales represent the Z score for the number of deviations away from the row mean. (A) +/+ and db/db islets at 6 and 11 weeks of age. n = 3 for each. See Supplementary Table 3 for quantitative values. (B) R1-Y: 27 wks, n = 4; P1-Y: 27 wks, n = 4; R1-A: 97 wks, n = 3; P1-A: 50 wks, n = 3. See Supplementary Table 1 for quantitative values. (C)–(F): Immunofluorescence staining of the pancreatic sections. +/+: 25 wks; db/db: 25 wks; R1-Y: 16 wks; P1-Y: 16 wks; R1-A: 84 wks; P1-A: 84 wks. Nuclei were stained with DAPI (blue). Scale bars, 10 μm. Insets show the representative cells. (C) Insulin (green) and MafA (magenta). (D) Insulin (green) and Aldh1a3 (magenta). (E) Nmnat2 (green) and Aldh1a3 (magenta). White arrows indicate the co-localization of Nmnat2 and Ald1a3 immunoreactivity. (F) Nmnat2 (green) and Nkx-6.1 (magenta). Dashed rectangles indicate the areas of relatively high Nmnat2 immunoreactivity.
Figure 5
Figure 5
Metabolic alteration by Got1 deletion dysregulates β-cell function and identity. (A) [U-13C]-glucose tracing experiment in parental cells and two independent Got1 KO β cells (Got1 KO-1 and -2). Enrichment of 13C for the indicated metabolites following a 30-min incubation with 2.8 mM (2.8G) or 11.1 mM [U-13C]-glucose (11G) were measured. For NAD and NADH, the intracellular content is indicated. n = 4 for each. Statistical comparisons were made by two-way ANOVA with Tukey's post hoc test. See also Supplementary Figure 12A for other metabolites. (B) Expression of metabolic genes in parental and Got1 KO β cells determined by RT-qPCR. n = 3 for each. Means of each group are visualized. See Supplementary Table 4 for quantitative values. (C) Left, the relative expression of Nmnat2. See the legend of Figure 5B for the experimental details. Statistical comparisons were made by one-way ANOVA with Dunnett's post hoc test between the parental cells and Got1 KO-1 or KO-2. Right, immunostaining of parental and Got1 KO β cells for Nmnat2 (green). Nuclei were stained with DAPI (magenta). Scale bars, 50 μm. Insets show the representative cells (scale bars, 20 μm). (D) Insulin content normalized by the DNA content. n = 24. Statistical comparisons were made by one-way ANOVA with Dunnett's post hoc test between the parental cells and Got1 KO-1 or KO-2. (E) Dose-dependent effects of glucose on insulin secretion from parental and Got1 KO β cells. Asterisks indicate the statistical differences from parental cells. n = 4. Statistical comparisons were made by two-way ANOVA with Dunnett's post hoc test between parental cells and Got1 KO-1 or KO-2. (F) Expression of β-cell identity genes in parental and Got1 KO-1 determined by RT-qPCR. n = 3 for each. Individual values are visualized. See Supplementary Table 4 for quantitative values. Data are represented as mean ± SEM for (A), (C), (D), and (E). ∗p < 0.05, ∗∗p < 0.01, ∗∗∗p < 0.001, ∗∗∗∗p < 0.0001. Heatmap scales represent the Z score for the number of deviations away from the row mean.
Figure 6
Figure 6
Suppression of Nmnat2 improves β-Cell identity and function. (A) Effects of chronic treatment with high glucose (HG: 25 mM glucose), low glucose (LG: 5 mM for parental cells; 0.05 mM for Got1 KO-1), or 2-deoxy-d-glucose (2DG: 25 mM 2-deoxyglucose added to 25G) on the expression of β-cell identity genes assessed by RT-qPCR. n = 3 for each. Means of each group are visualized. See Supplementary Table 5 for quantitative values. (B)–(F): Effects of adenoviral shRNA-mediated knockdown of Nmnat2 on the function and identity of parental cells and Got1 KO-1. sh-Scr, scramble shRNA; sh-Nmnat2, Nmnat2 shRNA. (B) [U-13C]-glucose tracing experiment in Got1 KO-1. Enrichment of 13C for the indicated metabolites following 30-min incubation with 2.8 mM (2.8G) or 11.1 mM [U-13C]-glucose (11G) were measured. For NAD and NADH, the intracellular content is indicated. n = 4 for each. See also Supplementary Figure 12B for other metabolites. (C) Expression of β-cell identity genes assessed by RT-qPCR. n = 3 for each. Means of each group are visualized. See Supplementary Table 6 for the quantitative values. (D) Insulin content normalized by the DNA content. n = 24 for each. Statistical comparisons were made by one-way ANOVA with Dunnett's post hoc test between the indicated pairs. (E) Dose-dependent effects of glucose on insulin secretion. n = 4 for each. Statistical comparisons were made by unpaired Welch's unpaired t-test between Got1 KO-1 sh-Scr and Got1 KO-1 sh-Nmnat2. (F) Activities of Sirt1 and Parp1 assessed by Western blotting. Left, representative blots are shown. Right, intensity of acetyl-p53 (K379) and poly ADP-ribose (PAR) were normalized to that of total p53 and Parp1, respectively. Scr, scramble; Nm2, Nmnat2. n = 4 for each. Statistical comparisons were made by Welch's unpaired t-test between sh-Scr and sh-Nmnat2. Data are represented as the mean ± SEM for (B), (D)–(F). ∗p < 0.05, ∗∗p < 0.01, ∗∗∗∗p < 0.0001. p-value is indicated in (F). The heatmap scale represents the Z score for the number of deviations away from the row mean.

Similar articles

Cited by

  • Biomarkers of aging.
    Aging Biomarker Consortium; Bao H, Cao J, Chen M, Chen M, Chen W, Chen X, Chen Y, Chen Y, Chen Y, Chen Z, Chhetri JK, Ding Y, Feng J, Guo J, Guo M, He C, Jia Y, Jiang H, Jing Y, Li D, Li J, Li J, Liang Q, Liang R, Liu F, Liu X, Liu Z, Luo OJ, Lv J, Ma J, Mao K, Nie J, Qiao X, Sun X, Tang X, Wang J, Wang Q, Wang S, Wang X, Wang Y, Wang Y, Wu R, Xia K, Xiao FH, Xu L, Xu Y, Yan H, Yang L, Yang R, Yang Y, Ying Y, Zhang L, Zhang W, Zhang W, Zhang X, Zhang Z, Zhou M, Zhou R, Zhu Q, Zhu Z, Cao F, Cao Z, Chan P, Chen C, Chen G, Chen HZ, Chen J, Ci W, Ding BS, Ding Q, Gao F, Han JJ, Huang K, Ju Z, Kong QP, Li J, Li J, Li X, Liu B, Liu F, Liu L, Liu Q, Liu Q, Liu X, Liu Y, Luo X, Ma S, Ma X, Mao Z, Nie J, Peng Y, Qu J, Ren J, Ren R, Song M, Songyang Z, Sun YE, Sun Y, Tian M, Wang S, Wang S, Wang X, Wang X, Wang YJ, Wang Y, Wong CCL, Xiang AP, Xiao Y, Xie Z, Xu D, Ye J, Yue R, Zhang C, Zhang H, Zhang L, Zhang W, Zhang Y, Zhang YW, Zhang Z, Zhao T, Zhao Y, Zhu D, Zou W, Pei G, Liu GH. Aging Biomarker Consortium, et al. Sci China Life Sci. 2023 May;66(5):893-1066. doi: 10.1007/s11427-023-2305-0. Epub 2023 Apr 11. Sci China Life Sci. 2023. PMID: 37076725 Free PMC article. Review.
  • The role of GOT1 in cancer metabolism.
    Peng H, Dou H, He S, Xie YA, Zhang Q, Zheng J. Peng H, et al. Front Oncol. 2024 Dec 24;14:1519046. doi: 10.3389/fonc.2024.1519046. eCollection 2024. Front Oncol. 2024. PMID: 39777342 Free PMC article. Review.
  • Monocyte CCL2 signaling possibly contributes to increased asthma susceptibility in type 2 diabetes.
    Luo T, Guo W, Ji W, Du W, Lv Y, Feng Z. Luo T, et al. Sci Rep. 2025 Mar 28;15(1):10768. doi: 10.1038/s41598-025-95039-1. Sci Rep. 2025. PMID: 40155667 Free PMC article.
  • Pancreatic β-cell failure, clinical implications, and therapeutic strategies in type 2 diabetes.
    Cui D, Feng X, Lei S, Zhang H, Hu W, Yang S, Yu X, Su Z. Cui D, et al. Chin Med J (Engl). 2024 Apr 5;137(7):791-805. doi: 10.1097/CM9.0000000000003034. Epub 2024 Mar 13. Chin Med J (Engl). 2024. PMID: 38479993 Free PMC article. Review.
  • Stem Cell-Derived Islets for Type 2 Diabetes.
    Salib A, Cayabyab F, Yoshihara E. Salib A, et al. Int J Mol Sci. 2022 May 4;23(9):5099. doi: 10.3390/ijms23095099. Int J Mol Sci. 2022. PMID: 35563490 Free PMC article. Review.

References

    1. Henquin J.C. Regulation of insulin secretion: a matter of phase control and amplitude modulation. Diabetologia. 2009;52(5):739–751. doi: 10.1007/s00125-009-1314-y. - DOI - PubMed
    1. Prentki M., Matschinsky F.M., Madiraju S.M. Metabolic signaling in fuel-induced insulin secretion. Cell Metabolism. 2013;18(2):162–185. doi: 10.1016/j.cmet.2013.05.018. - DOI - PubMed
    1. Hudish L.I., Reusch J.E., Sussel L. β Cell dysfunction during progression of metabolic syndrome to type 2 diabetes. The Journal of Clinical Investigation. 2019;129(10):4001–4008. doi: 10.1172/JCI129188. - DOI - PMC - PubMed
    1. Cho N., Shaw J., Karuranga S., Huang Y., Rocha Fernandes J.D., Ohlrogge A., et al. IDF Diabetes Atlas: Global estimates of diabetes prevalence for 2017 and projections for 2045. Diabetes Research and Clinical Practice. 2018;138:271–281. doi: 10.1016/j.diabres.2018.02.023. - DOI - PubMed
    1. Chang A.M., Halter J.B. Aging and insulin secretion. American Journal of Physiology-Endocrinology and Metabolism. 2003;284(1):E7–E12. doi: 10.1152/ajpendo.00366.2002. - DOI - PubMed

Publication types