

Impact of Temperature and Rainfall on Typhoid/Paratyphoid Fever in Taizhou, China: Effect Estimation and Vulnerable Group Identification
- PMID: 34872055
- PMCID: PMC8832923
- DOI: 10.4269/ajtmh.20-1457
Impact of Temperature and Rainfall on Typhoid/Paratyphoid Fever in Taizhou, China: Effect Estimation and Vulnerable Group Identification
Abstract
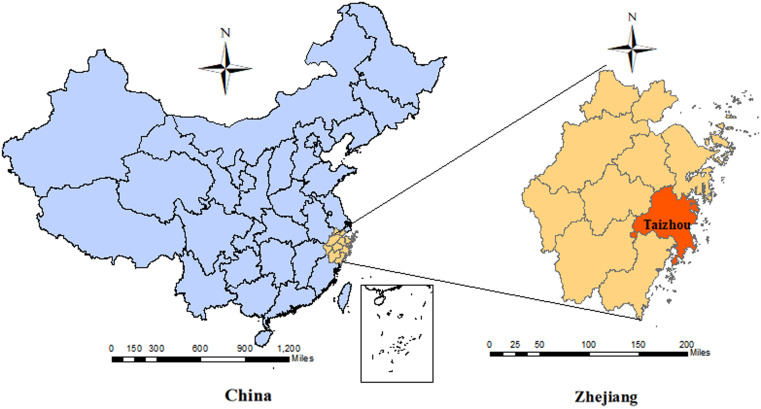
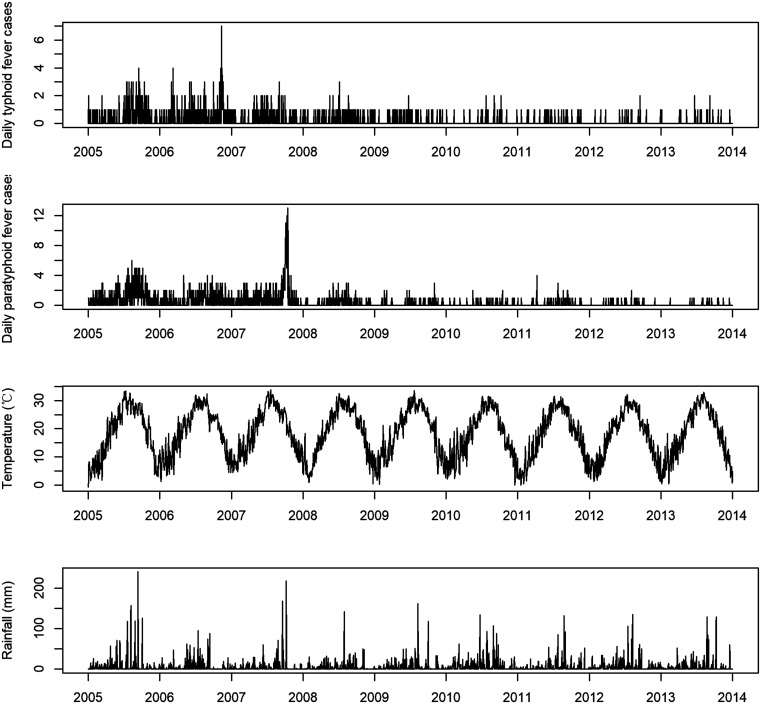
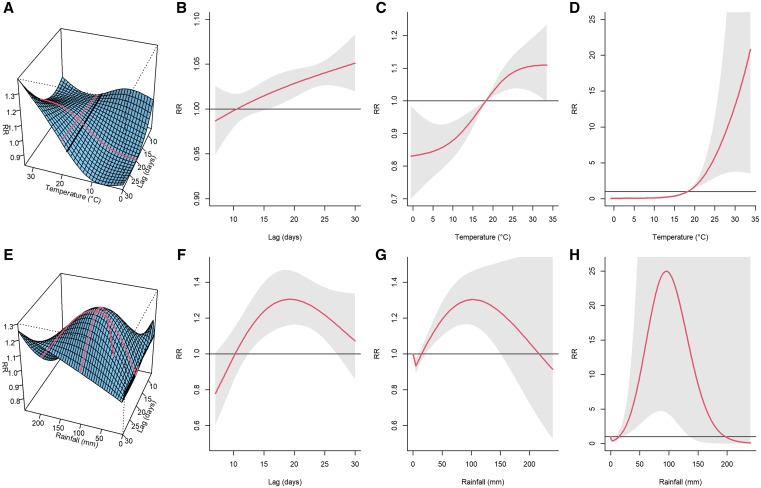
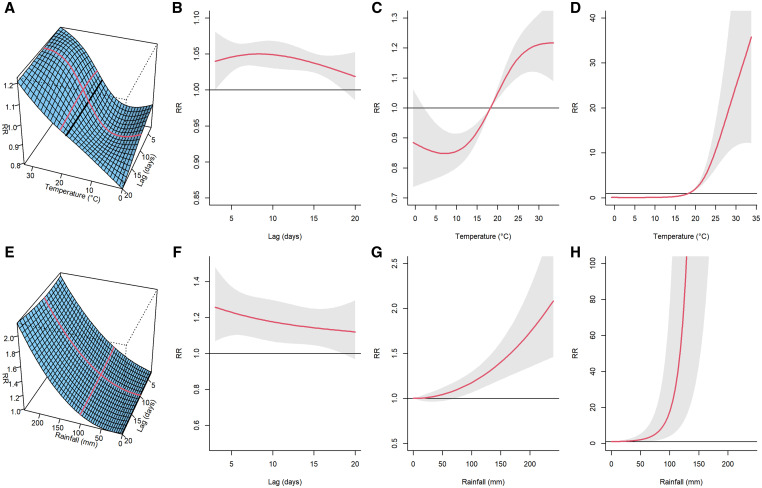
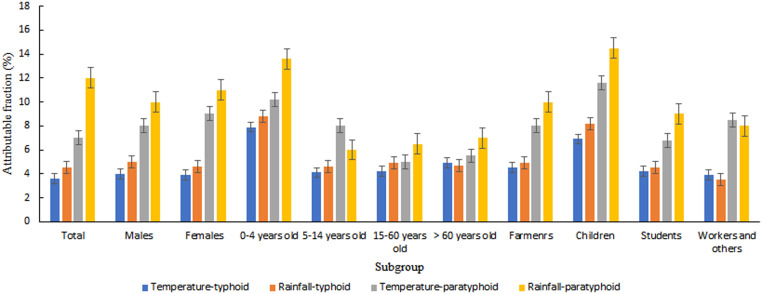
The impact of temperature and rainfall on the occurrence of typhoid/paratyphoid fever are not fully understood. This study aimed to characterize the effect of daily ambient temperature and total rainfall on the incidence of typhoid/paratyphoid in a sub-tropical climate city of China and to identify the vulnerable groups for disease prevention. Daily notified typhoid/paratyphoid fever cases and meteorological data for Taizhou from 2005 to 2013 were extracted from the National Notifiable Disease Surveillance System and the Meteorological Data Sharing Service System, respectively. Distributed lag nonlinear model was used to quantify the association between daily mean temperature, total rainfall, and typhoid/paratyphoid fever. Subgroup analyses by gender, age, and occupation were conducted to identify the vulnerable groups. A total of 625 typhoid fever cases and 1,353 paratyphoid fever cases were reported during the study period. An increased risk of typhoid fever was detected with the increase of temperature (Each 2°C rise resulted in 6%, 95% [confidence interval] CI: 2-10% increase in typhoid cases), while the increased risk was associated with the higher temperature for paratyphoid (the highest cumulative risk of temperature was 33.40 [95% CI: 12.23-91.19] at 33°C). After the onset of mild precipitation, the relative risk of typhoid fever increased in a short-lasting and with a 13-26 days delay, and the risk was no significant after the continuous increase of precipitation (the highest cumulative risk of rainfall was 24.96 [95% CI: 4.54-87.21] at 100 mm). Whereas the risk of paratyphoid fever was immediate and long lasting, and increase rapidly with the increase of rainfall (each 100 mm increase was associated with 26% increase in paratyphoid fever cases). Significant temperature-typhoid/paratyphoid fever and rainfall-typhoid/paratyphoid fever associations were found in both genders and those aged 0-4 years old, 15-60 years old, farmers, and children. Characterized with a lagged, nonlinear, and cumulative effect, high temperature and rainfall could increase the risk of typhoid/paratyphoid fever in regions with a subtropical climate. Public health interventions such as early warning and community health education should be taken to prevent the increased risk of typhoid/paratyphoid fever, especially for the vulnerable groups.
Figures
Similar articles
-
[Epidemiological features of typhoid/paratyphoid fever in provinces with high incidence rate and in the whole country, in 2012].Zhonghua Liu Xing Bing Xue Za Zhi. 2013 Dec;34(12):1183-8. Zhonghua Liu Xing Bing Xue Za Zhi. 2013. PMID: 24518016 Chinese.
-
[Epidemiological characteristics of typhoid fever and paratyphoid fever in China, 2004-2020].Zhonghua Liu Xing Bing Xue Za Zhi. 2023 May 10;44(5):743-750. doi: 10.3760/cma.j.cn112338-20221116-00977. Zhonghua Liu Xing Bing Xue Za Zhi. 2023. PMID: 37221062 Chinese.
-
[Surveillance data on typhoid fever and paratyphoid fever in 2015, China].Zhonghua Liu Xing Bing Xue Za Zhi. 2017 Jun 10;38(6):754-758. doi: 10.3760/cma.j.issn.0254-6450.2017.06.013. Zhonghua Liu Xing Bing Xue Za Zhi. 2017. PMID: 28647977 Chinese.
-
Seasonal dynamics of typhoid and paratyphoid fever.Sci Rep. 2018 May 2;8(1):6870. doi: 10.1038/s41598-018-25234-w. Sci Rep. 2018. PMID: 29720736 Free PMC article.
-
[Japanese clinical statistical data of patients with typhoid fever-paratyphoid fever and cholera].Nihon Rinsho. 1992 Nov;50 Suppl:546-57. Nihon Rinsho. 1992. PMID: 1344392 Review. Japanese. No abstract available.
Cited by
-
Study on association factors of intestinal infectious diseases based-Bayesian spatio-temporal model.BMC Infect Dis. 2023 Oct 24;23(1):720. doi: 10.1186/s12879-023-08665-3. BMC Infect Dis. 2023. PMID: 37875791 Free PMC article.
-
Mapping the incidence rate of typhoid fever in sub-Saharan Africa.PLoS Negl Trop Dis. 2024 Feb 26;18(2):e0011902. doi: 10.1371/journal.pntd.0011902. eCollection 2024 Feb. PLoS Negl Trop Dis. 2024. PMID: 38408128 Free PMC article.
-
Typhoid fever.Nat Rev Dis Primers. 2023 Dec 14;9(1):71. doi: 10.1038/s41572-023-00480-z. Nat Rev Dis Primers. 2023. PMID: 38097589 Review.
-
Spatiotemporal distribution and influencing factors of enteric fever in China: a cluster analysis based on data from 2001 to 2020.Front Public Health. 2025 Apr 9;13:1550904. doi: 10.3389/fpubh.2025.1550904. eCollection 2025. Front Public Health. 2025. PMID: 40270752 Free PMC article.
References
-
- Parry CM Hien TT Dougan G White NJ Farrar JJ , 2002. Typhoid fever. N Engl J Med 347: 1770–1782. - PubMed
-
- Popoff MY Bockemühl J Gheesling LL , 2004. Supplement 2002 (no. 46) to the Kauffmann-White scheme. Res Microbiol 155: 568–570. - PubMed
-
- Vollaard AM Ali S van Asten HA Widjaja S Visser LG Surjadi C van Dissel JT , 2004. Risk factors for typhoid and paratyphoid fever in Jakarta, Indonesia. JAMA 291: 2607–2615. - PubMed
Publication types
MeSH terms
LinkOut - more resources
Full Text Sources
