Review
. 2022;49(1-2):1-24.
doi: 10.1159/000520987. Epub 2021 Dec 6.

Methods for Monitoring Risk of Hypoxic Damage in Fetal and Neonatal Brains: A Review

Affiliations
Review

Methods for Monitoring Risk of Hypoxic Damage in Fetal and Neonatal Brains: A Review

Liaisan Uzianbaeva et al. Fetal Diagn Ther. 2022.

Abstract

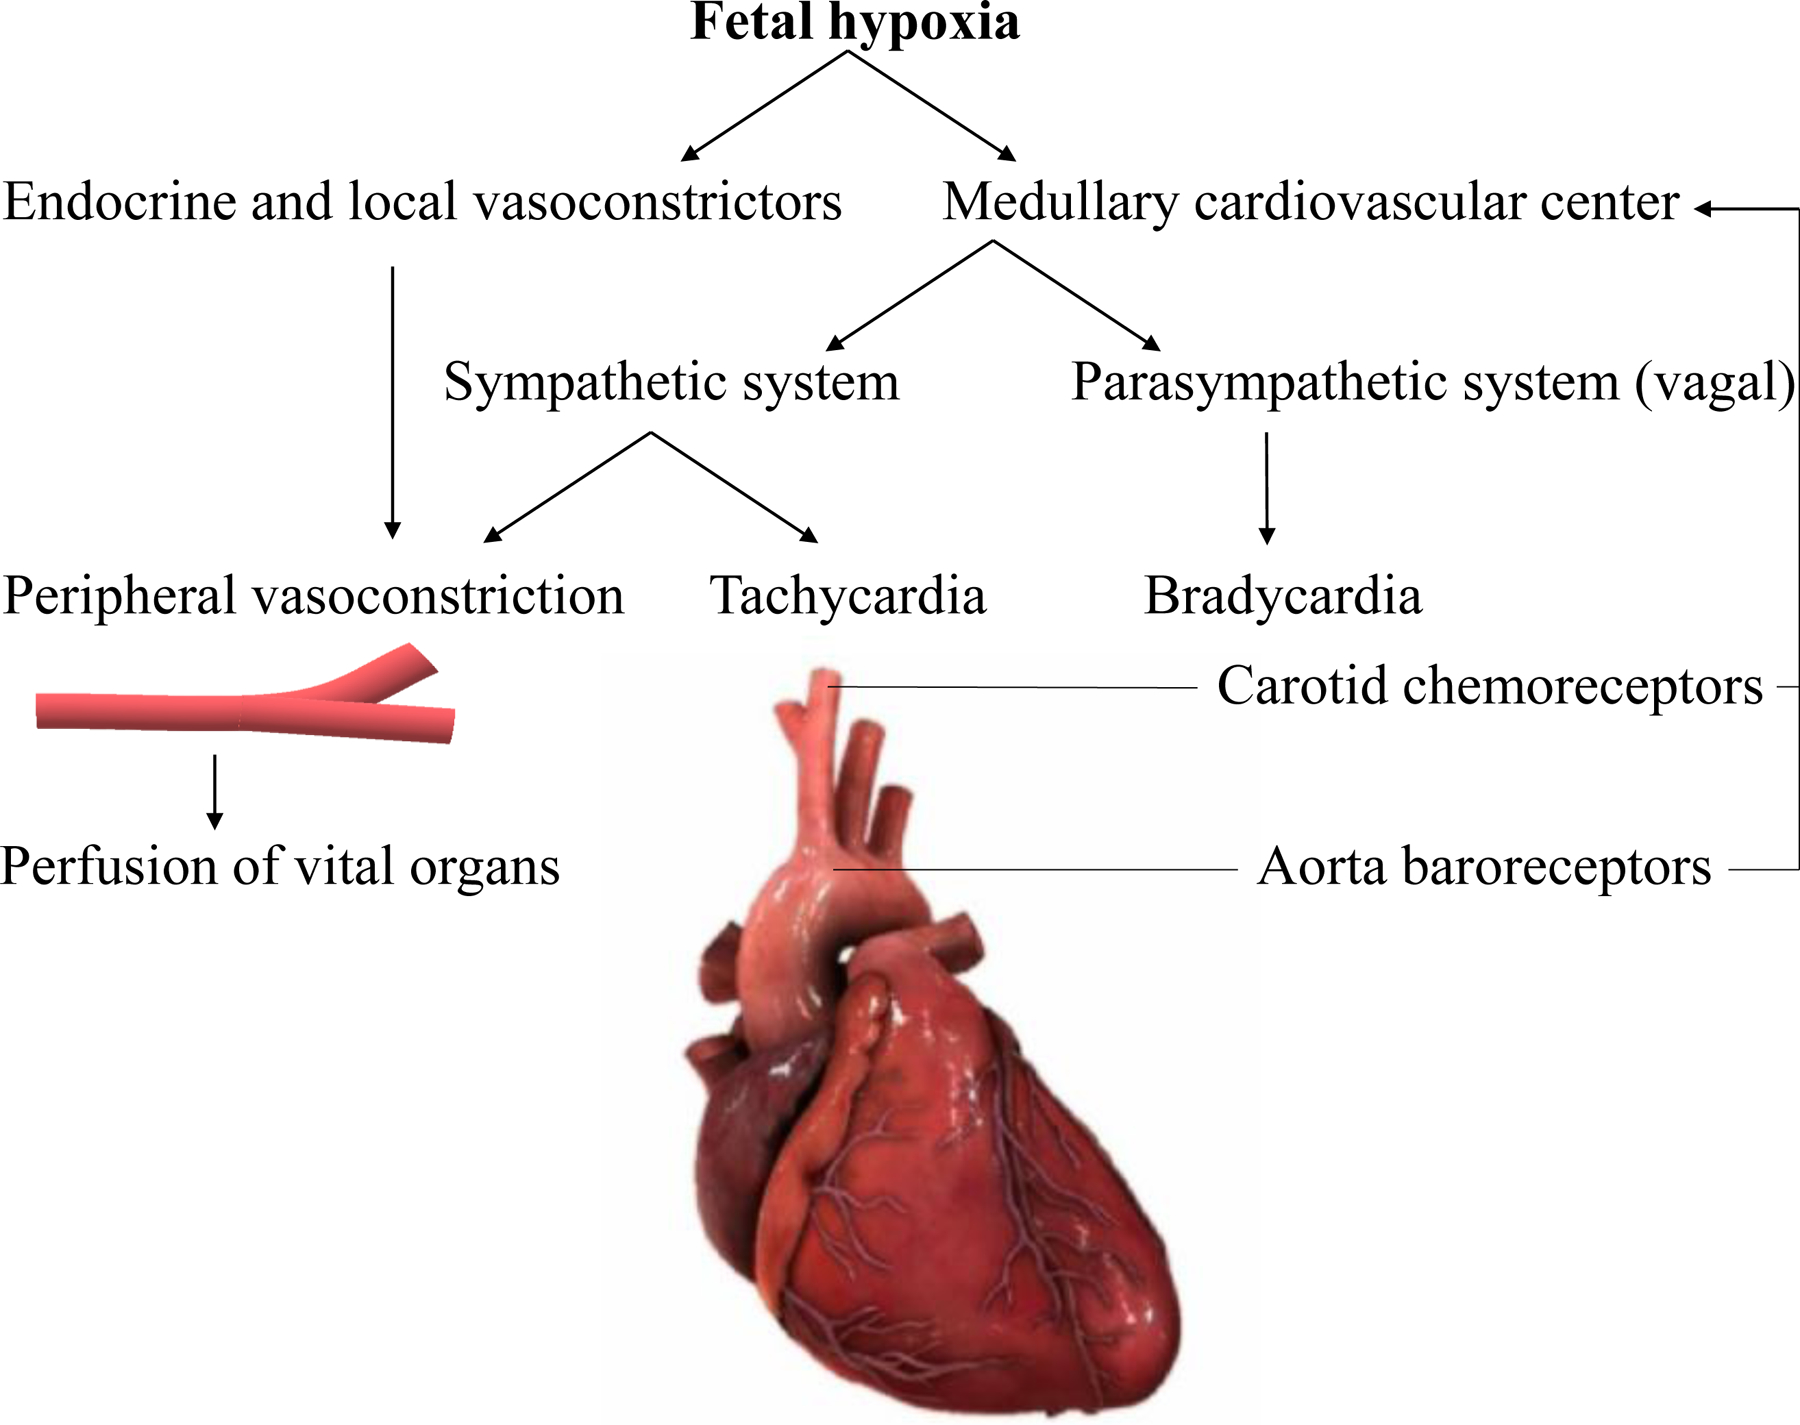
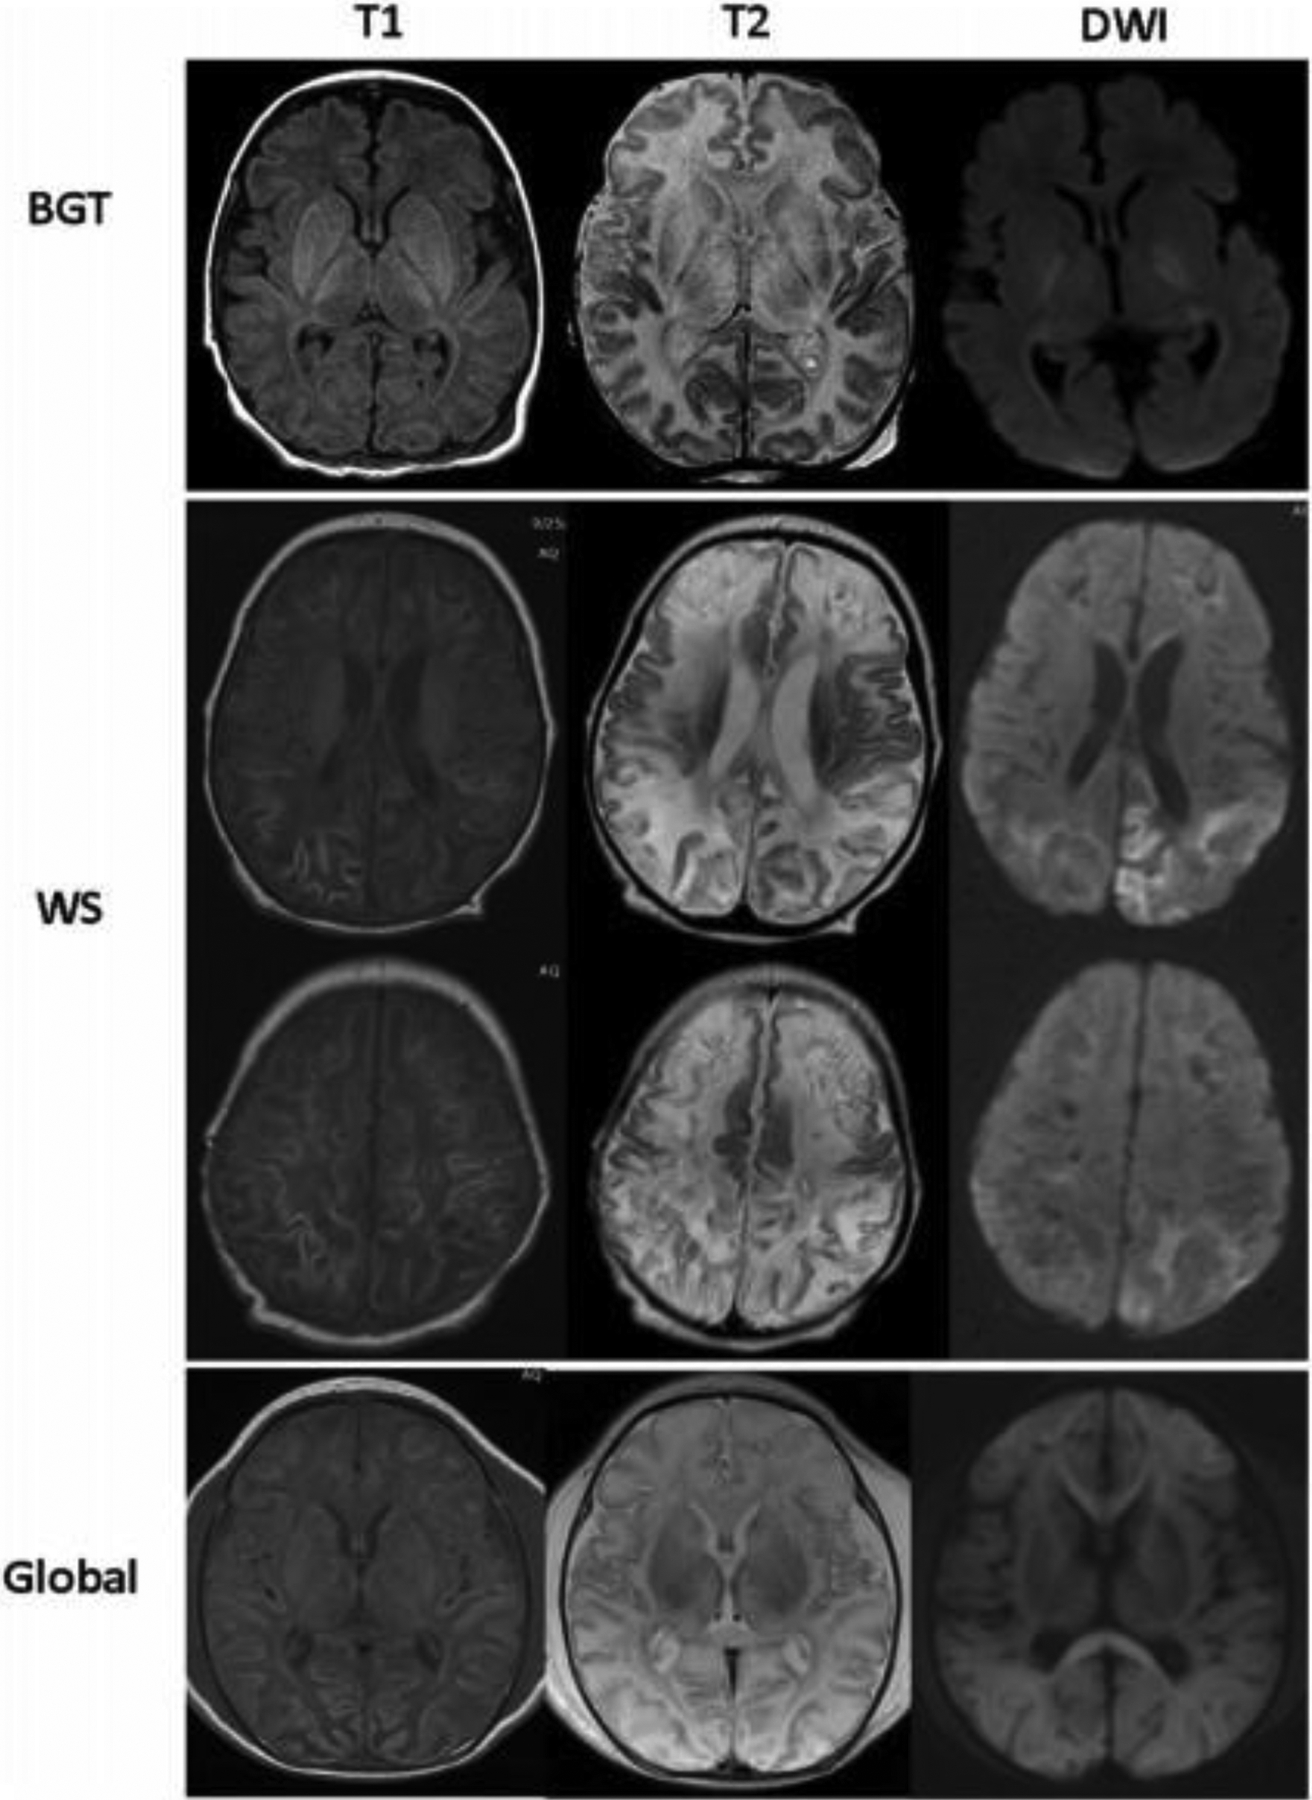
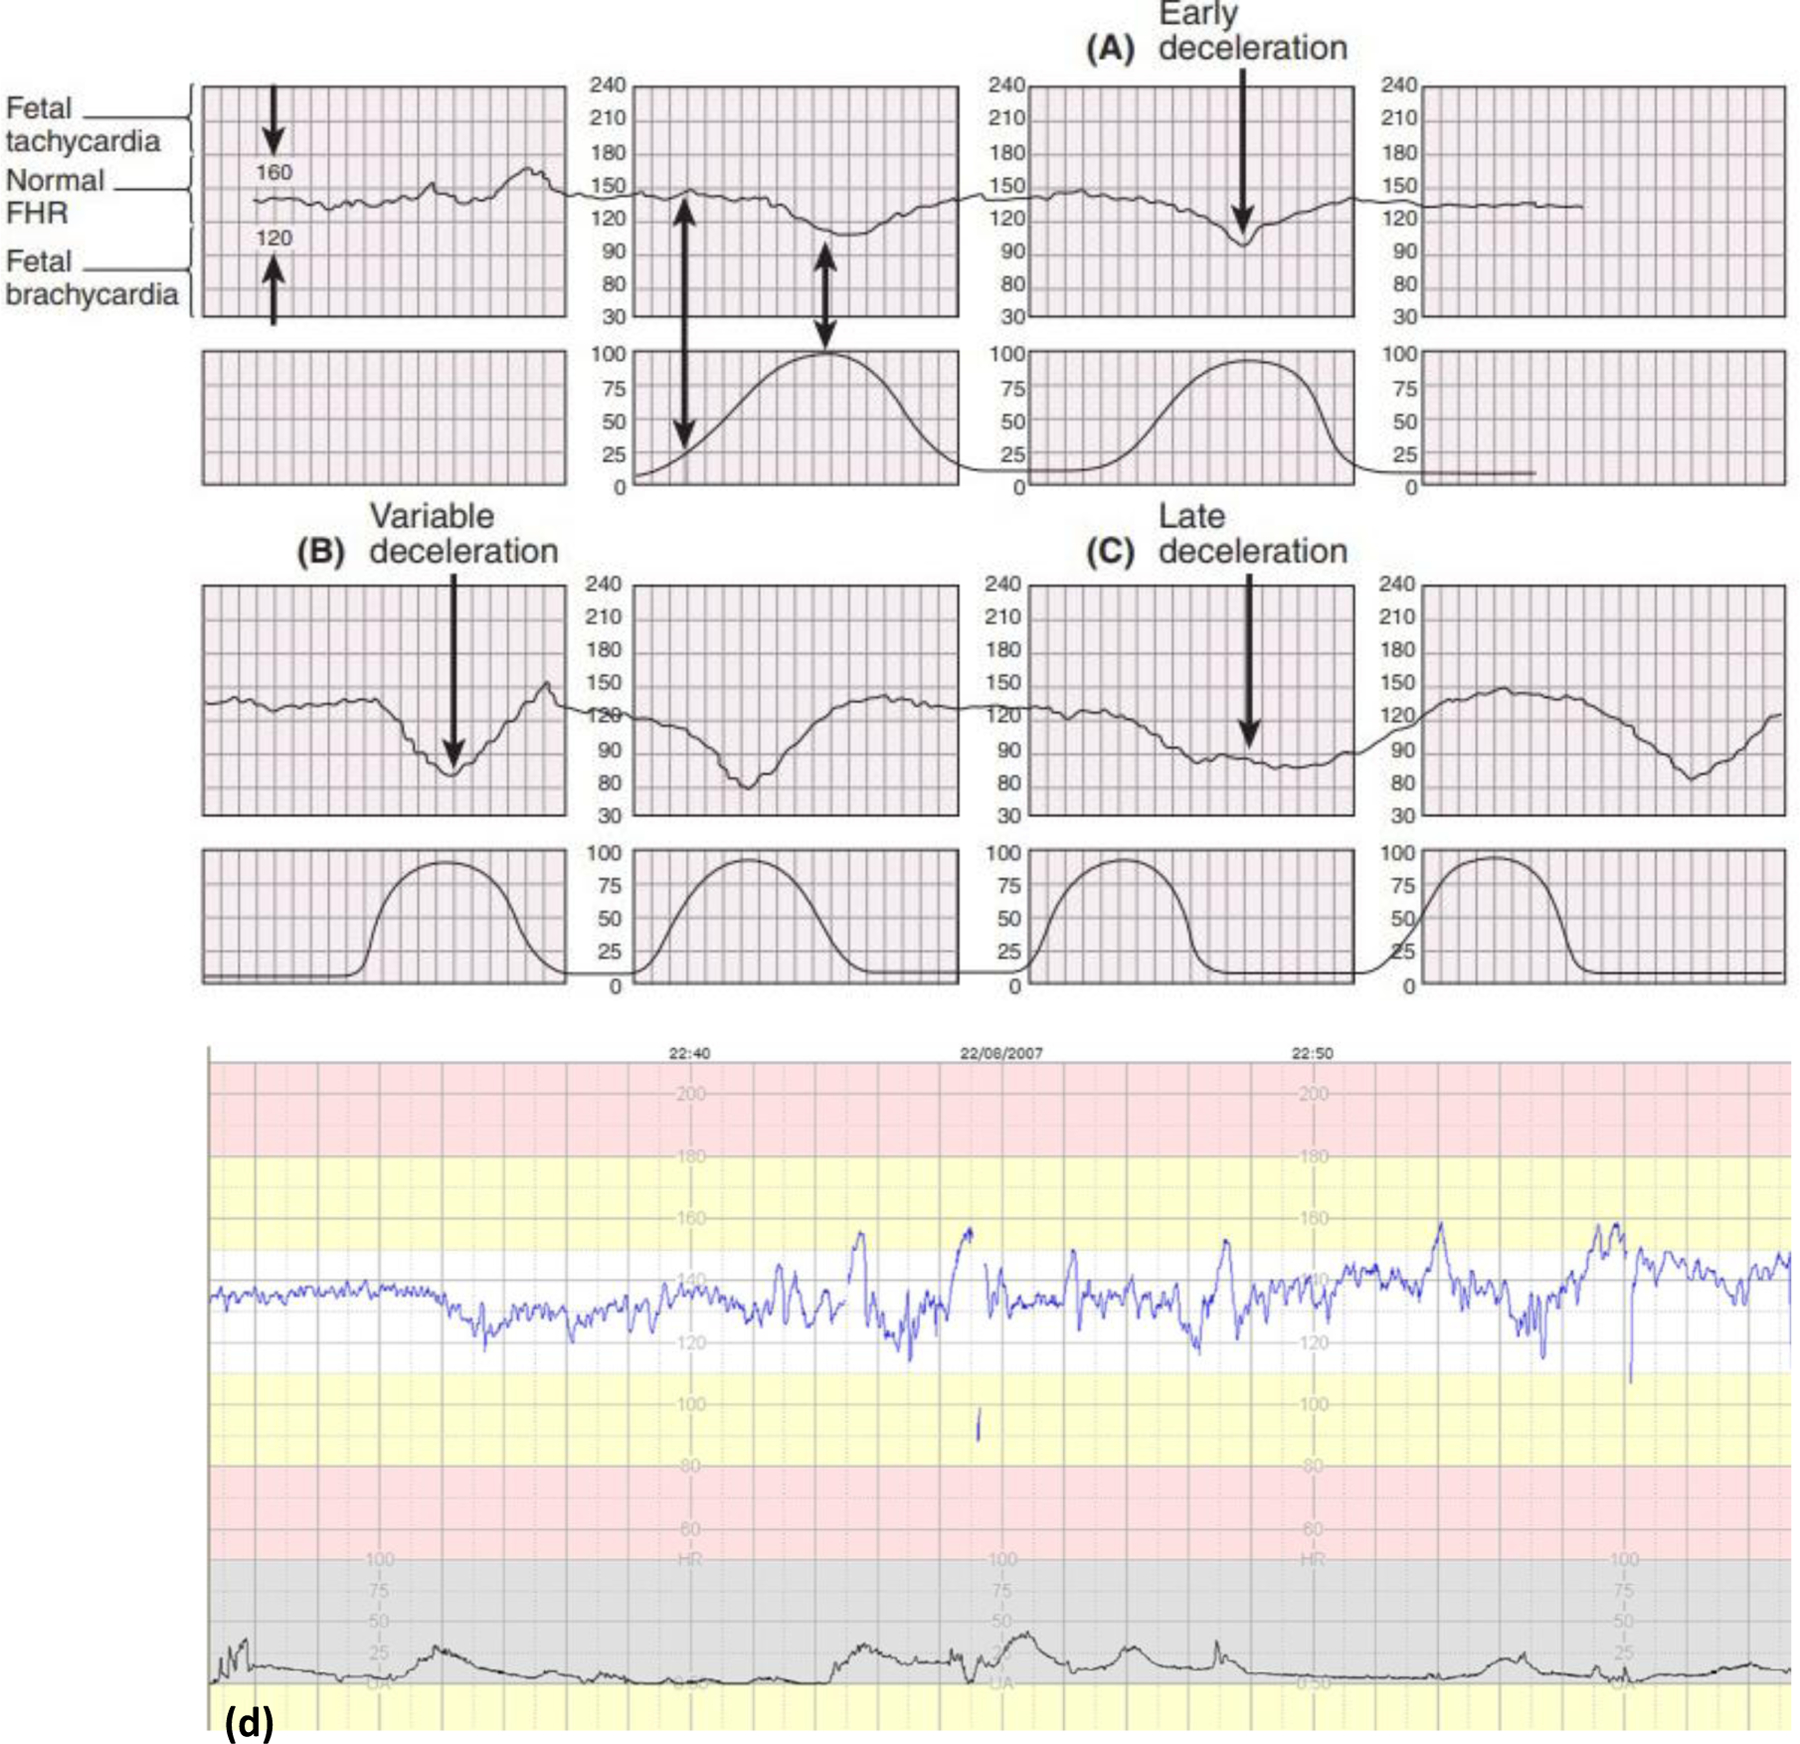
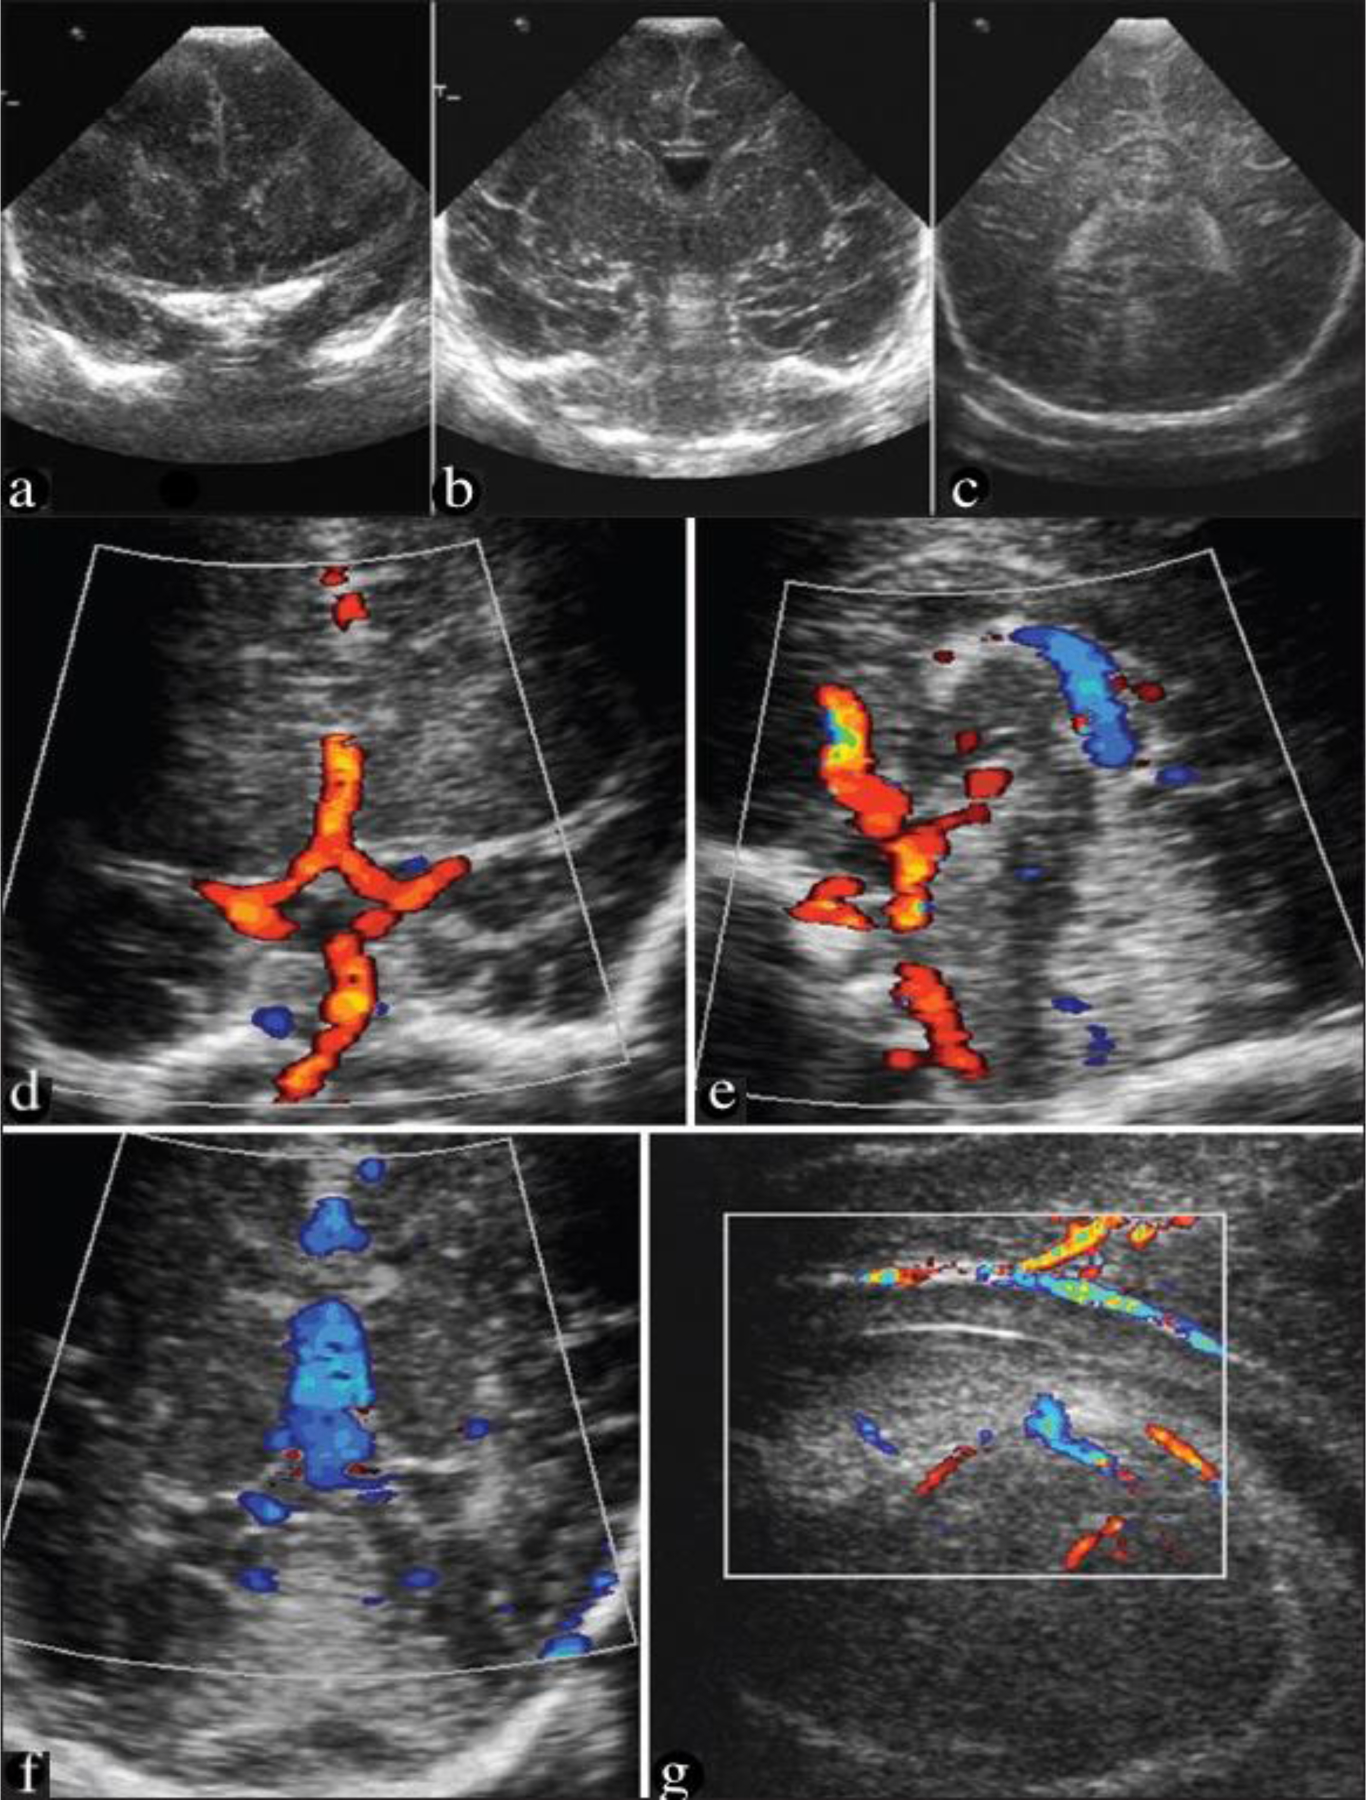
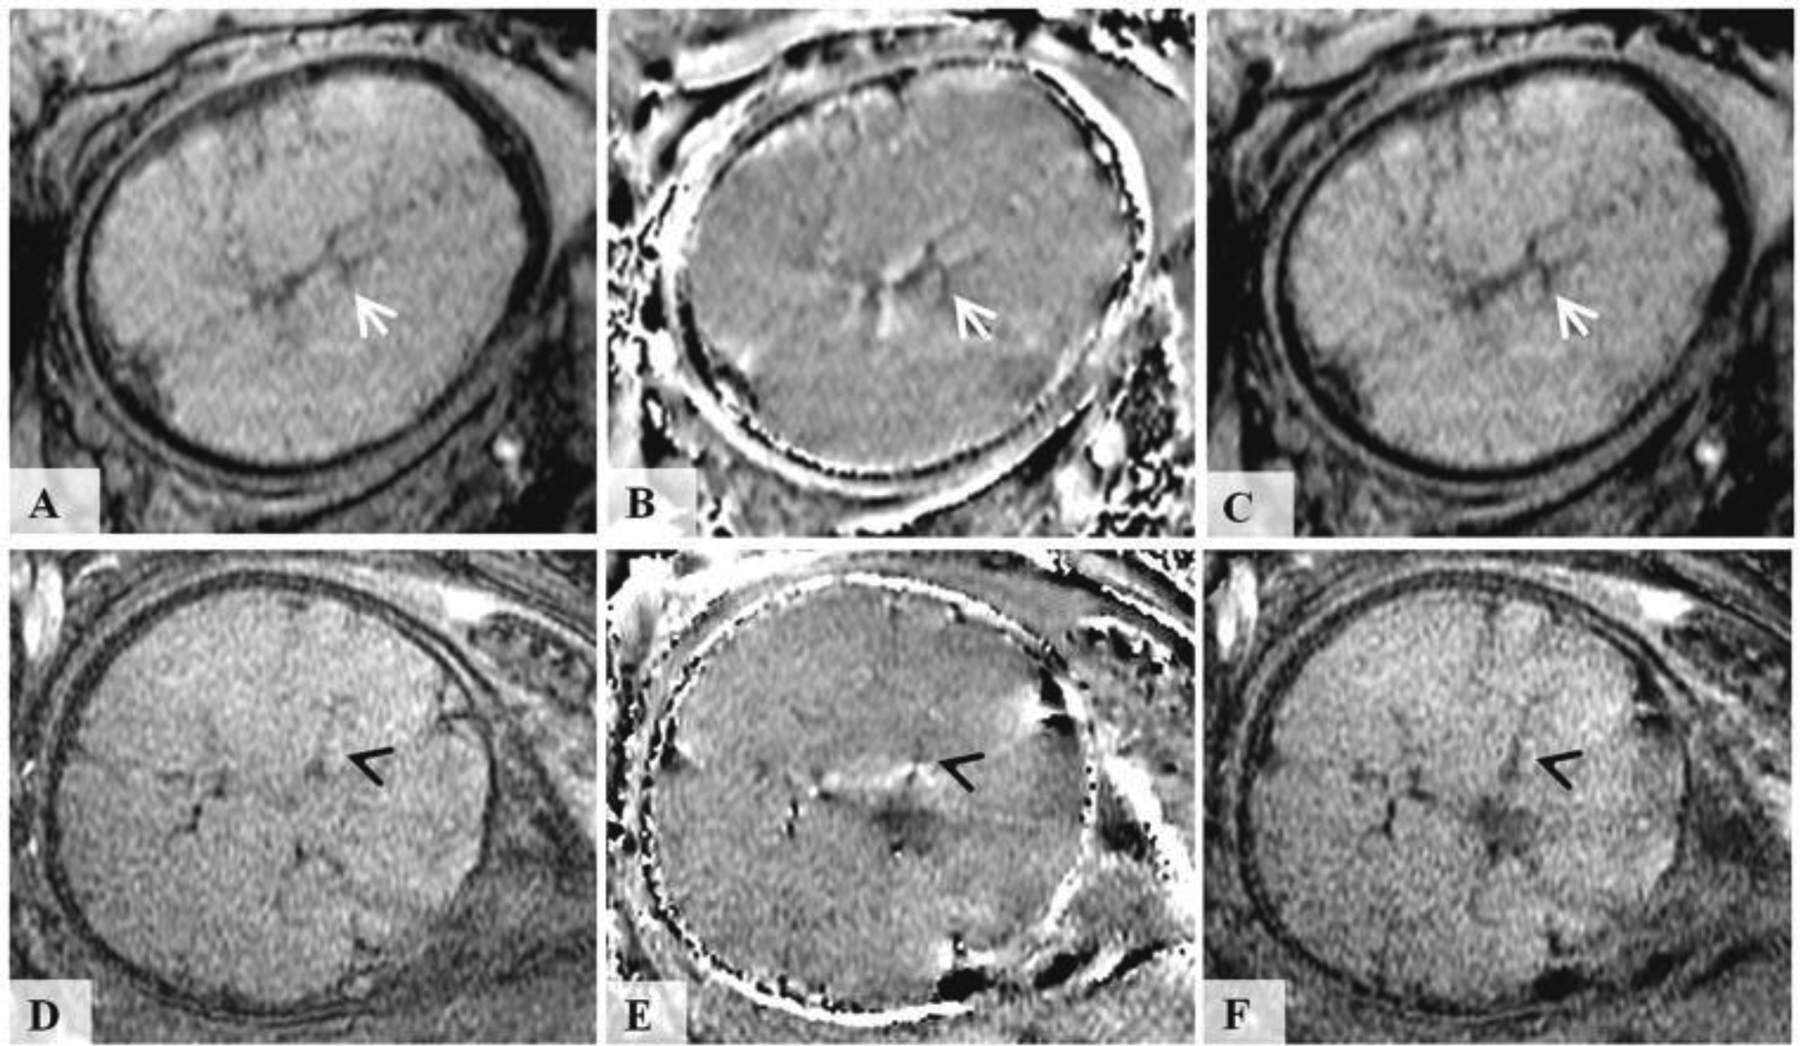
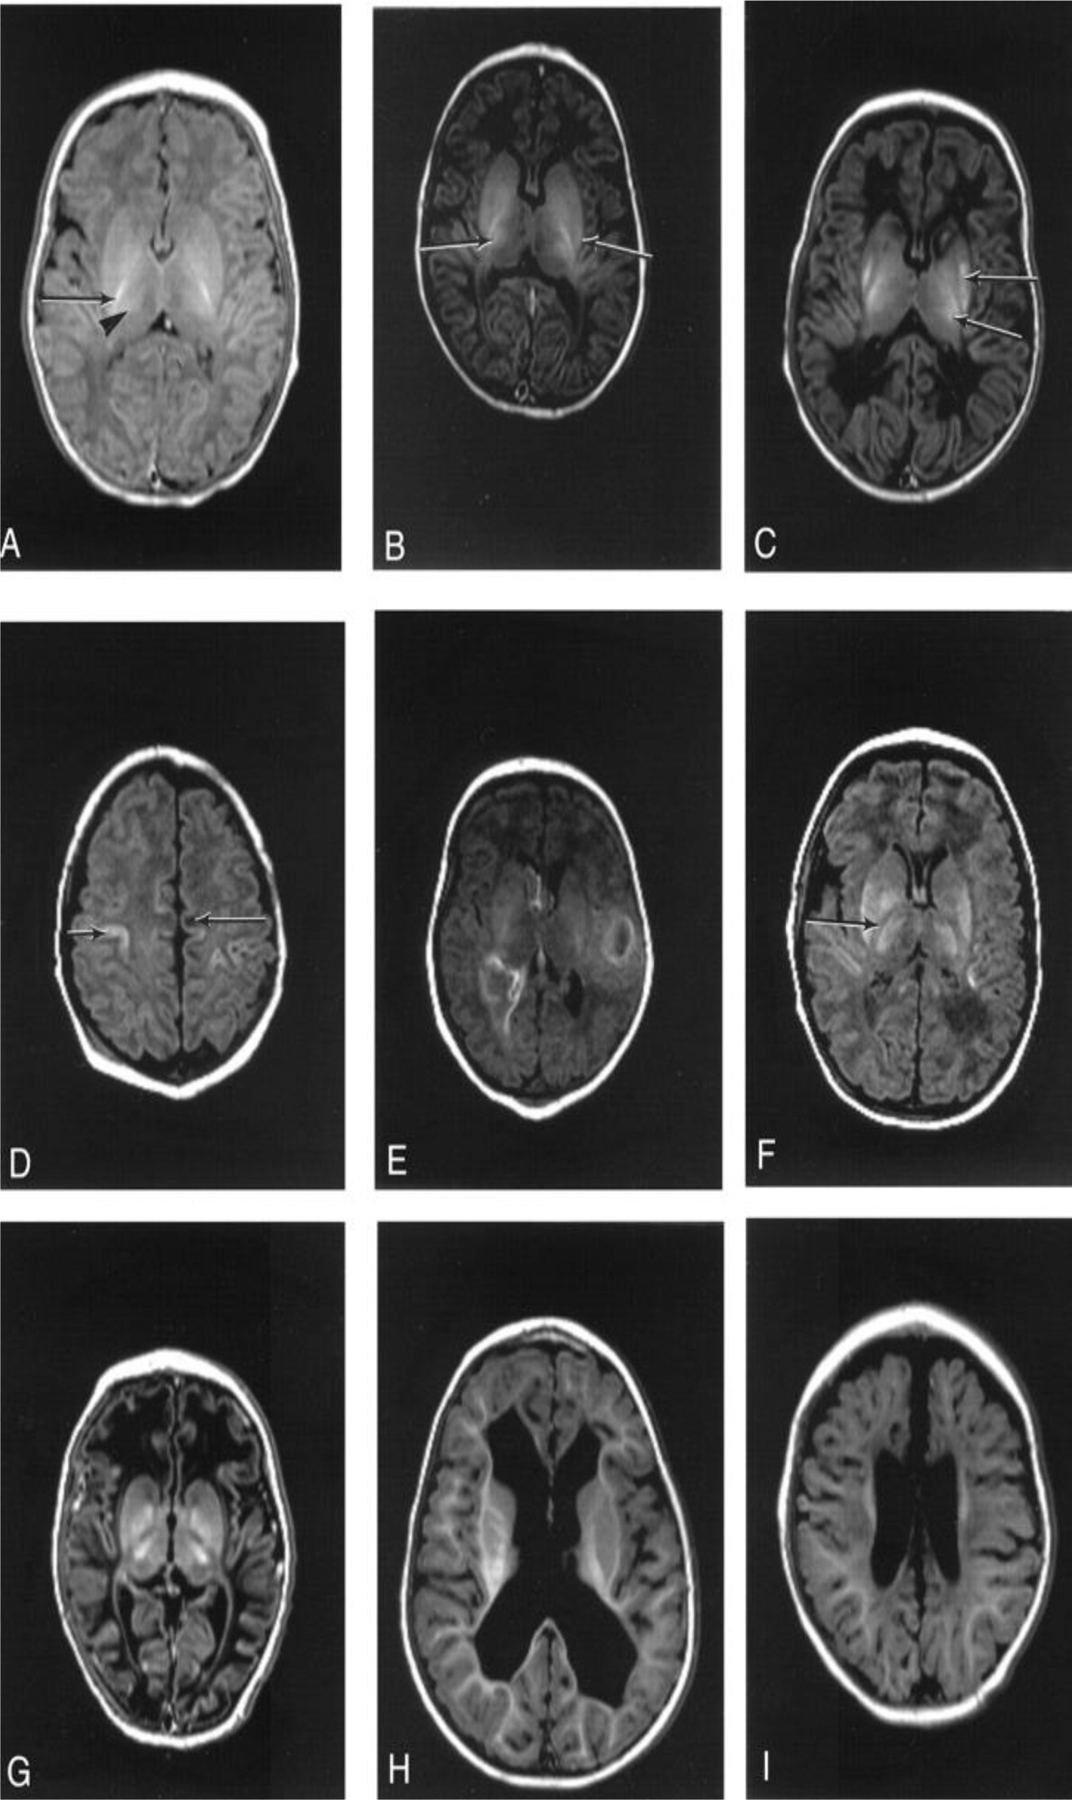
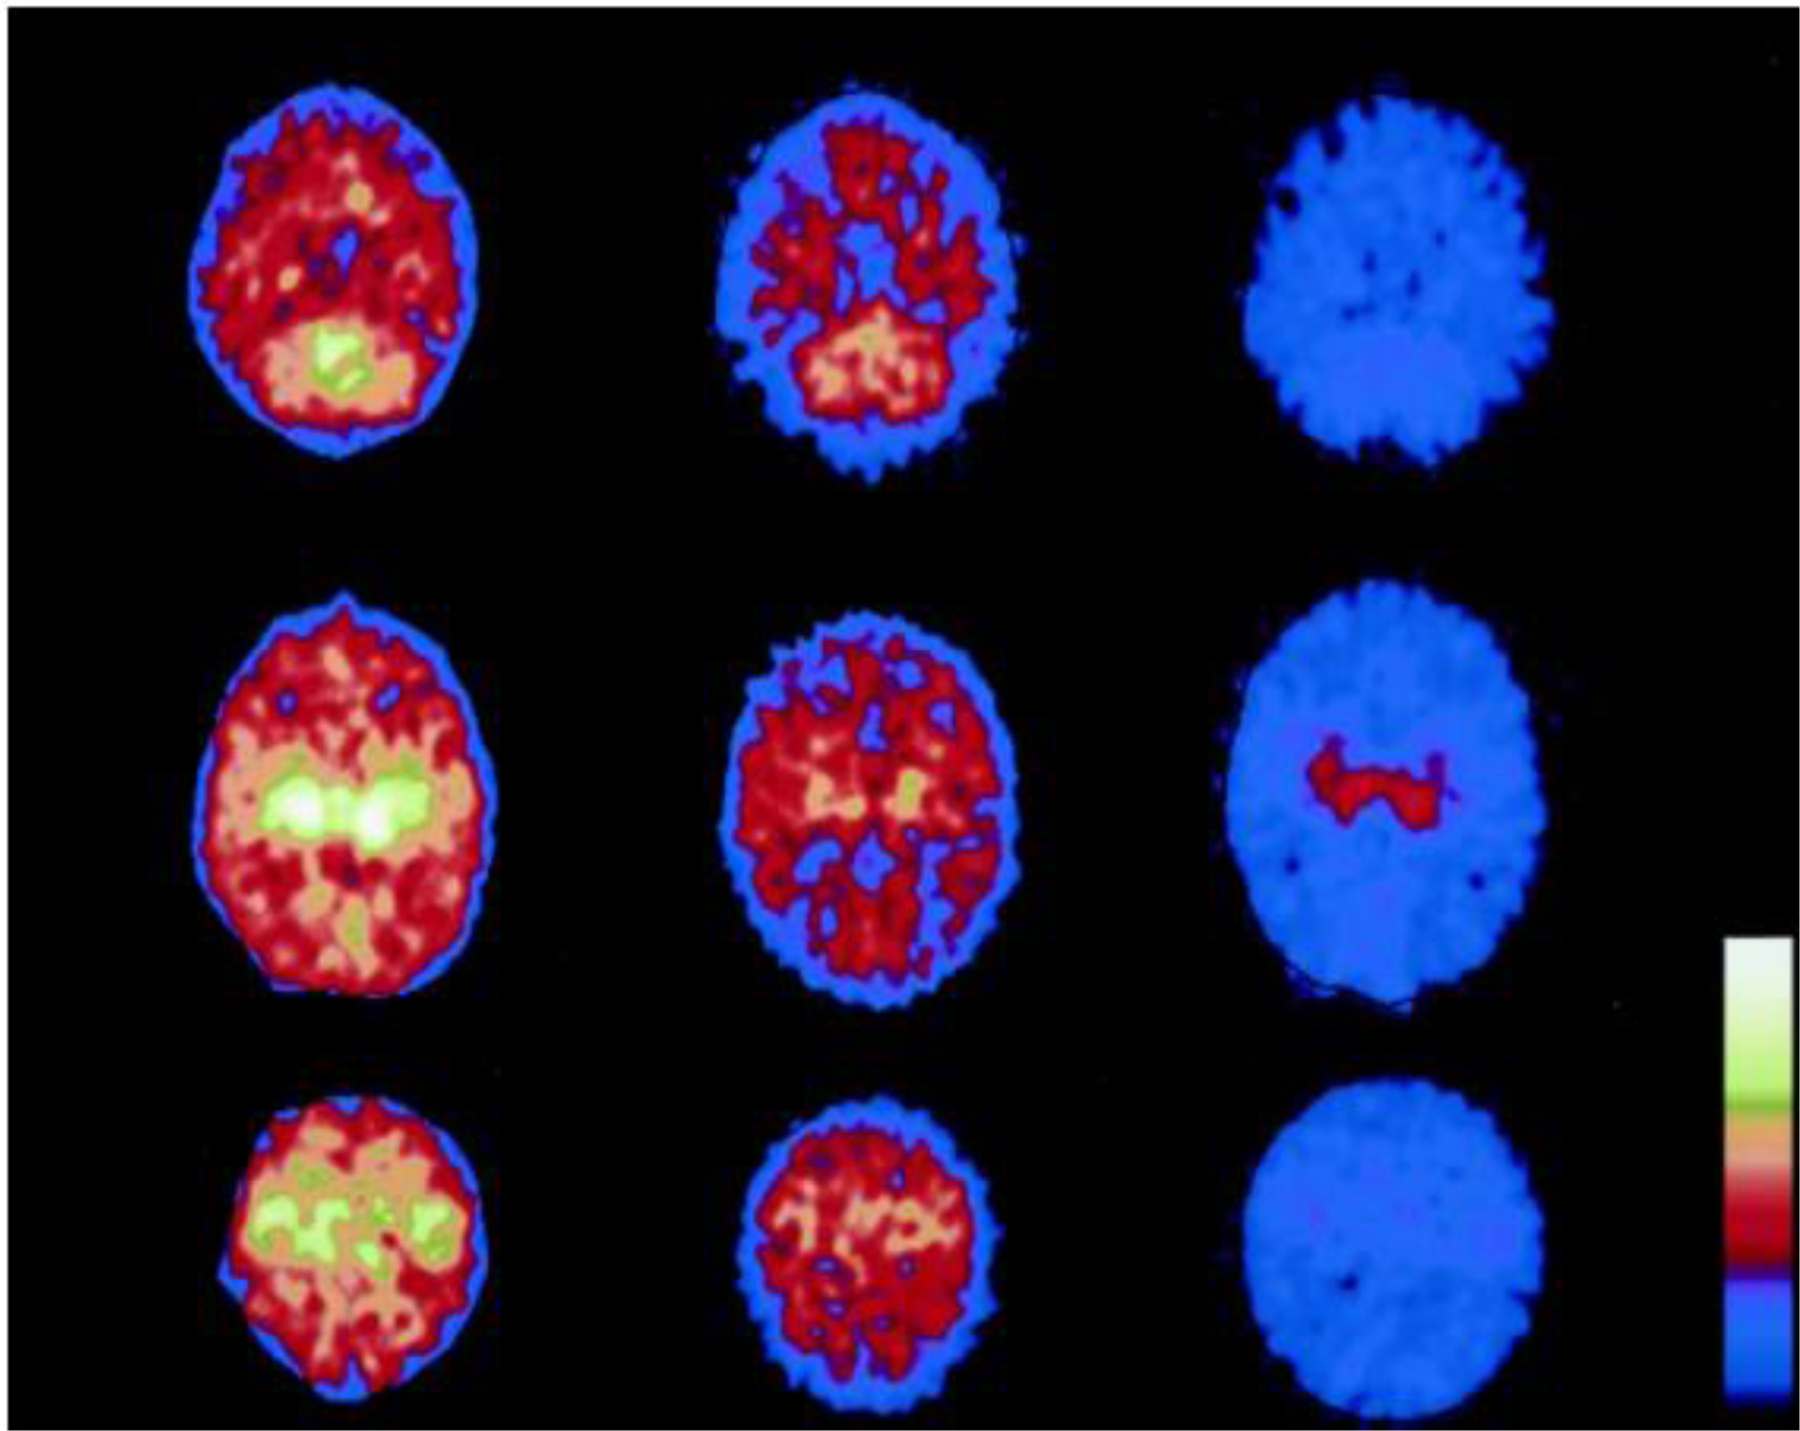
Fetal, perinatal, and neonatal asphyxia are vital health issues for the most vulnerable groups in human beings, including fetuses, newborns, and infants. Severe reduction in oxygen and blood supply to the fetal brain can cause hypoxic-ischemic encephalopathy (HIE), leading to long-term neurological disorders, including mental impairment and cerebral palsy. Such neurological disorders are major healthcare concerns. Therefore, there has been a continuous effort to develop clinically useful diagnostic tools for accurately and quantitatively measuring and monitoring blood and oxygen supply to the fetal and neonatal brain to avoid severe consequences of asphyxia HIE and neonatal encephalopathy. Major diagnostic technologies used for this purpose include fetal heart rate monitoring, fetus scalp blood sampling, ultrasound imaging, magnetic resonance imaging, X-ray computed tomography, and nuclear medicine. In addition, given the limitations and shortcomings of traditional diagnostic methods, emerging technologies such as near-infrared spectroscopy and photoacoustic imaging have also been introduced as stand-alone or complementary solutions to address this critical gap in fetal and neonatal care. This review provides a thorough overview of the traditional and emerging technologies for monitoring fetal and neonatal brain oxygenation status and describes their clinical utility, performance, advantages, and disadvantages.

Keywords: Blood flow; Diagnostic imaging; Fetal asphyxia; Hypoxic-ischemic encephalopathy; Magnetic resonance imaging; Neonatal asphyxia; Neonatal encephalopathy; Oxygenation; Photoacoustic imaging; Ultrasound; X-ray computed tomography.


Conflict of interest statement

Conflict of Interest Statement

Dr. Hernandez is an Editorial Board Member of Fetal Diagnosis and Therapy. The other authors have no conflicts of interest to declare.

Figures

Fig. 1.
Fig. 1.
Physiology of fetal brain sparing during hypoxia. Carotid chemoreflex activation leads to bradycardia through the vagal nerve stimulation and increase in peripheral vasoconstriction. Hormones and local vascular mediators further maintain peripheral vasoconstriction.
Fig. 2.
Fig. 2.
Patterns of brain injury in neonates with HIE on T1-weighted, and diffusion-weighted (DWI) images. BGT, basal ganglia/thalamic predominant injury; WS, watershed injury with cortical laminar necrosis and subcortical white matter injury, and global pattern with total cerebral injury (Adopted from [11] Figure 1)
Fig. 3.
Fig. 3.
Patterns of brain injury in HIE. Schematic shows the premature neonatal brain (left side) and term infant brain (right side). It illustrates how the vascular supply changes with maturation and affects the pattern of brain injury in HIE. The premature neonatal brain (left side) has a ventriculopetal vascular pattern, and hypoperfusion results in a periventricular border zone (red shaded area) of white matter injury. In the term infant (right side), a ventriculofugal vascular pattern develops as the brain matures, and the border zone during hypoperfusion is more peripheral (red shaded area) with subcortical white matter and parasagittal cortical injury. (Adopted from [24] Figure 2)
Fig. 4.
Fig. 4.
Fetal Heart Rate patterns (a) Early deceleration. (b) Variable deceleration. These decelerations may start before, during, or after a uterine contraction starts. (c) Late deceleration. The onset, nadir, and recovery of the deceleration occur, respectively, after the beginning, peak, and end of the contraction (Adopted from [45] Fig. 9.11). (d) An example of normal CTG showing stable baseline fetal HR of about 130 bpm. It shows no decelerations, normal baseline variability, accelerations, and fetal cycling activity (Adopted from [47]).
Fig. 5.
Fig. 5.
(a) Fetal scalp Blood Sampling. The Figure shows the incision site of the lancet and placement of the cone against the scalp. (Adopted from [45] Fig 9.12). (b) Shown the sensitivity and specificity for fetal scalp PH values as well as active and negative predictive values for pathological (P), and pathological and suspect (P + S) FIGO criteria. (Adopted from [14]).
Fig. 6.
Fig. 6.
The FSpO2 monitoring system: a) and b) show a single use, sterile, disposable sensor that is inserted through the cervix into the uterus which rests against the fetal temple, cheek or forehead (Adopted from [70] Figure 1 and 2), c) shows position of the NIRS sensors for the purpose of monitoring continuously mixed venous saturation, two neonatal NIRS sensors are placed respectively on each side of the newborn’ s forehead, over the area of frontal lobes. (Adopted from [69] Figure 1).
Fig. 7.
Fig. 7.
Boxplots of (a) near infrared spectroscopy (NIRS) cerebral regional haemoglobin oxygen saturation (CrSO2), (b) peripheral perfusion index (PI), (c) heart rate (HR) and (d) capillary oxygen saturation (SpO2) in PH-IVH patients (left boxplots) and healthy age-matched controls (right boxplots). On each box, the central mark is the median, the square is the mean, the stars are the individual data, the edges of the box are the 25th and 75th percentiles, and the whiskers show the 95%onfidence interval. Empty circles denote outliers and statistical comparisons are indicated with corresponding p-values (n.s., non-significant). (Adopted from [71] Figure 1).
Fig. 8.
Fig. 8.
(a) Temporal distributions of (first line) near infrared spectroscopy (NIRS) cerebral regional hemoglobin oxygen saturation (CrSO2), (second line) peripheral perfusion index (PI), (third line) heart rate (HR) and (fourth line) capillary oxygen saturation (SpO2) in PH-IVH patients (left column) and healthy age-matched controls (right column) in the first 72 hr of life. On each plot, the black curve is the mean, and the grey shaded region represents one standard deviation of the group. (b) Example of the complete analytical workow in a healthy control (left column) and in an infant with pulmonary (PH) and/or intraventricular haemorrhage (IVH, right column): (first line) and (second line) depict temporal distributions of near infrared spectroscopy (NIRS) cerebral regional hemoglobin oxygen saturation (CrSO2) and peripheral perfusion index (PI) in the first 72 hr of life, respectively; (third-sixth line) display the amplitude of the cross-correlation, the semblance (anti-phase and in-phase), the amplitude of the gain (transfer function) and the coherence between CrSO2 and PI in the time-frequency space. Regions that are statistically significant are comprised in a black bold contour. A dashed white line indicates the selected ultra-frequency band of slow and prolonged periods of >1 h (<0.28 mHz) used for statistical analysis. (Adopted from [71] Figure 2 and 3).
Fig. 9.
Fig. 9.
Coronal USG at the level of frontal lobes (a), foramina of Monro (b), and trigone (c), demonstrating the interhemispheric fissure, lateral ventricles, and periventricular parenchyma. Doppler images (d & e) demonstrating the circle of Willis. Coronal USG is demonstrating the vein of Galen, f) a parasagittal study showing the small periventricular veins in the region of the caudothalamic groove (g). (Adopted from [80] Figure 9 A-D and Figure 6 A-C).
Fig. 10.
Fig. 10.
Susceptibility weighted images of the fetal brain. The top row images were acquired in the axial orientation relative to the fetus using 3D SWI sequence at 3.0T field strength from a fetus at 36 weeks of gestation. The bottom row images were acquired in coronal orientation relative to the fetus using a 2D SWI sequence at 1.5T field strength from a fetus at 35 weeks of gestation. Fig (a, d) show the original magnitude images. Fig (b, e) corresponds to filtered phase images. Fig (c, f) corresponds to susceptibility weighted magnitude image (SWI). (Adopted from [97] Figure 1).
Fig. 11.
Fig. 11.
Patterns of injury identified on neonatal MRI. A, Normal appearances control term infant 2 days old). There are: normal high signal from myelin in the posterior half of the PLIC (arrow), more diffuse high signal in the lateral thalamus secondary to myelination in the nuclei (arrowhead), normal gray/white matter differentiation in the cerebral hemispheres. B, Mild basal ganglia: infant 4 days old with stage 2 HIE. There are small focal high-signal areas in the inferior thalamus and lentiform. C, Moderate basal ganglia: infant 20 days old with stage 2 HIE. There are: focal high-signal intensity regions in the lentiform and thalami (arrows), equivocal signal intensity within the PLIC (arrowhead). D, Moderate white matter: infant 20 days old with stage 2 HIE. There are: areas of focal low-signal intensity in the subcortical white matter (arrow), abnormal high-signal intensity in the cortex around the central sulcus (arrowhead). E, Severe white matter with hemorrhage: infant 5 days old with stage 2 HIE. There are: areas of high-signal intensity consistent with hemorrhage and areas of loss of gray/white matter differentiation. F, Severe basal ganglia lesions: infant 8 days old with stage 2 HIE. There are: abnormal areas of high-signal intensity in the lentiform and thalami, abnormal low-signal intensity within the PLIC. G, Severe basal ganglia, and severe white matter lesions: infant 11 days old with stage 2 HIE. There are: abnormal signal intensity in the basal ganglia and thalami, loss of the normal high-signal intensity from myelin within the posterior limb, abnormal low-signal intensity in the white matter with loss of the normal gray/white matter differentiation, particularly in the frontal lobes. H, Follow-up imaging/ventricular dilatation: infant 1 year 5 months of age with stage 2 HIE (same case as E). There is marked irregular dilatation of the ventricles. The extracerebral space is normal. I, Follow-up imaging/ventricular dilatation with widened extracerebral space: infant 1 year old with stage 2 HIE (same case as G). There is moderate ventricular dilatation and widening of the frontal extracerebral space and interhemispheric fissure. (Adopted from [109] Figure 1.)
Fig. 12.
Fig. 12.
Total and regional cerebral glucose metabolism (CMRgl) measured in the subacute period (10–11 d) after birth asphyxia in three infants with different degrees of HIE. PET scan shows that the most metabolically active brain areas were the deep subcortical parts, thalamus, basal ganglia, and sensorimotor cortex, whereas the cortical areas (frontal, parietal, and occipital regions) were less metabolically active. Regional CMRglc in cerebellum (top), thalamus (middle), and sensorimotor cortex (bottom). The infant to the right (HIE-3) has developed CP (tetraplegia) with complicated seizures. The infant to the left (HIE-1) is healthy (2-y follow-up). The scale of the different images is identical. (Adopted from [115] Figure 2.)
Fig. 13.
Fig. 13.
Single element focused USPA system for imaging the neonatal brain. Fig (A) & (B) show photoacoustic signals from a vessel embedded beneath the infant skull, where (A) is induced by solid-beam illumination and (B) is induced by dark-field illumination. Fig (C) shows photoacoustic measurements of the blood oxygenation levels through the infant skull in comparison with the readouts from a pulse-oximeter. Fig (D) represents the geometry of reflection mode transcranial photoacoustic imaging of brain. Adopted from [139]). Fig (E) Noninvasix® Photoacoustic oxymetry System. Noninvasix’s system utilizes optoacoustic monitoring of cerebral venous oxygenation to accurately measure the amount of oxygen a neonate is receiving in real time.
Fig. 14.
Fig. 14.
(a) Schematic of a TVUS and fiber optics light delivery. (b) CAD design of fiber holding sheath. (c) Photograph of the prototype an Endocavity US and PA probe, which illuminates the target tissue with a focused (line-like) illumination pattern at 25 mm away from probe surface. The system has a diameter of 29 mm (under clinical requirements for transvaginal imaging). It can provide functional and molecular images at high resolution (200 μm @ 25 mm depth), and high penetration depth (> 20 mm) in brain. (d) Normalized FMBV image (green mask) overlaid on top of acquired Doppler image, indicating the blood volume is 31%. (e) Blood SO2 measure by sPA vs. gold standard blood gas analysis. A high correlation (R2=0.87) was found between sPA measurements of blood SO2 and the gold standard. These results suggest high accuracy and reliability of sPA imaging to evaluate blood oxygenation. The 46% oxygenation, as the lowest SO2 level is relatively close to the fetal SO2 threshold during labor (%35 to %40). (Adopted from [133]).

Similar articles

Cited by

References

    1. Encephalopathy N, and Neurologic Outcome, “Report of the American College of Obstetricians and Gynecologists’ Task Force on neonatal encephalopathy,” Obstet Gynecol, vol. 123, no. 4, pp. 896–901, 2014. - PubMed
    1. Graham EM, Ruis KA, Hartman AL, Northington FJ, and Fox HE, “A systematic review of the role of intrapartum hypoxia-ischemia in the causation of neonatal encephalopathy,” American journal of obstetrics and gynecology, vol. 199, no. 6, pp. 587–595, 2008. - PubMed
    1. Thornberg E, Thiringer K, Odeback A, and Milsom I, “Birth asphyxia: incidence, clinical course and outcome in a Swedish population,” Acta paediatrica, vol. 84, no. 8, pp. 927–932, 1995. - PubMed
    1. Kurinczuk JJ, White-Koning M, and Badawi N, “Epidemiology of neonatal encephalopathy and hypoxic–ischaemic encephalopathy,” Early human development, vol. 86, no. 6, pp. 329–338, 2010. - PubMed
    1. Barcroft J, “The Croonian lecture-Foetal respiration,” Proceedings of the Royal Society of London. Series B-Biological Sciences, vol. 118, no. 808, pp. 242–263, 1935.