. 2022;15(1):10-34.
doi: 10.1159/000519382. Epub 2021 Dec 6.

Quantile-Dependent Heritability of Glucose, Insulin, Proinsulin, Insulin Resistance, and Glycated Hemoglobin

Affiliations

Quantile-Dependent Heritability of Glucose, Insulin, Proinsulin, Insulin Resistance, and Glycated Hemoglobin

Paul T Williams. Lifestyle Genom. 2022.

Abstract

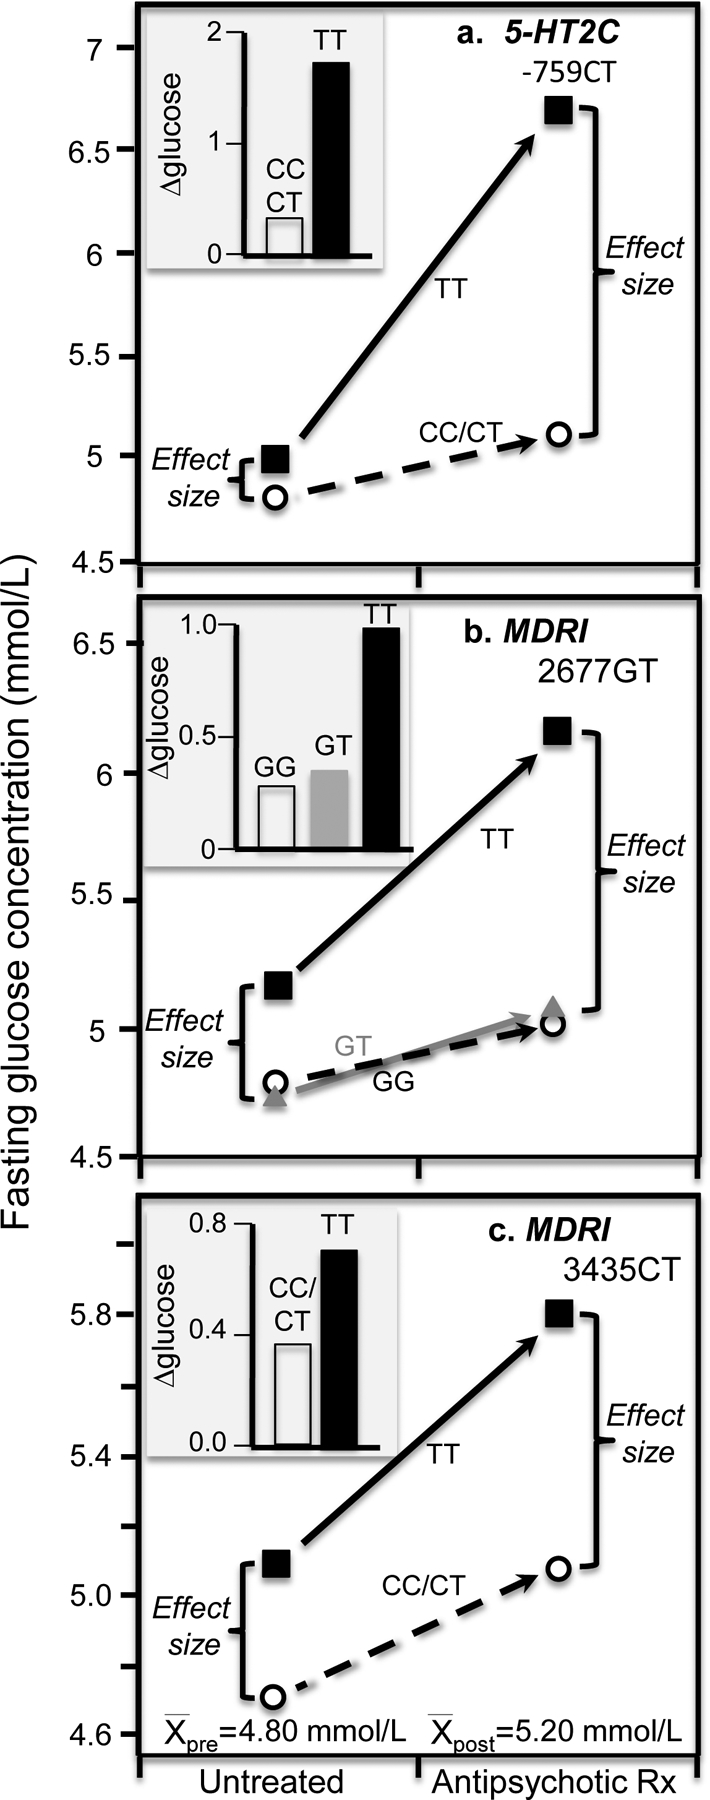
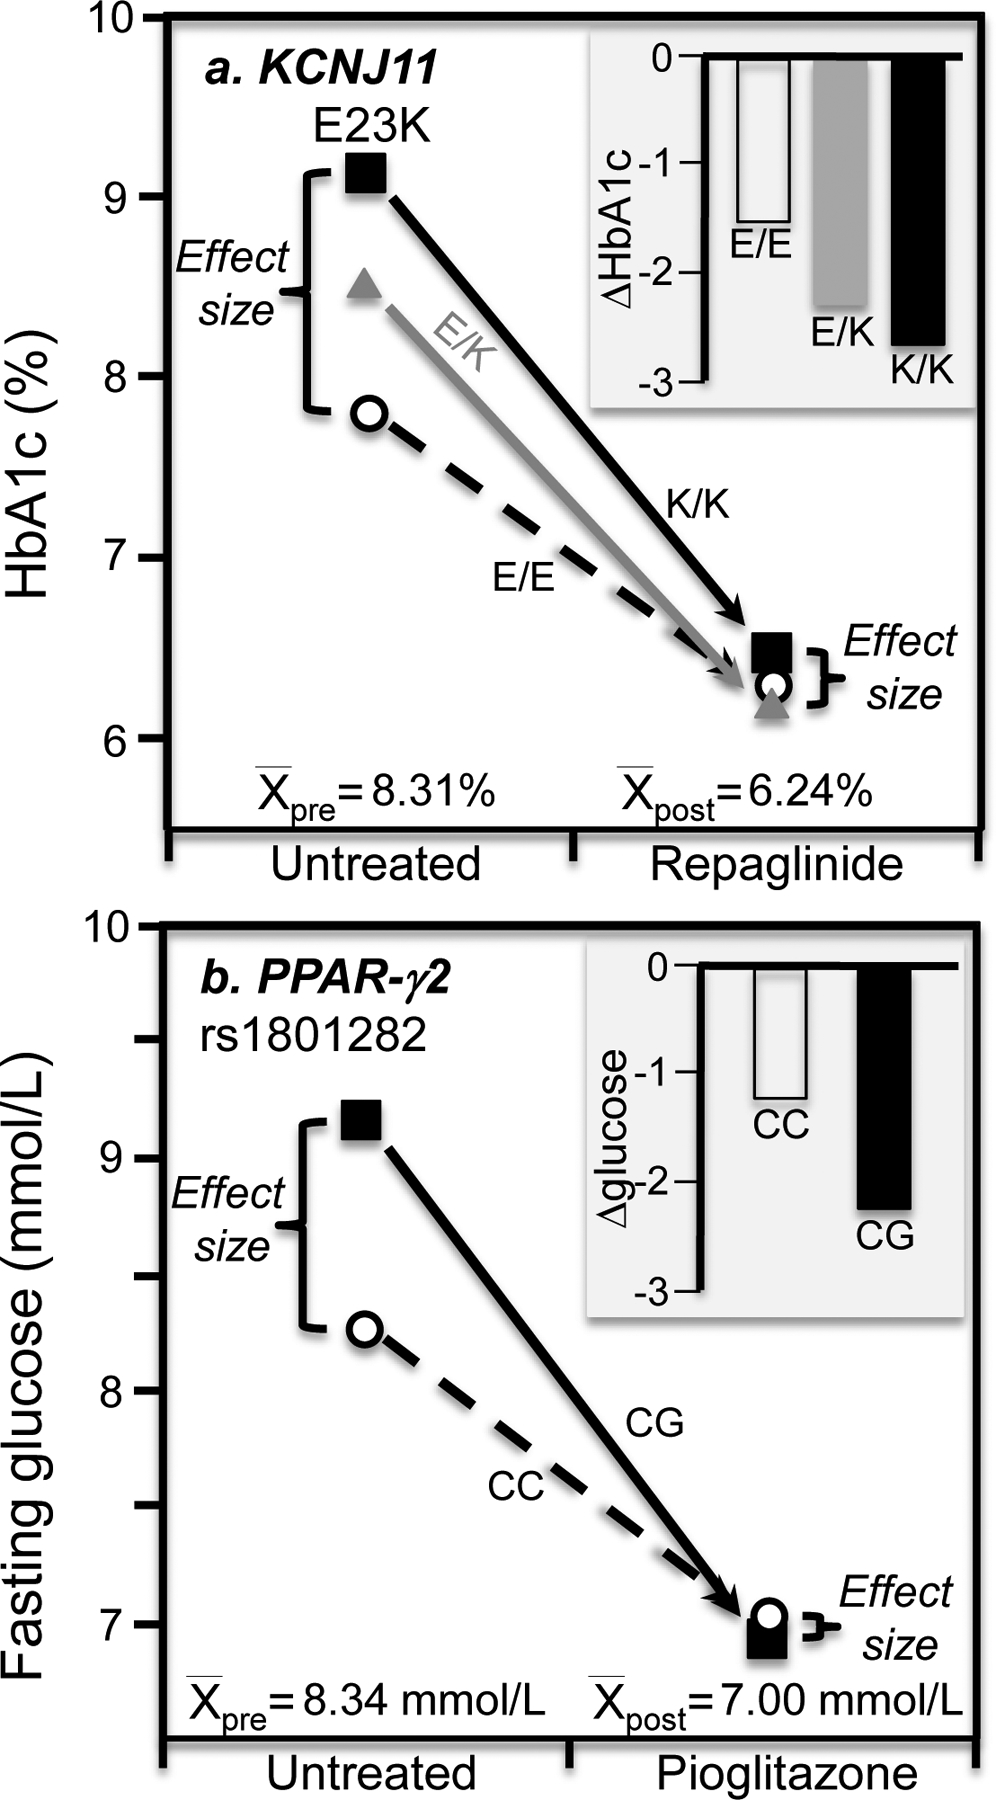
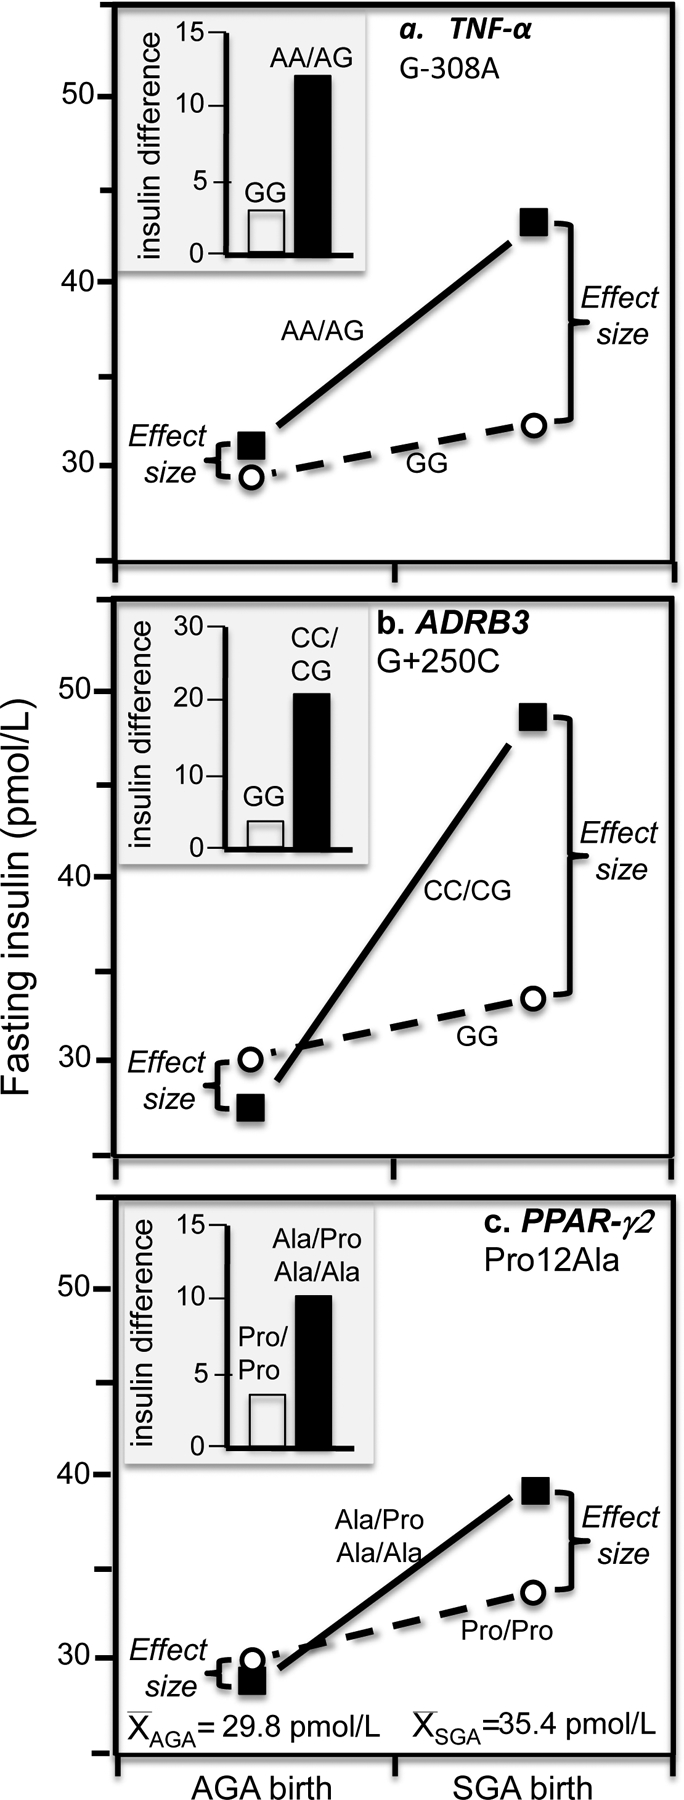
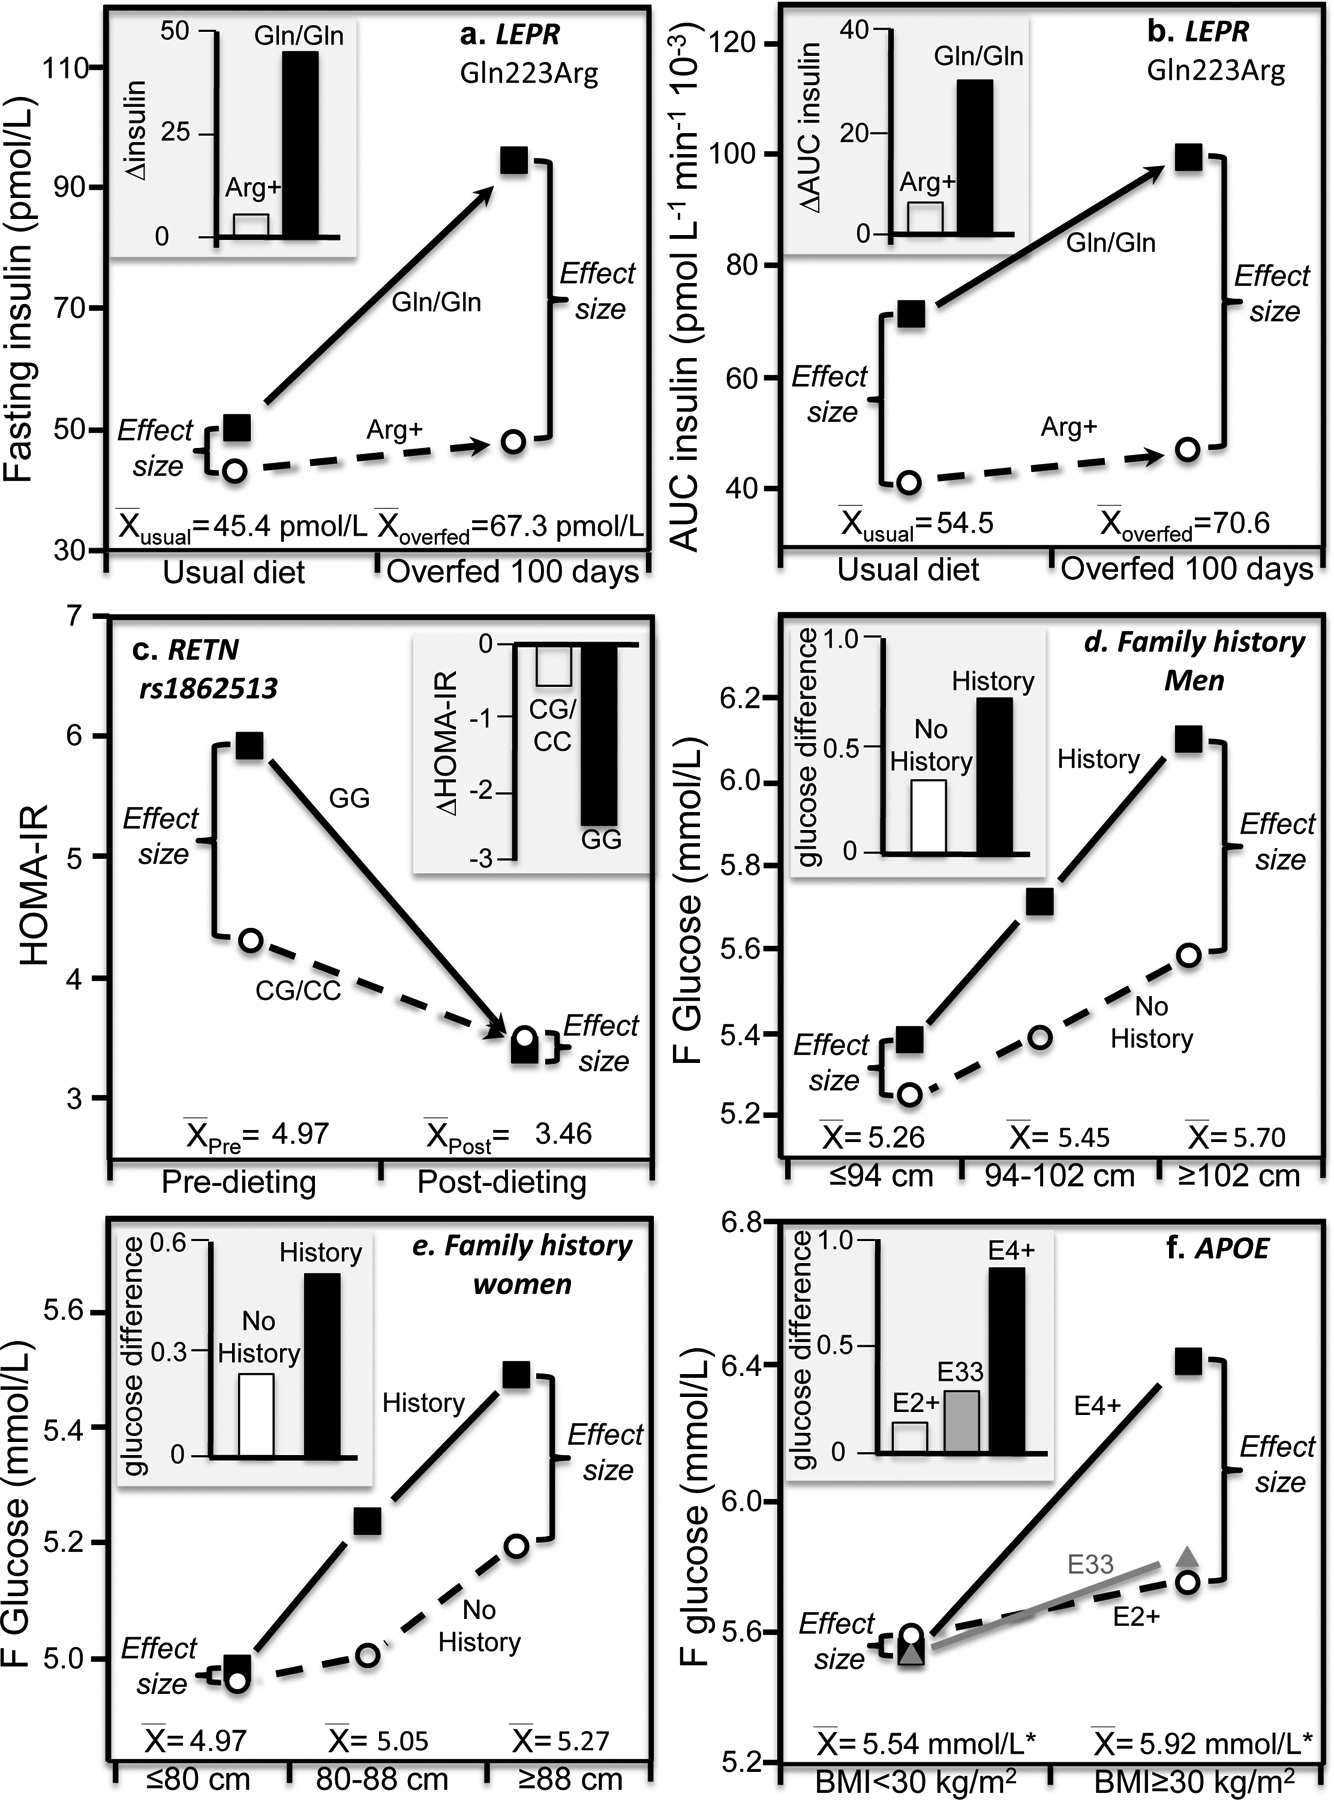
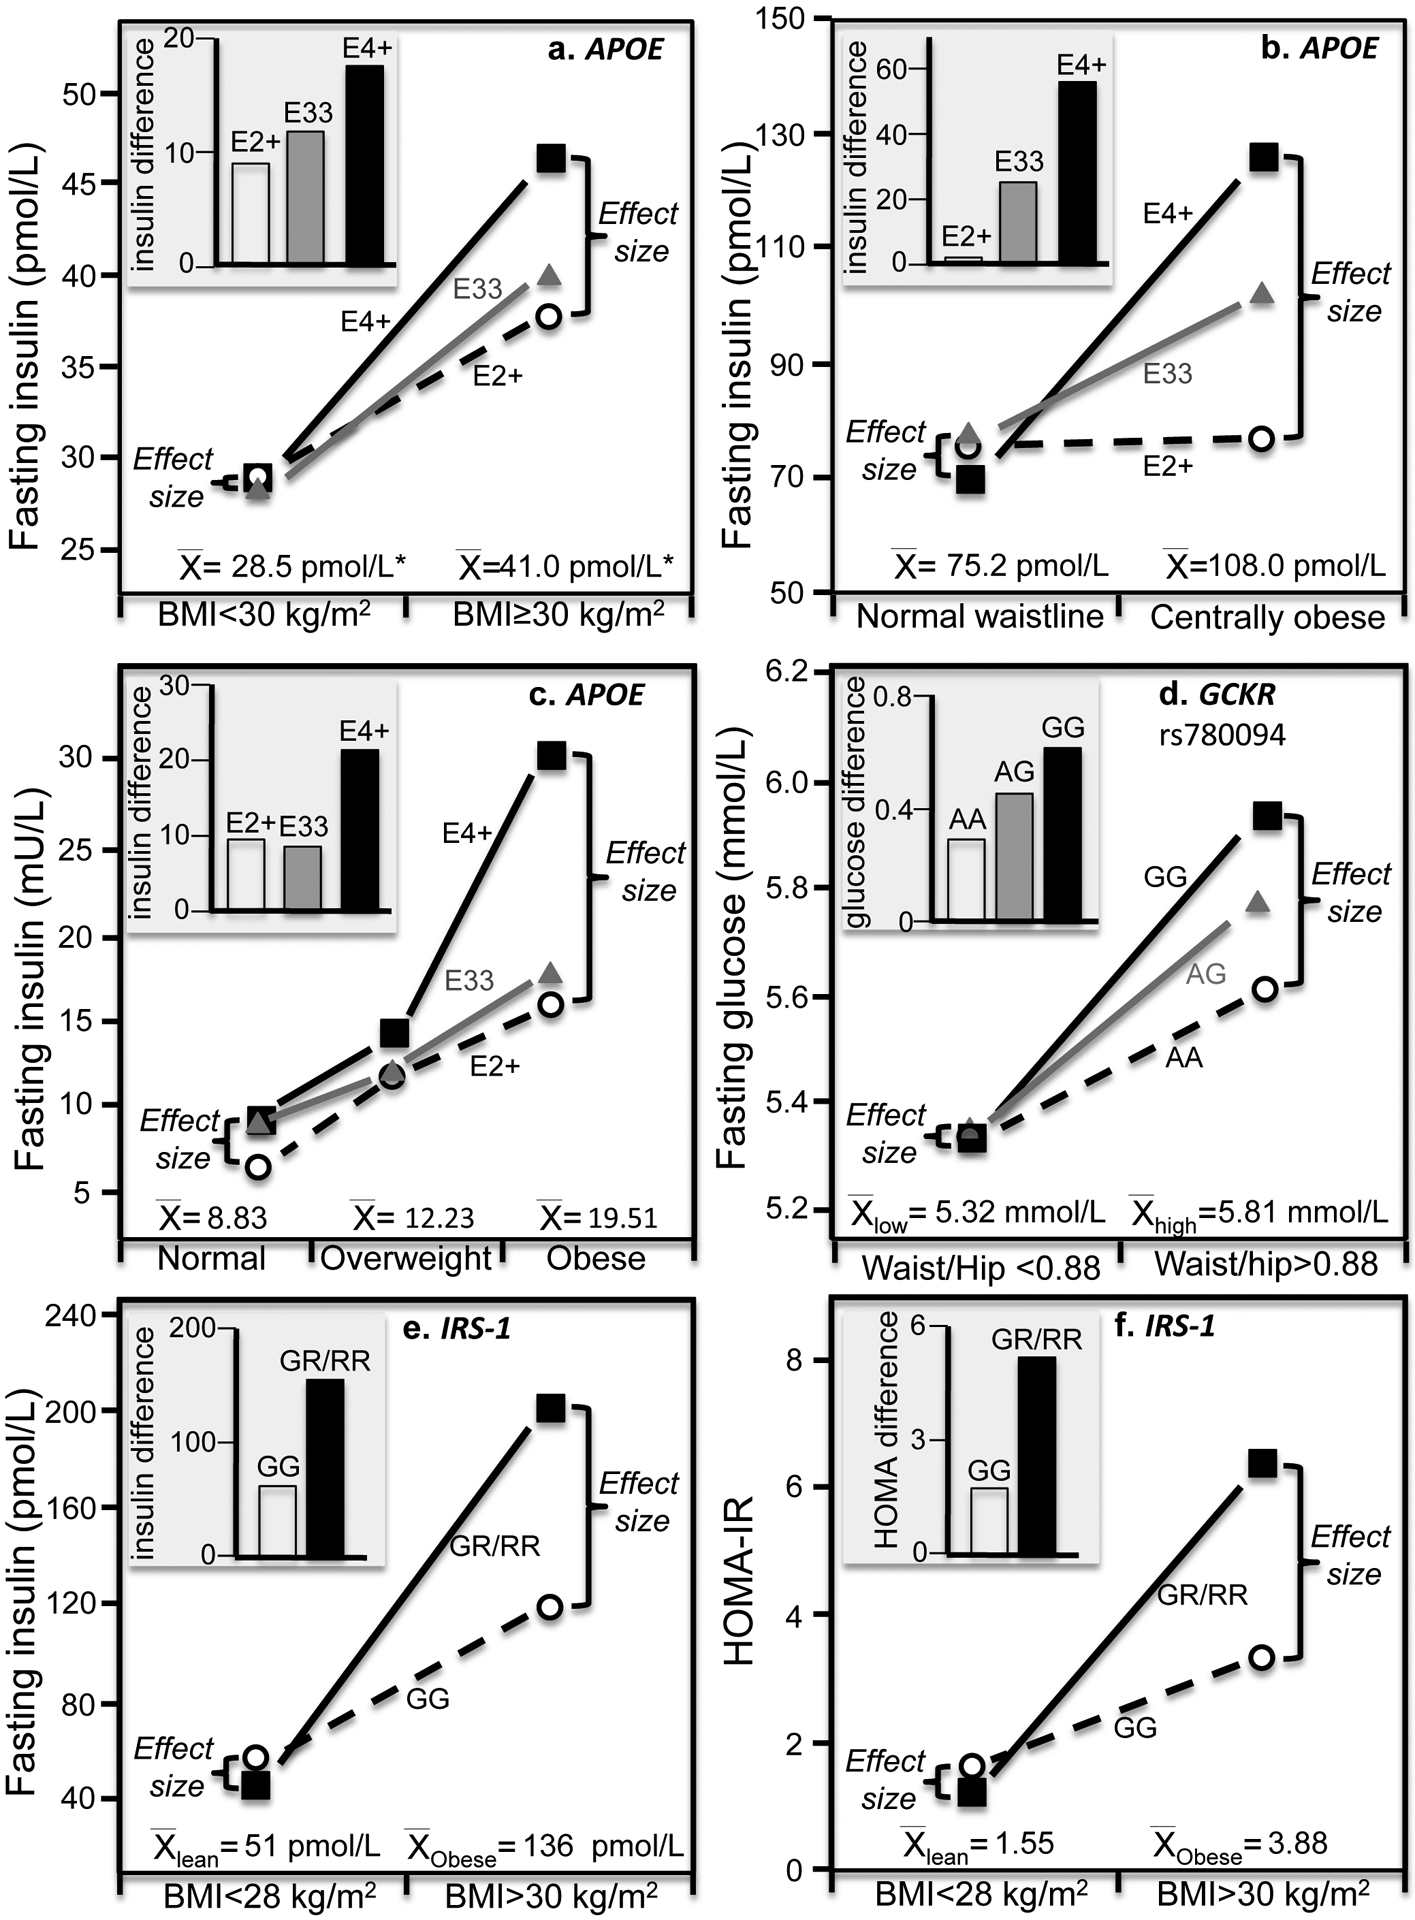
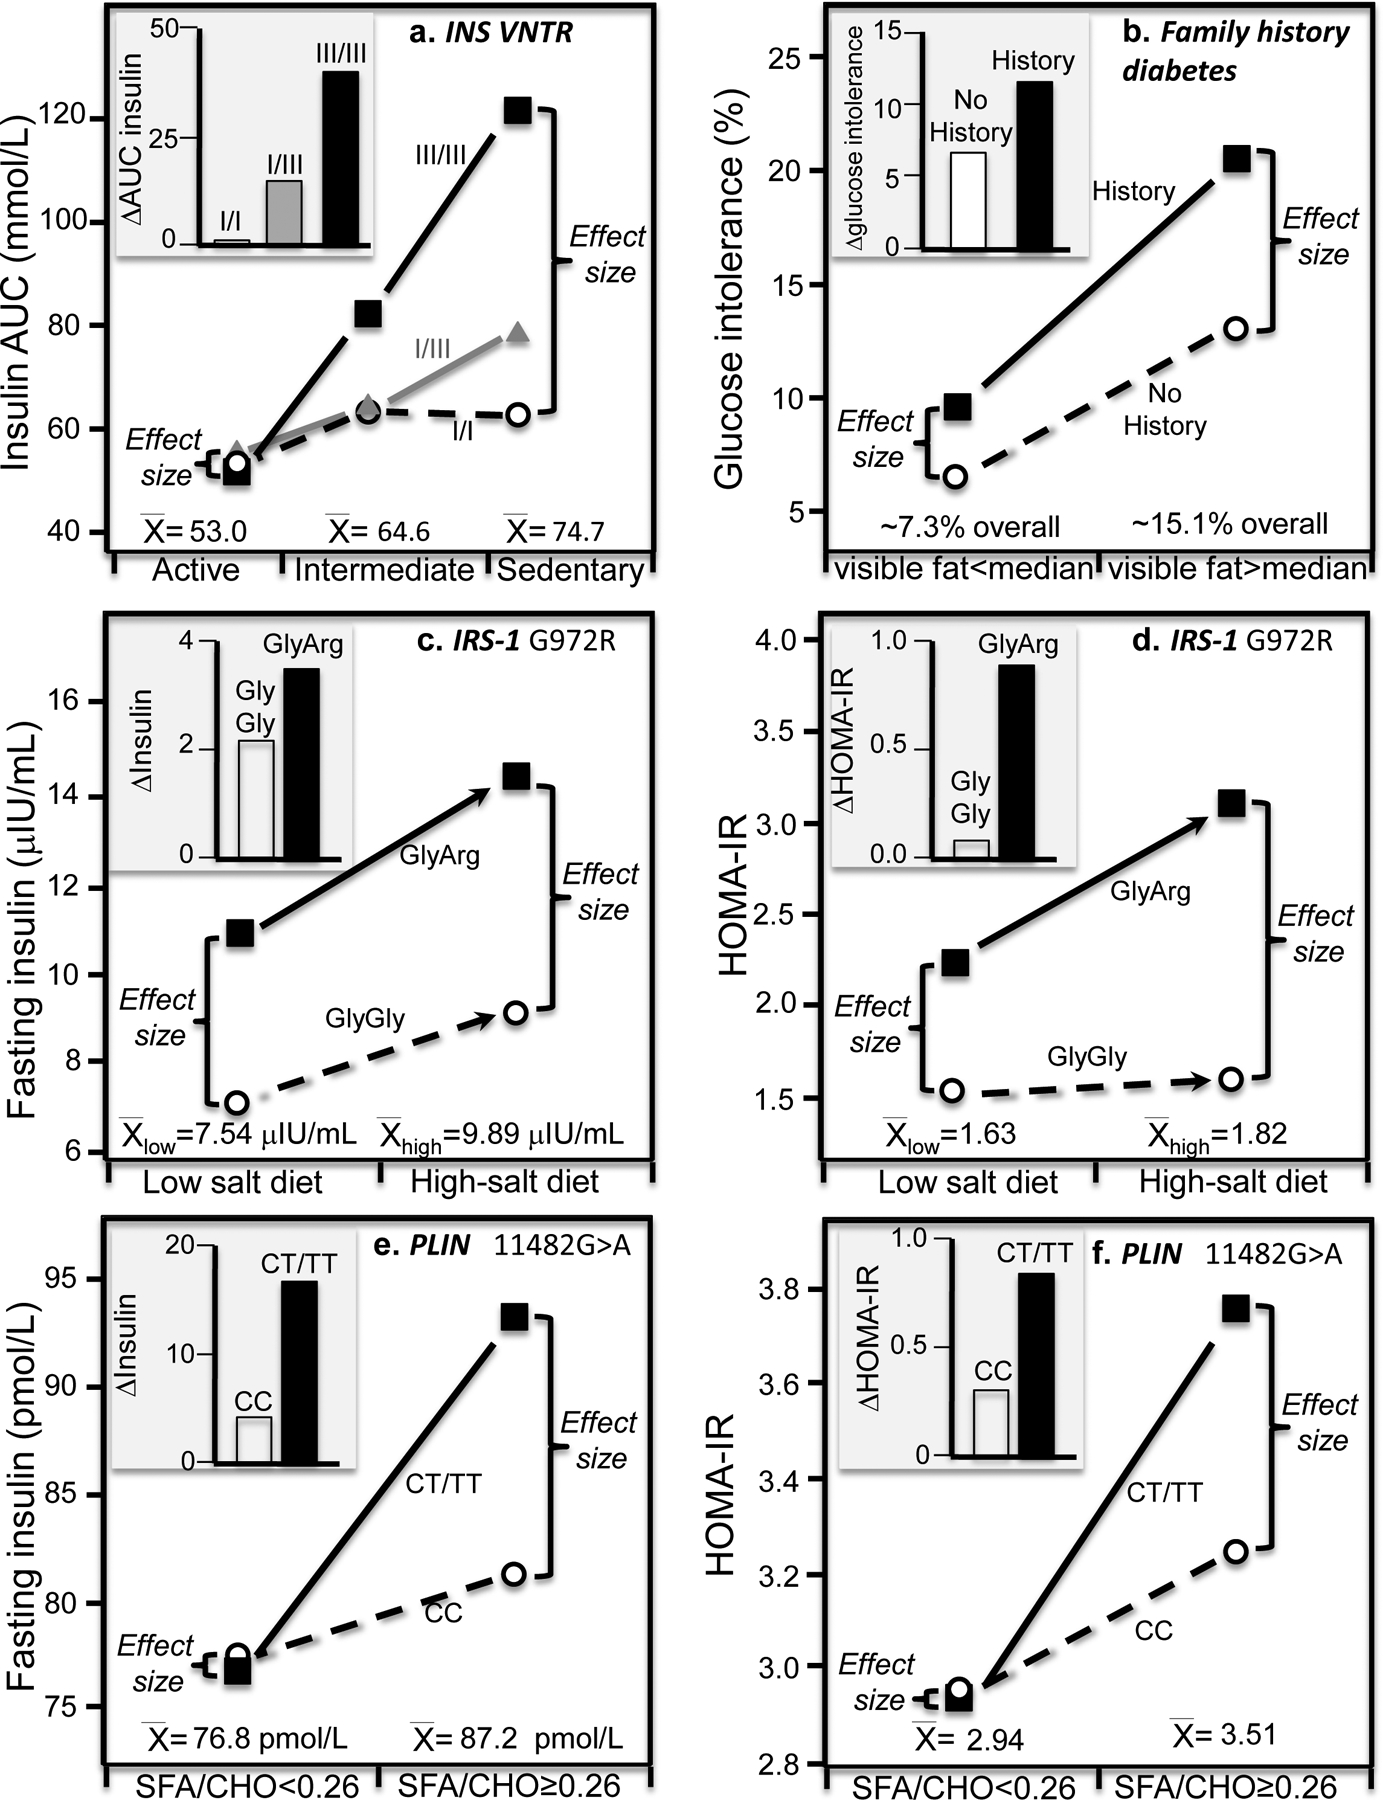
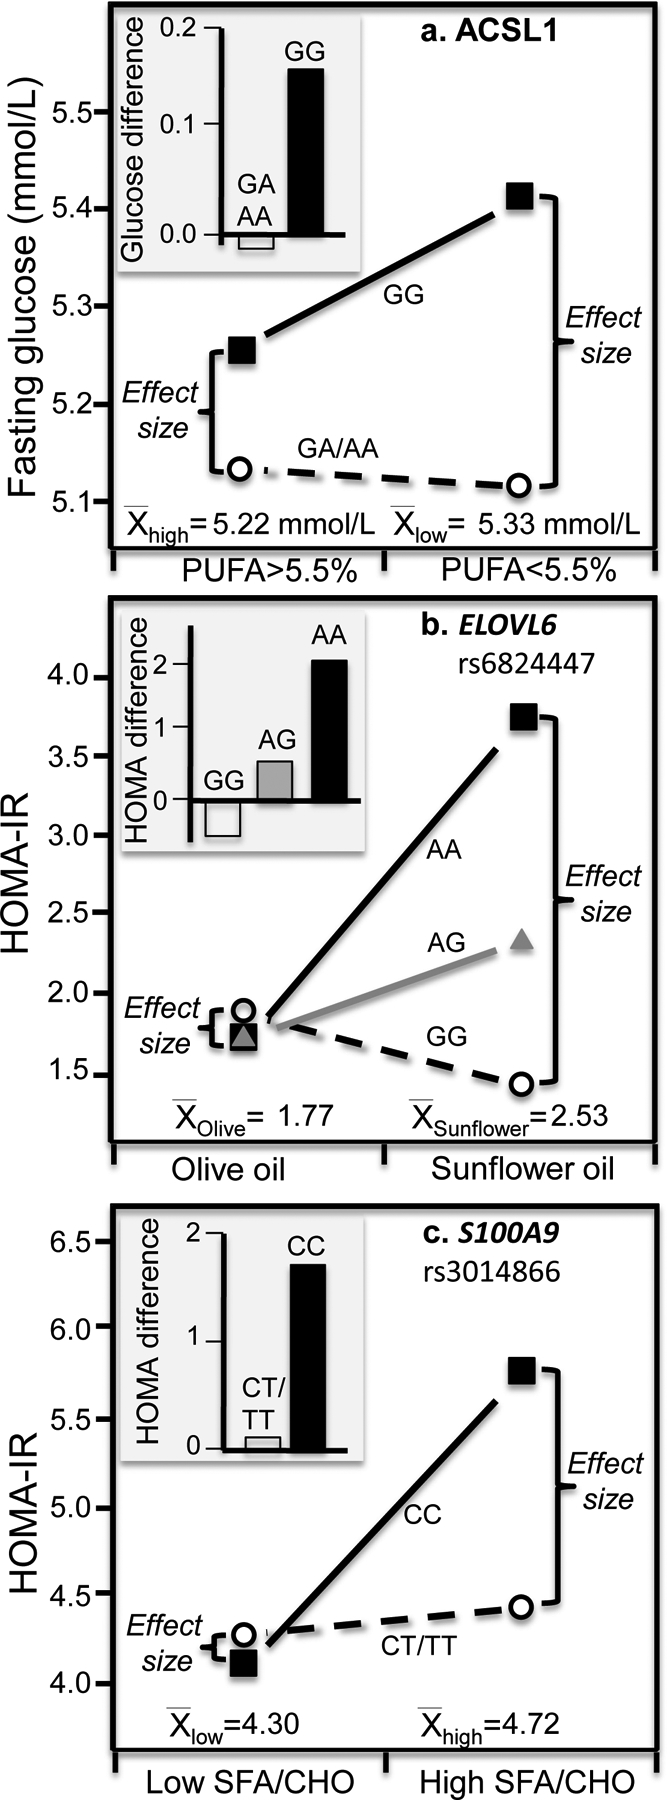
Background: "Quantile-dependent expressivity" is a dependence of genetic effects on whether the phenotype (e.g., insulin resistance) is high or low relative to its distribution.

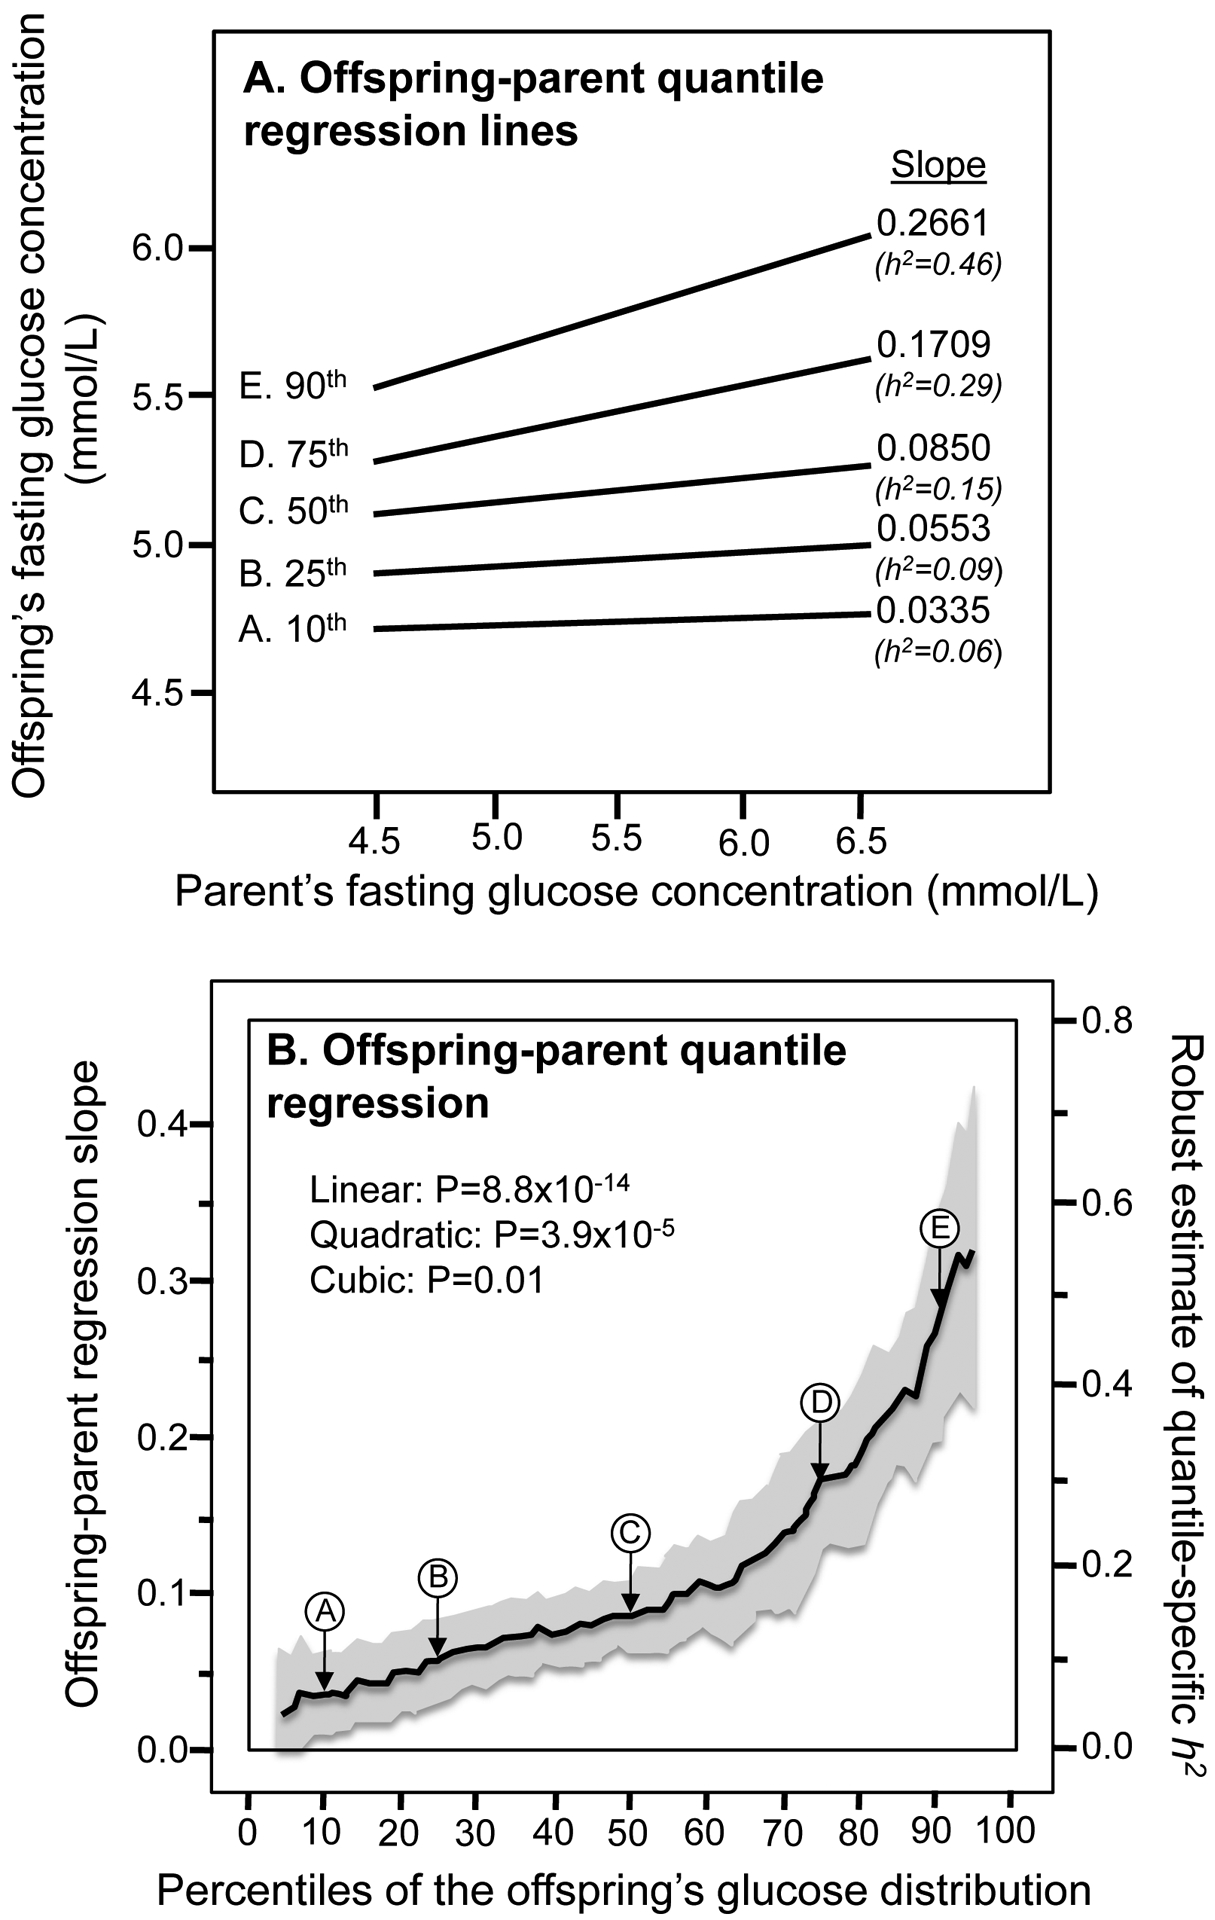
Methods: Quantile-specific offspring-parent regression slopes (βOP) were estimated by quantile regression for fasting glucose concentrations in 6,453 offspring-parent pairs from the Framingham Heart Study.

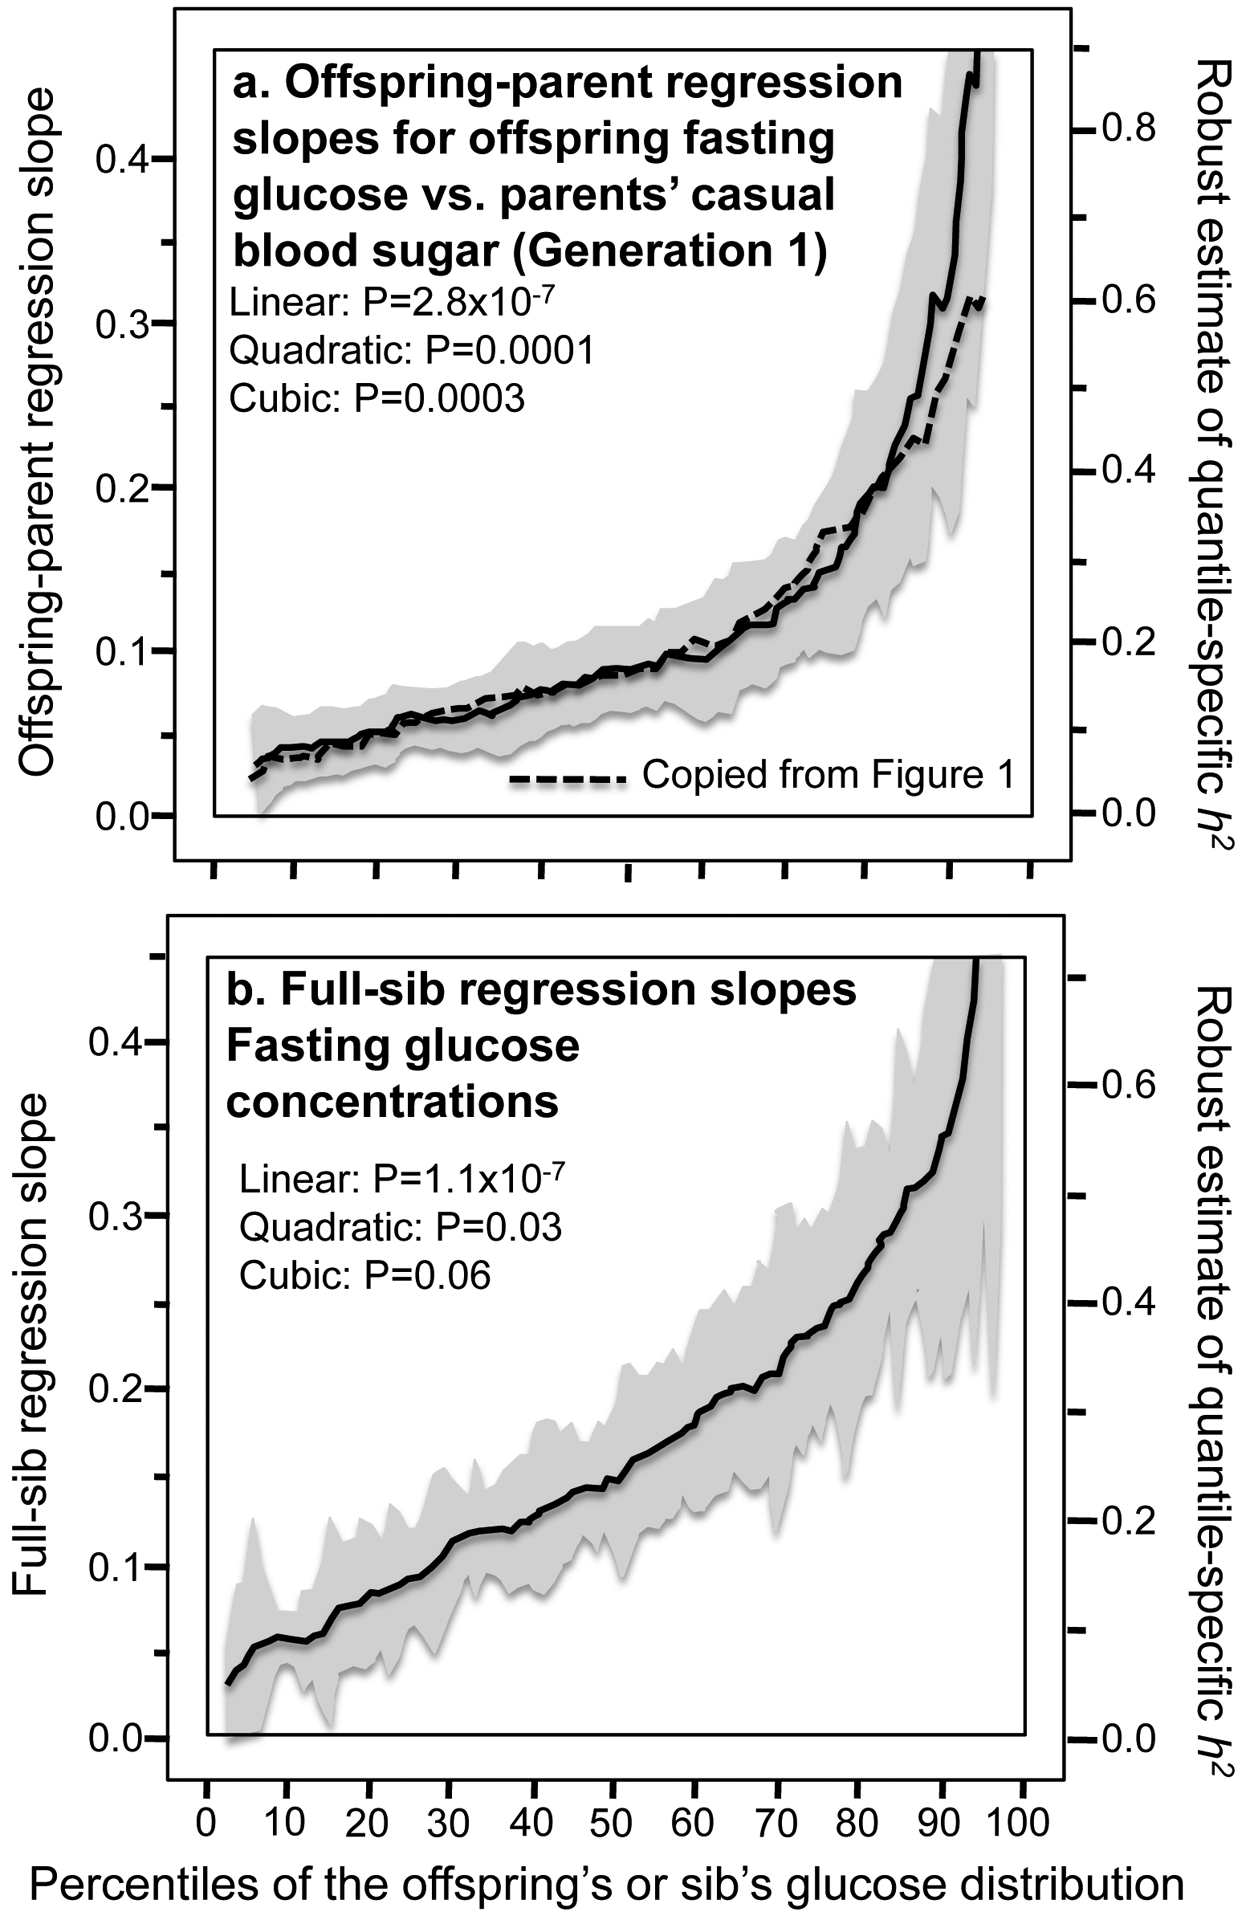
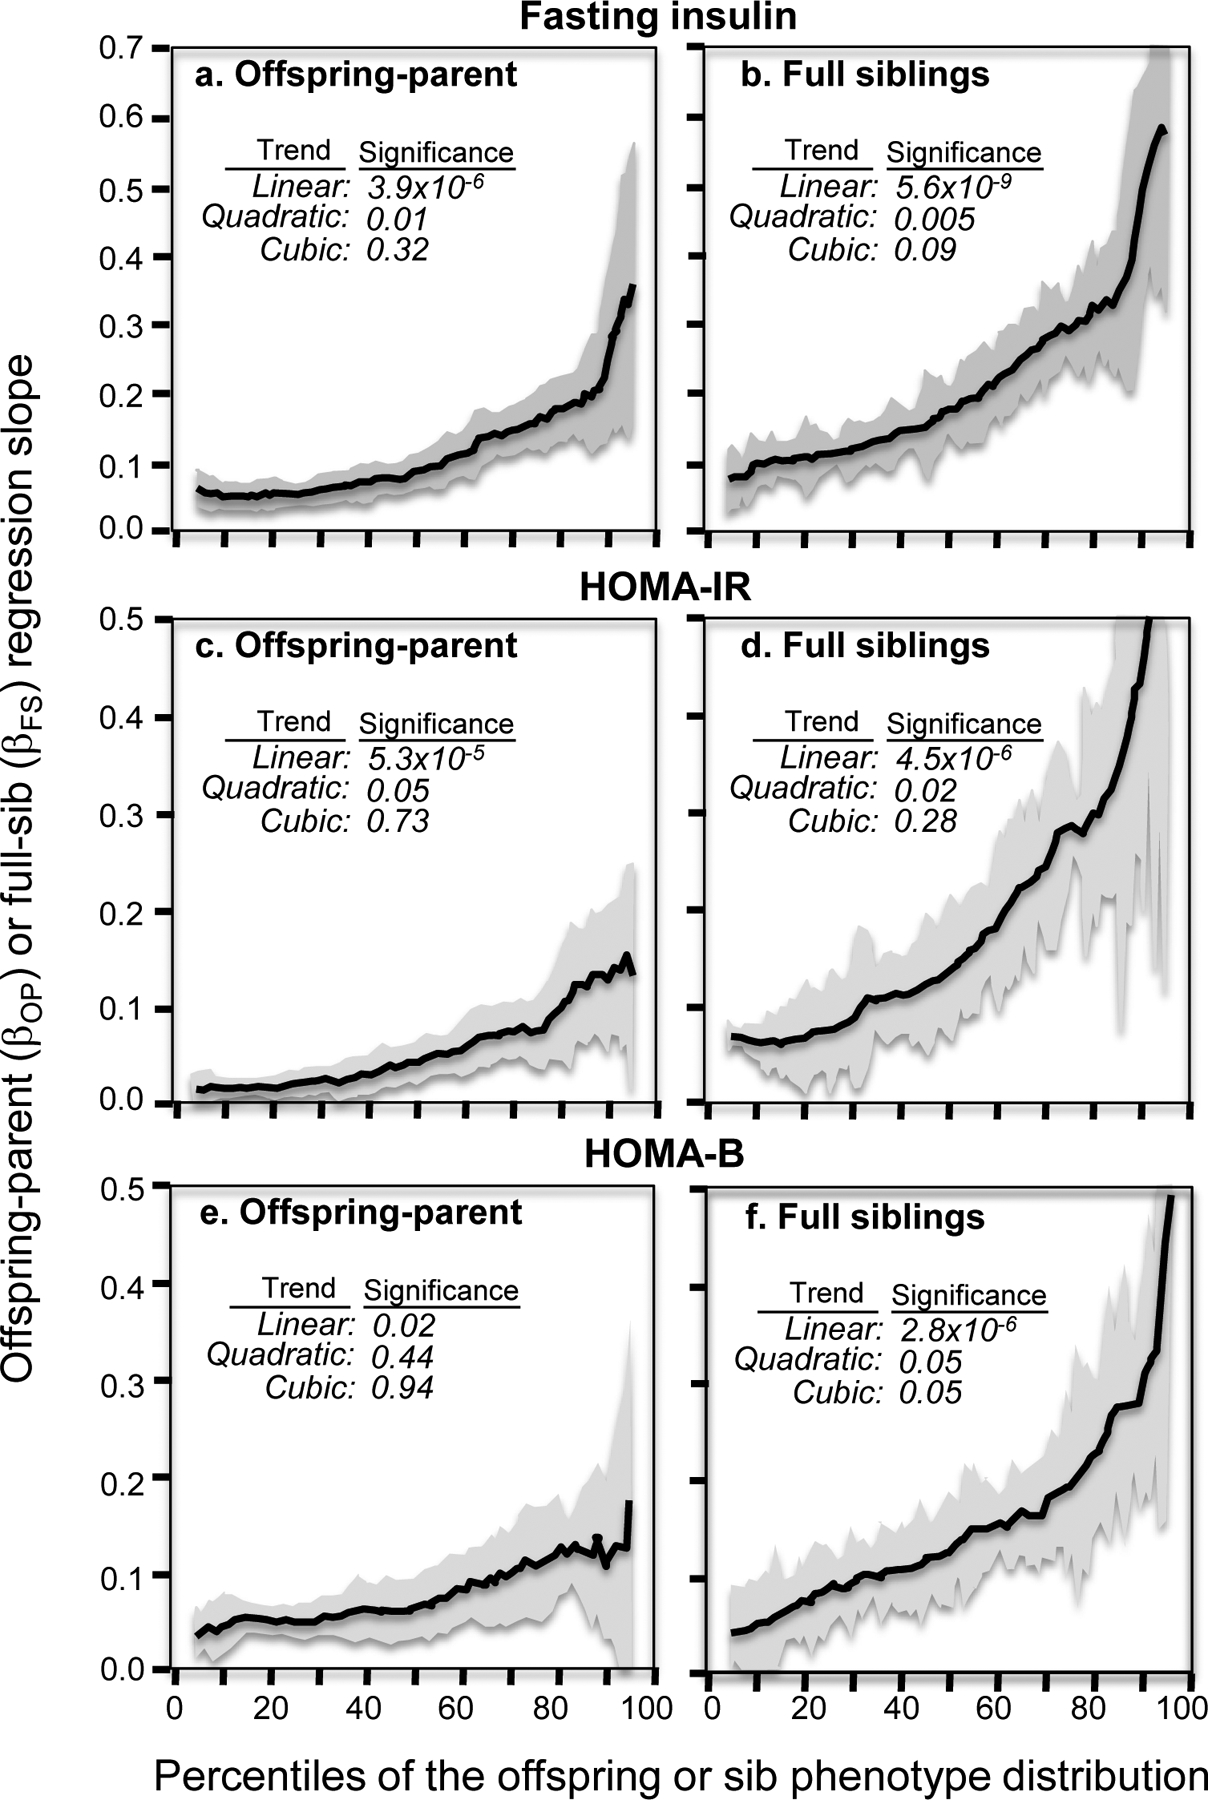
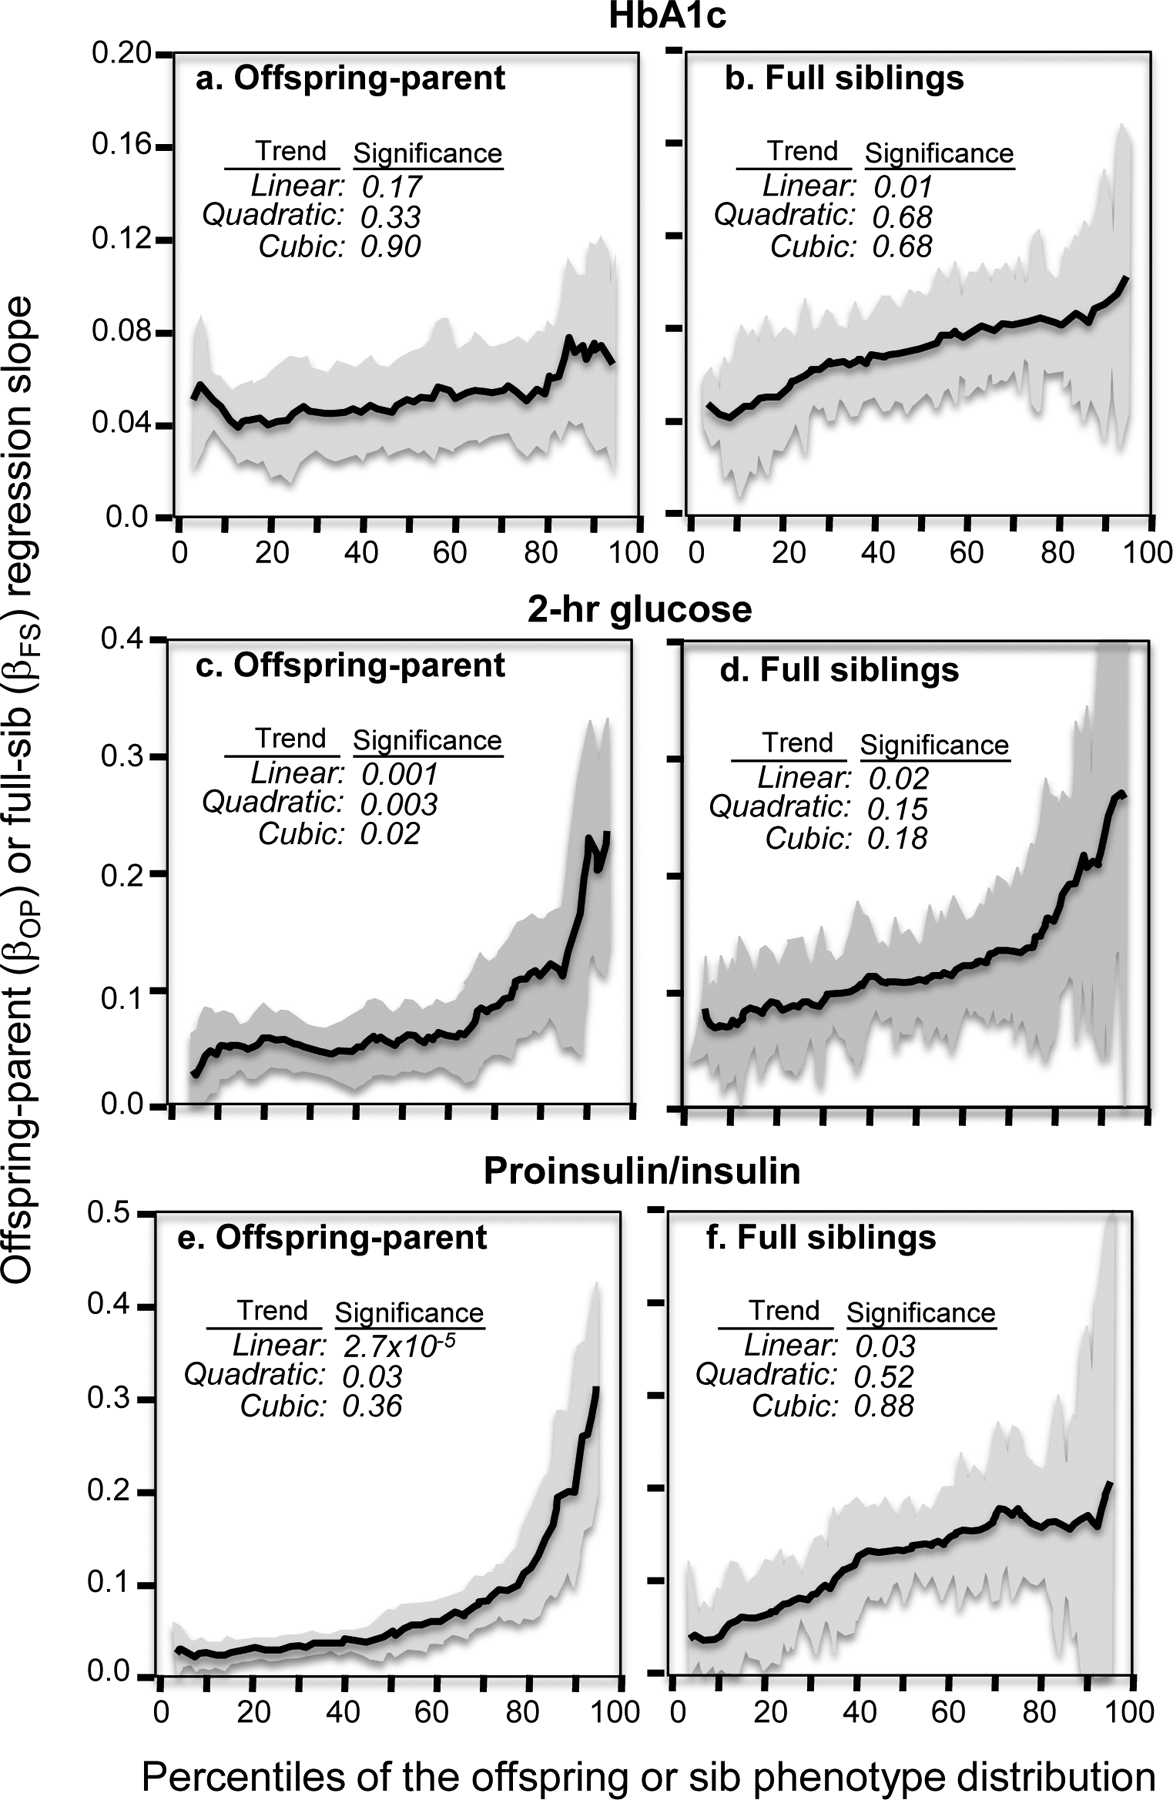
Results: Quantile-specific heritability (h2), estimated by 2βOP/(1 + rspouse), increased 0.0045 ± 0.0007 (p = 8.8 × 10⁻¹⁴) for each 1% increment in the fasting glucose distribution, that is, h2 ± SE were 0.057 ± 0.021, 0.095 ± 0.024, 0.146 ± 0.019, 0.293 ± 0.038, and 0.456 ± 0.061 at the 10th, 25th, 50th, 75th, and 90th percentiles of the fasting glucose distribution, respectively. Significant increases in quantile-specific heritability were also suggested for fasting insulin (p = 1.2 × 10⁻⁶), homeostatic model assessment of insulin resistance (HOMA-IR, p = 5.3 × 10⁻⁵), insulin/glucose ratio (p = 3.9 × 10⁻⁵), proinsulin (p = 1.4 × 10⁻⁶), proinsulin/insulin ratio (p = 2.7 × 10⁻⁵), and glucose concentrations during a glucose tolerance test (p = 0.001), and their logarithmically transformed values.

Discussion/conclusion: These findings suggest alternative interpretations to precision medicine and gene-environment interactions, including alternative interpretation of reported synergisms between ACE, ADRB3, PPAR-γ2, and TNF-α polymorphisms and being born small for gestational age on adult insulin resistance (fetal origin theory), and gene-adiposity (APOE, ENPP1, GCKR, IGF2BP2, IL-6, IRS-1, KIAA0280, LEPR, MFHAS1, RETN, TCF7L2), gene-exercise (INS), gene-diet (ACSL1, ELOVL6, IRS-1, PLIN, S100A9), and gene-socioeconomic interactions.

Keywords: Adiposity; Gene environment interaction; Glycemia; Heritability; Insulin.


Conflict of interest statement

Conflict of Interest Statement: There are no conflicts of interest to report.

Figures

Figure 1.
Figure 1.
a) Offspring-parent regression slopes (βOP) for selected quantiles of the offspring’s fasting glucose concentrations, with corresponding estimates of heritability (h2=2βOP/(1+rspouse)). The slopes became progressively greater (i.e., steeper) with increasing quantiles of the glucose distribution. b) The 10th, 25th, 50th, 75th, and 90th quantile-specific regression slopes were included with those of other quantiles to create the quantile-specific heritability function. Significance of the linear, quadratic and cubic trends and the 95% confidence intervals (shaded region) determined from 1000 bootstrap samples.
Figure 2.
Figure 2.
a) Offspring-parent regression slopes (βOP) of fasting glucose concentrations from the Offspring Cohort vs. casual glucose concentrations from the Original Framingham cohort (solid line). When compared to the dashed line copied from Figure 1b, it shows nearly identical results for the two generations, and little difference between using fasting or casual glucose measurements for the parent’s values. b) Full-sib regression slopes (βFS) vs. quantiles of the sib’s glucose distribution. Significance of the linear, quadratic and cubic trends and the 95% confidence intervals (shaded region) determined from 1000 bootstrap samples.
Figure 3.
Figure 3.
Offspring-parent (βOP) and full-sib (βFS) regression slopes vs. quantiles of the offspring’s distribution for fasting insulin concentrations, HOMA-IR, and HOMA-B. Significance of the linear, quadratic and cubic trends and the 95% confidence intervals (shaded region) determined from 1000 bootstrap samples.
Figure 4.
Figure 4.
Offspring-parent (βOP) and full-sib (βFS) regression slopes vs. quantiles of the offspring’s distribution for percent HbA1c, oral glucose tolerance test (OGTT) 2-hr glucose concentrations, and proinsulin/insulin ratio. Significance of the linear, quadratic and cubic trends and the 95% confidence intervals (shaded region) determined from 1000 bootstrap samples.
Figure 5.
Figure 5.
Histograms present the precision medicine interpretation of Kuzman et al.’s 2012 [39] report showing the mean glucose increase by genotype following three-month antipsychotic treatment. Line graphs present a quantile-dependent expressivity interpretation where a larger post-treatment genetic effect size occurs when the average glucose concentration was high vs. a smaller pre-treatment genetic effect size when the average glucose concentration was low, requiring nonparallel glucose increases by genotype for: a) 5-HT2C (serotonin 2C receptor) - 759CT polymorphism in olanzapine-treated patients (Pinteraction=0.02); b) MDR1 G2677T polymorphism in olanzapine- and risperidone-treated patients (Pinteraction=0.001); c) MDR1 3435CT polymorphism in olanzapine-treated patients (Pinteraction=0.03).
Figure 6.
Figure 6.
a) Histogram representing the precision medicine interpretation of He et al’s [40] 2008 report showing significantly greater HbA1c reductions in 54 E/K, and 11 K/K patients vs. 35 E/E patients for the KCNJ11 E23K variant after 24-week repaglinide treatment (Pinteraction=0.02). Line graphs present an quantile-dependent expressivity interpretation where a smaller post-treatment genetic effect size occurs when the average HbA1c was low vs. a larger pre-treatment genetic effect size when the average glucose concentration was high, requiring nonparallel glucose decreases by genotype. b) Histogram representing the precision medicine interpretation of Pei et al.’s [41] 2013 report showing significantly greater fasting glucose reductions in seven CG heterozygotes than sixty CC homozygotes of the PPAR-γ2 rs1801282 polymorphism after 3-month pioglitazone treatment (Pinteraction=0.02). Line graphs present their interpretations from a quantile-dependent expressivity perspective.
Figure 7.
Figure 7.
Jaquet et al.’s [48] 2002 report on fasting insulin concentrations in young adults born small (SGA) and born appropriate for their gestational age (AGA) by: a) A-allele carriers (NSGA=46, NAGA=61) and GG homozygotes (NSGA=125, NAGA=172) of the tumor necrosis factor-α (TNFα) G-308A polymorphism (Pinteraction=0.03); b) C-carriers (NSGA=19, NAGA=26) and GG homozygotes (NSGA= 152, NAGA=207) of the β3 adrenoreceptor (ADRB3) G+250C polymorphism (Pinteraction=0.01); and c) Ala-carriers (NSGA=38, NAGA= 54) vs. Pro/Pro homozygotes (NSGA= 133, NAGA=179) of the peroxisome proliferator–activated receptor-γ2 (PPAR-γ2) Pro12Ala polymorphism (Pinteraction=0.03). The histograms present the precision-medicine interpretation of genotypes affecting the fasting insulin difference between SGA and AGA births, the line graphs present the quantile-dependent expressivity interpretation of a larger genetic effect size at the higher average fasting insulin concentrations.
Figure 8.
Figure 8.
Histograms representing the traditional interpretation of genotypes modifying the effect of adiposity vs. line graphs representing the quantile-dependent expressivity interpretation of a larger genetic effect size at the higher average phenotype value for: a) Ukkola et al.’s [55] 2000 report on the significantly greater increase in fasting insulin from 100-day overfeeding in 10 GlnGln homozygotes and 14 carriers of the Arg-allele for the leptin receptor Gln223Arg polymorphism; b) the corresponding results for OGTT AUC insulin concentrations (estimated by integration of their figure 2 [55]); c) de Luis et al.’s 2016 report [56] of significantly different (P<0.05) HOMA-IR reductions in 56 GG homozygotes vs. 77 carriers of the C-allele of the resistin (RETN) rs1862513 polymorphism following a 3-month low-fat hypocaloric diet; d) van Dam et al.’s 2001 report of parental history of diabetes modifying the effect of abdominal obesity on fasting glucose concentrations in men (Pinteraction=0.003) [57]; e) corresponding analysis in women (Pinteraction=0.002) [57] ; f) Elosua et al’s. 2003 report [59] on the significant interaction (P=0.008) between APOE genotypes (12.9% E2+, 66.9% E33, 20.3% E4+) and male obesity status on fasting glucose concentrations.
Figure 9.
Figure 9.
Histograms representing the traditional interpretation of genotypes modifying the effect of adiposity vs. line graphs representing the quantile-dependent expressivity interpretation of a larger genetic effect size at the higher average phenotype value for: a) Elosua et al’s. 2003 report [59] on the significant interaction (P=0.003) between APOE genotypes (12.9% E2+, 66.9% E33, 20.3% E4+) and male obesity status on fasting insulin concentrations; b) Uusitupa et al. 1996 report [60] on fasting plasma insulin concentrations in 6 normal and 5 centrally obese female carriers of the APOE E2-allele, 50 normal and 42 centrally obese women having the E33 isoform, and 15 normal and 23 centrally obese female carriers of the E4-allele (estimated from their figure 1); c) Marques-Vidal et al. 2003 report of fasting insulin concentrations in 30 APOE E2-carriers, 185 E33, and 54-carriers in 107 normal weight, 128 overweight, and 31 obese men (histogram displays the genotype-specific differences between normal weight and overweight men) [61]; d) Jung et al.’s [64] report of a significant interaction between the GCKR rs780094 polymorphism and waist circumference on fasting glucose concentrations (Pinteraction=0.02); e) Baroni et al.’s [66] 2001 report of a significant interaction (P<0.0001) between obesity and the G972R mutation of the insulin receptor substrate-1 (IRS-1) for fasting insulin concentrations; f) the corresponding analyses for HOMA-IR [66].
Figure 10.
Figure 10.
Histograms representing the traditional interpretation of genotypes modifying the effect of physical activity or diet vs. line graphs representing the quantile-dependent expressivity interpretation of a larger genetic effect size at higher average phenotype values for: a) Waterworth et al.’s 2005 report that a surrogate marker for the insulin gene (INS) variable number tandem repeat (VNTR) modified the effect of physical activity on OGTT AUC insulin concentrations (Pinteraction=0.03) [71]; b) Mohan et al.’s 2007 [75] report that family history of diabetes modified the effect of visible dietary fat on glucose intolerance; c) Dziwura et al’s 2011 report that the insulin receptor substrate-1 gene (IRS-1) G972R polymorphism (rs1801278) modified the effects of low and high salt diets on fasting insulin concentrations [76]; d) the corresponding results for HOMA-IR [76]; e) Smith et al.’s 2012 [77] reported that the perilipin (PLIN) 11482G>A polymorphism modified the effect of the dietary saturated fatty acid/carbohydrate ratio on fasting insulin concentrations; and f) the corresponding results for HOMA-IR [77].
Figure 11.
Figure 11.
Histograms representing the traditional interpretation of genotypes modifying the effect of diet vs. line graphs representing the quantile-dependent expressivity interpretation of a larger genetic effect size at higher average phenotype values for: a) Phillips et al.’s 2010 [78] report that the long-chain acyl CoA synthetase gene (ACSL1) rs9997745 polymorphism modified the effect of polyunsaturated fat intake on fasting glucose concentrations; b) Morcillo et al. 2011 [79] report that the elongase of long chain fatty acids family 6 (ELOVL6) polymorphism (rs6824447) modified the effects of olive vs. sunflower oil on log HOMA-IR; c) Blanco-Rojo et al’s 2016 [81] report that the S100 calcium-binding protein A9 (S100A9) gene polymorphism modified the effect of the dietary saturated fat/total carbohydrate ratio (SFA/CHO) on HOMA-IR (Pinteraction<0.03).

Similar articles

Cited by

References

    1. Wareham NJ, Franks PW, Harding AH. Establishing the role of gene-environment interactions in the etiology of type 2 diabetes. Endocrinol Metab Clin North Am 2002;31:553–566. doi: 10.1016/s0889-8529(02)00007-5. - DOI - PubMed
    1. Martin BC, Warram JH, Krolewski AS, Bergman RN, Soeldner JS, Kahn CR. Role of glucose and insulin resistance in development of type 2 diabetes mellitus: results of a 25-year follow-up study. Lancet 1992;340:925–929. doi: 10.1016/0140-6736(92)92814-v. - DOI - PubMed
    1. Falconer DS, Mackay TFC. Introduction to Quantative Genetics. 4th edition. 2004. Pearson Education Limited. London: ISBN 978-81-317-2740-9
    1. Williams PT. Quantile-specific penetrance of genes affecting lipoproteins, adiposity and height. PLoS One 2012;7:e28764. doi: 10.1371/journal.pone.0028764. - DOI - PMC - PubMed
    1. Koenker R, Hallock KF. Quantile regression. J Economic Perspectives. 2001;15:143–56. doi.org/10.1257/jep.15.4.143. - DOI

Publication types