. 2022 Apr 12;6(7):2081-2091.
doi: 10.1182/bloodadvances.2021005097.

Neutrophil transit time and localization within the megakaryocyte define morphologically distinct forms of emperipolesis

Affiliations

Neutrophil transit time and localization within the megakaryocyte define morphologically distinct forms of emperipolesis

Frank Y Huang et al. Blood Adv. .

Abstract

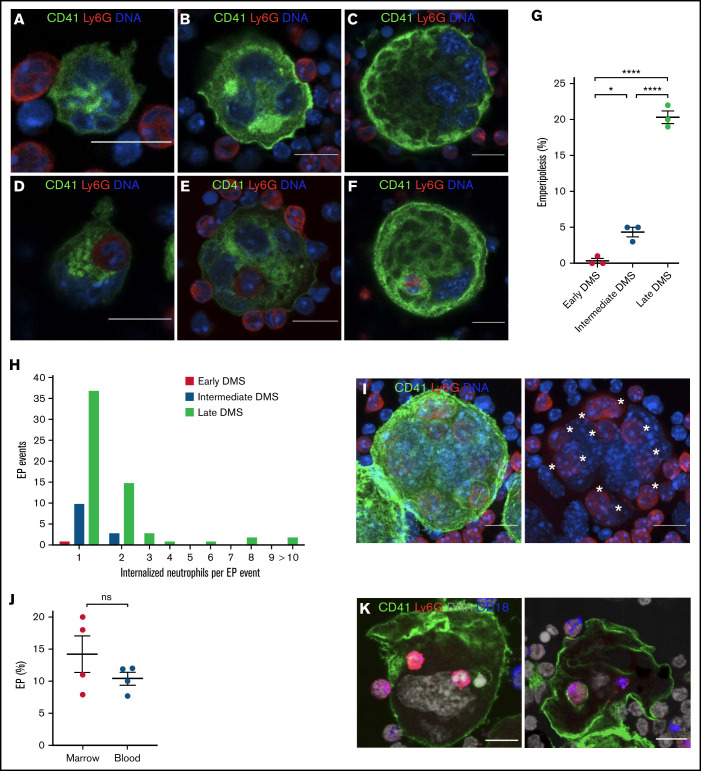
Neutrophils transit through megakaryocytes in a process termed emperipolesis, but it is unknown whether this interaction is a single type of cell-in-cell interaction or a set of distinct processes. Using a murine in vitro model, we characterized emperipolesis by live-cell spinning disk microscopy and electron microscopy. Approximately half of neutrophils exited the megakaryocyte rapidly, typically in 10 minutes or less, displaying ameboid morphology as they passed through the host cell (fast emperipolesis). The remaining neutrophils assumed a sessile morphology, most remaining within the megakaryocyte for at least 60 minutes (slow emperipolesis). These neutrophils typically localized near the megakaryocyte nucleus. By ultrastructural assessment, all internalized neutrophils remained morphologically intact. Most neutrophils resided within emperisomes, but some could be visualized exiting the emperisome to enter the cell cytoplasm. Neutrophils in the cytoplasm assumed close contact with the platelet-forming demarcation membrane system or the perinuclear endoplasmic reticulum. These findings reveal that megakaryocyte emperipolesis reflects at least 2 distinct processes differing in transit time and morphology, fast and slow emperipolesis, suggesting divergent physiologic functions.


Figures

None
Graphical abstract
Figure 1.
Figure 1.
Visualization of EP in MKs of different maturational stages. Hematopoietic progenitor cells were cultured in TPO medium for 1, 2, or 4 days to obtain MKs of different maturation levels. MKs were then cocultured with bone marrow cells for 12 hours. MKs were stained with anti-CD41 AF488 (green), neutrophils were stained with anti-Ly6G AF594 (red), and DNA was stained with Hoechst 33342 (blue). MK maturity was graded based on the extent of the DMS (early, intermediate, and late DMS). Images were obtained using a Zeiss LSM 800 with Airyscan attached to a Zeiss Axio Observer Z1 Inverted Microscope with a Plan-Apochromat 63x objective. Scale bars, 10 µm. (A) Immature MK showing DMS beginning to develop between the nuclear lobes and forming connections with the MK surface (early DMS). (B) With increasing maturation, the DMS becomes more prominent and forms thicker connections with the MK surface (intermediate DMS). (C) Mature MK with extensive DMS occupying the majority of the MK cytoplasm (late DMS). (D-F) Early, intermediate, and late DMS MKs engulfing neutrophils during EP. (G) EP frequency across MK maturational stages. 100 MKs per maturational stage per experiment were counted in each of 3 independent experiments. (H) The number of engulfed neutrophils per EP event across MK maturational stages. Pooled data from 3 independent experiments (n = 300 MKs per maturational stage; EP events: early DMS MKs: 1, intermediate DMS MKs: 13, and late DMS MKs: 61). (I) Z-projection of mature MK (late DMS) containing 11 neutrophils (*s). (J) EP assay with neutrophils isolated from blood or bone marrow; 4 independent experiments. (K) EP assay with peritoneal cells harvested 2 hours after IP injection of 25 ng/mL IL1B. Green, CD41; red, Ly6G; blue, CD18; gray, DNA. Scale bars, 10 µm.
Figure 2.
Figure 2.
Neutrophil transit time through MKs is bimodally distributed: fast and slow EP. Mature MKs were stained with anti-CD41 AF488 (green) and coincubated with fresh bone marrow cells stained with anti-Ly6G AF594 (red). DNA was stained with DRAQ5 (blue). (A) Histogram depicting the duration of neutrophil transit through MKs of 28 EP events reveals a bimodal distribution with peaks between 0 and 10 minutes (fast EP) and >60 minutes (slow EP). Results pooled from 5 independent experiments. Bimodality was confirmed by Hartigan’s dip test (D = 0.16, P = 7.89 × 10⁻⁷). (B-C) Images were obtained using a W1 Yokogawa Spinning Disk Confocal attached to a Nikon Ti inverted microscope with a Plan Fluor 40x/1.3 Oil DIC H/N2 objective. Scale bars, 10 µm. (B) Representative image sequence of fast EP. The neutrophil (*) enters the MK on the right side, migrates through the MK cytoplasm, and egresses on the opposite side within 10 minutes. (C) Representative image sequence of slow EP. The neutrophil (*) is already inside the MK at the beginning of the image acquisition and remains inside for at least 60 minutes, showing no migration inside the MK.
Figure 3.
Figure 3.
Distinct morphology of fast and slow EP within a single MK. Mature MKs were stained with anti-CD41 AF488 (green) and coincubated with fresh bone marrow cells stained with anti-Ly6G AF594 (red). DNA was stained with Hoechst 33342 (blue). (A-B) Images were obtained using a Perkin Elmer Ultraview Vox Spinning Disk Confocal attached to a Nikon Ti inverted microscope with a 60x (1.4NA) objective. Scale bars, 10 µm. (A) An MK showing fast and slow EP simultaneously to illustrate morphological differences of both forms. Two neutrophils undergoing slow EP (*) assume a sessile state. A third neutrophil (arrowhead) enters the MK after 31 minutes and extends dynamic membrane protrusions to propel itself through the MK cytoplasm, exiting within few minutes. (B) Representative image of a slow EP neutrophil residing near the MK nucleus. (C) The passage of neutrophils undergoing fast EP (<10 minutes) and slow EP (>60 minutes) through MKs was tracked using the ImageJ plugin TrackMate to determine the mean speed of migration.
Figure 4.
Figure 4.
Characterization of the ultrastructural features of EP by electron microscopy. Mature MKs incubated with bone marrow cells for 12 hours were fixed and processed for transmission EM. Forty-five EP events were observed from 5 experiments. (Ai-Cii) Transmission EM images of EP. Scale bars, 2 µm or (for magnification of Aiii) 500 nm. (Ai) Large, round emperisome with a smooth vacuolar membrane surrounding a neutrophil (polymorphonuclear leukocyte, PMN). (Aii) The emperisome extends membrane protrusions toward the engulfed neutrophil. (Aiii) The emperisome tightly wraps around the engulfed neutrophil. Magnification shows close membrane approximation between neutrophil and emperisome membranes (arrowheads). (Bi) Internalized neutrophil partly covered by the emperisome and partly exposed to the DMS of the MK. (Bii) Neutrophil residing within the cavities of the DMS. (Ci) Internalized neutrophil partly covered by the emperisome (Cia) and partly exposed to organelles of the MK cytoplasm (Cib). (Cii) Two neutrophils fully reside inside the MK cytoplasm. Only the neutrophil membranes remain visible (arrowheads). (D) Frequency of the previously described EP stages (n = 45).
Figure 5.
Figure 5.
Neutrophils interact with the MK endoplasmic reticulum as well as the DMS. MKs were allowed to engage in EP for 12 hours followed by processing for EM or laser scanning confocal microscopy. (A) Transmission EM images of EP. The internalized neutrophil is surrounded by a membrane network (arrowheads) that does not resemble the DMS. Scale bars, 2 µm. (B-D) Cells were stained with anti-CD41 APC (white), anti-Ly6G AF594 (red), anti-calnexin or anti-golgin-97 (green), and Hoechst 33342 (blue). Images were obtained using a Zeiss LSM 800 with Airyscan attached to a Zeiss Axio Observer Z1 Inverted Microscope with a Plan-Apochromat 63x objective. Scale bars, 10 µm. (B-C) The perinuclear portion of the MK endoplasmic reticulum (ER) surrounds the internalized neutrophils (*s). The neutrophils are localized between the MK nucleus and ER. Note the inverse distribution of the DMS and ER. (D) Internalized neutrophils (*) did not colocalize with the Golgi apparatus of MKs.

References

    1. Ebaugh FGJ Jr, Bird RM. The normal megakaryocyte concentration in aspirated human bone marrow. Blood. 1951;6(1):75-80. - PubMed
    1. Machlus KR, Italiano JE Jr. The incredible journey: from megakaryocyte development to platelet formation. J Cell Biol. 2013;201(6):785-796. - PMC - PubMed
    1. Junt T, Schulze H, Chen Z, et al. . Dynamic visualization of thrombopoiesis within bone marrow. Science. 2007;317(5845):1767-1770. - PubMed
    1. Cunin P, Penke LR, Thon JN, et al. . Megakaryocytes compensate for Kit insufficiency in murine arthritis. J Clin Invest. 2017;127(5):1714-1724. - PMC - PubMed
    1. Cunin P, Nigrovic PA. Megakaryocytes as immune cells. J Leukoc Biol. 2019;105(6):1111-1121. - PMC - PubMed

Publication types