

The pattern of alternative splicing in lung adenocarcinoma shows novel events correlated with tumorigenesis and immune microenvironment
- PMID: 34872548
- PMCID: PMC8647402
- DOI: 10.1186/s12890-021-01776-0
The pattern of alternative splicing in lung adenocarcinoma shows novel events correlated with tumorigenesis and immune microenvironment
Abstract
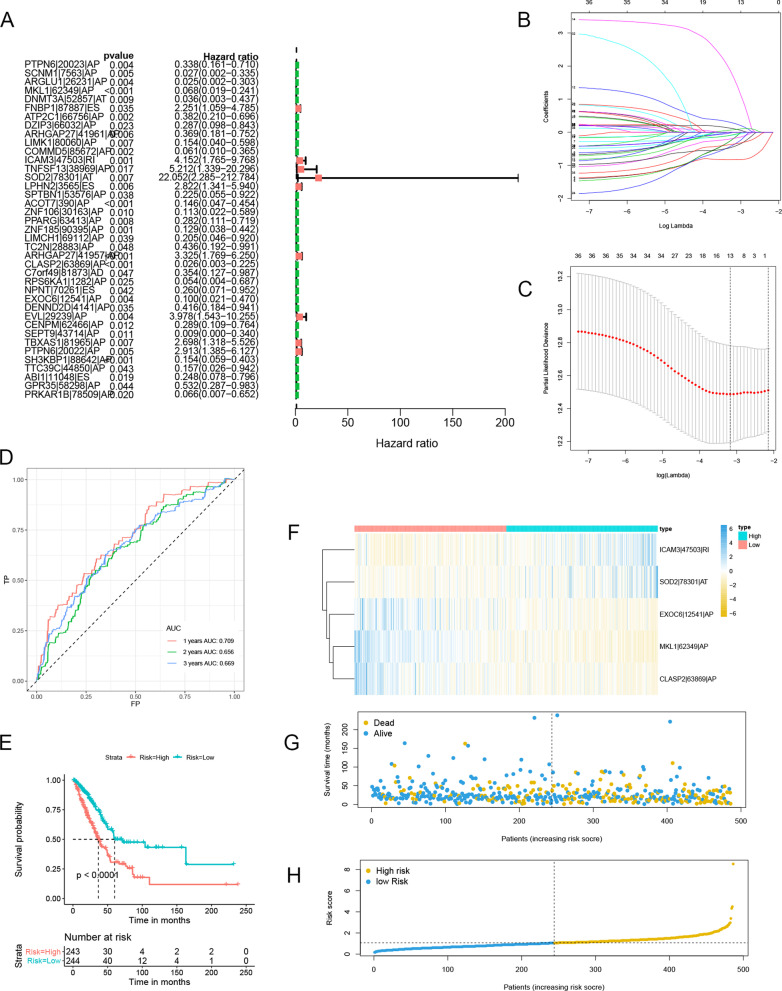
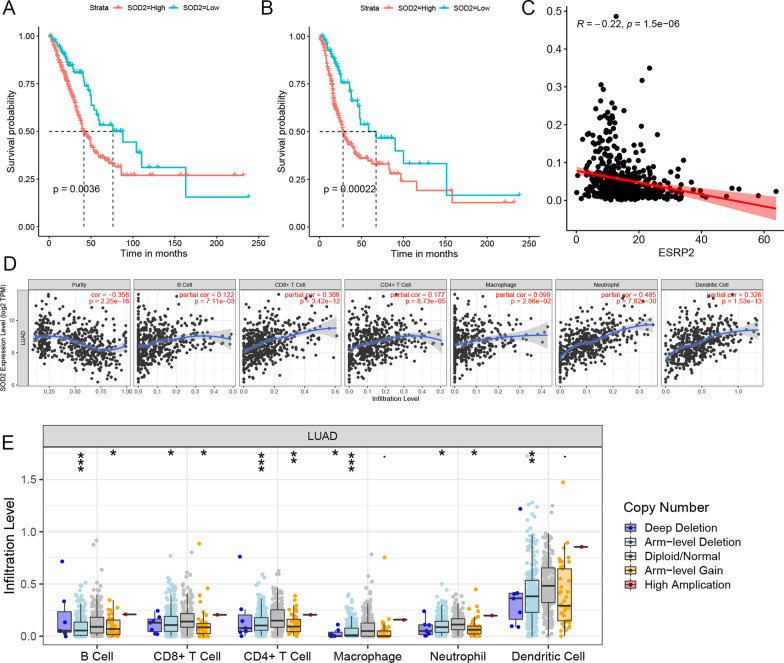
Lung adenocarcinoma (LUAD) is the leading cause of cancer deaths worldwide due to the lack of early diagnostic markers and specific drugs. Previous studies have shown the association of LUAD growth with aberrant alternative splicing (AS). Herein, clinical data of 535 tumor tissues and 59 normal tissues were extracted from The Cancer Genome Atlas (TCGA) database. Each sample was analyzed using the ESTIMATE algorithm; a comparison between higher and lower score groups (stromal or immune) was made to determine the overall- and progression-free survival-related differentially expressed AS (DEAS) events. We then performed unsupervised clustering of these DEASs, followed by determining their relationship with survival rate, immune cells, and the tumor microenvironment (TME). Next, two prognostic signatures were developed using bioinformatics tools to explore the prognosis of cases with LUAD. Five OS- and six PFS-associated DEAS events were implemented to establish a prognostic risk score model. When compared to the high-risk group (HRG), the PFS and OS of the low-risk group (LRG) were found to be considerable. Additionally, a better prognosis was found considerably associated with the ESTIMATE score of the patients as well as immune cells infiltration. Our analysis of AS events in LUAD not only helps to clarify the tumorigenesis mechanism of AS but also provides ideas for revealing potential prognostic biomarkers and therapeutic targets.
Keywords: Alternative splicing; Immune; LUAD; Prognosis; Tumor microenvironment.
© 2021. The Author(s).
Conflict of interest statement
The authors declared no potential conflicts of interest with respect to the research, authorship, and publication of this article.
Figures


Similar articles
-
Prognostic value and immune infiltration of a novel stromal/immune score-related P2RY12 in lung adenocarcinoma microenvironment.Int Immunopharmacol. 2021 Sep;98:107734. doi: 10.1016/j.intimp.2021.107734. Epub 2021 Jun 25. Int Immunopharmacol. 2021. PMID: 34175738
-
Identification of immune-related gene signature predicting survival in the tumor microenvironment of lung adenocarcinoma.Immunogenetics. 2020 Dec;72(9-10):455-465. doi: 10.1007/s00251-020-01189-z. Epub 2020 Nov 13. Immunogenetics. 2020. PMID: 33188484
-
Prognostic value of CCR2 as an immune indicator in lung adenocarcinoma: A study based on tumor-infiltrating immune cell analysis.Cancer Med. 2021 Jun;10(12):4150-4163. doi: 10.1002/cam4.3931. Epub 2021 May 4. Cancer Med. 2021. PMID: 33949150 Free PMC article.
-
Alternative splicing in ovarian cancer.Cell Commun Signal. 2024 Oct 18;22(1):507. doi: 10.1186/s12964-024-01880-8. Cell Commun Signal. 2024. PMID: 39425166 Free PMC article. Review.
-
Alternative Splicing in Lung Adenocarcinoma: From Bench to Bedside.Cancers (Basel). 2025 Apr 15;17(8):1329. doi: 10.3390/cancers17081329. Cancers (Basel). 2025. PMID: 40282505 Free PMC article. Review.
References
-
- Chen W, Zheng R, Baade P, Zhang S, Zeng H, Bray F, et al. Cancer statistics in China, 2015. CA Cancer J Clin. 2016;66(2):115–132. - PubMed
-
- Torre L, Bray F, Siegel R, Ferlay J, Lortet-Tieulent J, Jemal A. Global cancer statistics, 2012. CA Cancer J Clin. 2015;65(2):87–108. - PubMed
-
- Riihimäki M, Hemminki A, Fallah M, Thomsen H, Sundquist K, Sundquist J, et al. Metastatic sites and survival in lung cancer. Lung Cancer. 2014;86(1):78–84. - PubMed
-
- Ettinger D, Wood D, Akerley W, Bazhenova L, Borghaei H, Camidge D, et al. Non-small cell lung cancer, Version 6, 2015. J Natl Compr Cancer Netw. 2015;13(5):515–524. - PubMed
MeSH terms
Substances
Grants and funding
LinkOut - more resources
Full Text Sources
Medical
Research Materials
Miscellaneous
