. 2021 Dec 6;22(1):332.
doi: 10.1186/s13059-021-02529-2.

The SEQC2 epigenomics quality control (EpiQC) study

Affiliations

The SEQC2 epigenomics quality control (EpiQC) study

Jonathan Foox et al. Genome Biol. .

Erratum in

  • Author Correction: The SEQC2 epigenomics quality control (EpiQC) study.
    Foox J, Nordlund J, Lalancette C, Gong T, Lacey M, Lent S, Langhorst BW, Ponnaluri VKC, Williams L, Padmanabhan KR, Cavalcante R, Lundmark A, Butler D, Mozsary C, Gurvitch J, Greally JM, Suzuki M, Menor M, Nasu M, Alonso A, Sheridan C, Scherer A, Bruinsma S, Golda G, Muszynska A, Łabaj PP, Campbell MA, Wos F, Raine A, Liljedahl U, Axelsson T, Wang C, Chen Z, Yang Z, Li J, Yang X, Wang H, Melnick A, Guo S, Blume A, Franke V, de Caceres II, Rodriguez-Antolin C, Rosas R, Davis JW, Ishii J, Megherbi DB, Xiao W, Liao W, Xu J, Hong H, Ning B, Tong W, Akalin A, Wang Y, Deng Y, Mason CE. Foox J, et al. Genome Biol. 2021 Dec 23;22(1):350. doi: 10.1186/s13059-021-02573-y. Genome Biol. 2021. PMID: 34949218 Free PMC article. No abstract available.
  • Author Correction: Benchmarking transposable element annotation methods for creation of a streamlined, comprehensive pipeline.
    Ou S, Su W, Liao Y, Chougule K, Agda JRA, Hellinga AJ, Lugo CSB, Elliott TA, Ware D, Peterson T, Jiang N, Hirsch CN, Hufford MB. Ou S, et al. Genome Biol. 2022 Mar 8;23(1):76. doi: 10.1186/s13059-022-02645-7. Genome Biol. 2022. PMID: 35260190 Free PMC article. No abstract available.

Abstract

Background: Cytosine modifications in DNA such as 5-methylcytosine (5mC) underlie a broad range of developmental processes, maintain cellular lineage specification, and can define or stratify types of cancer and other diseases. However, the wide variety of approaches available to interrogate these modifications has created a need for harmonized materials, methods, and rigorous benchmarking to improve genome-wide methylome sequencing applications in clinical and basic research. Here, we present a multi-platform assessment and cross-validated resource for epigenetics research from the FDA's Epigenomics Quality Control Group.

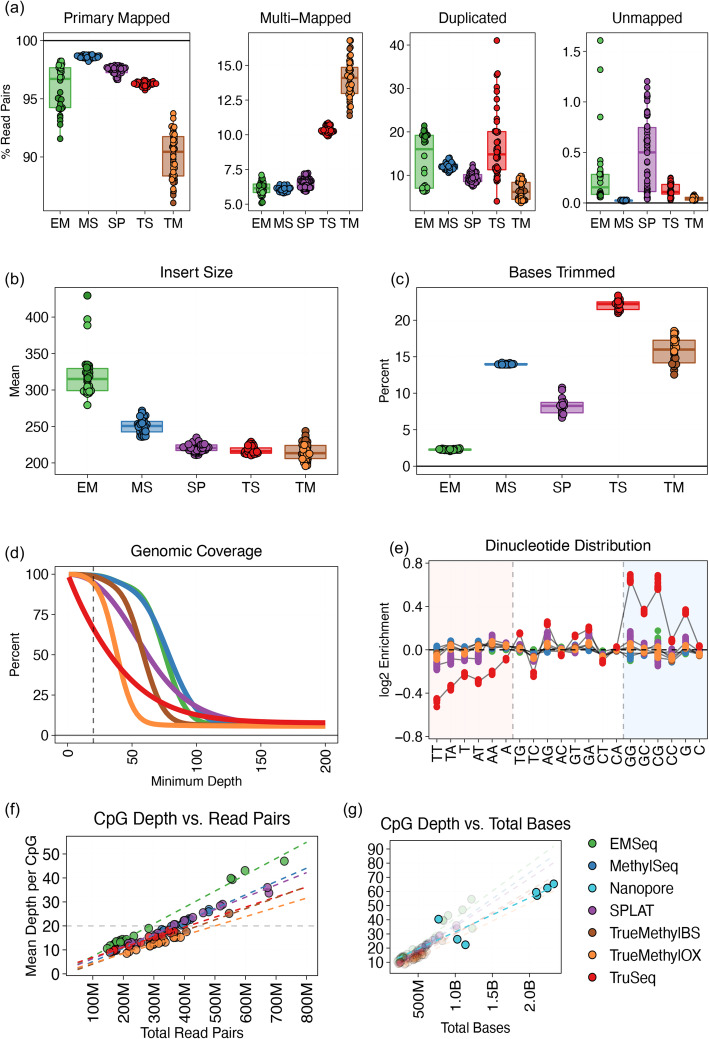
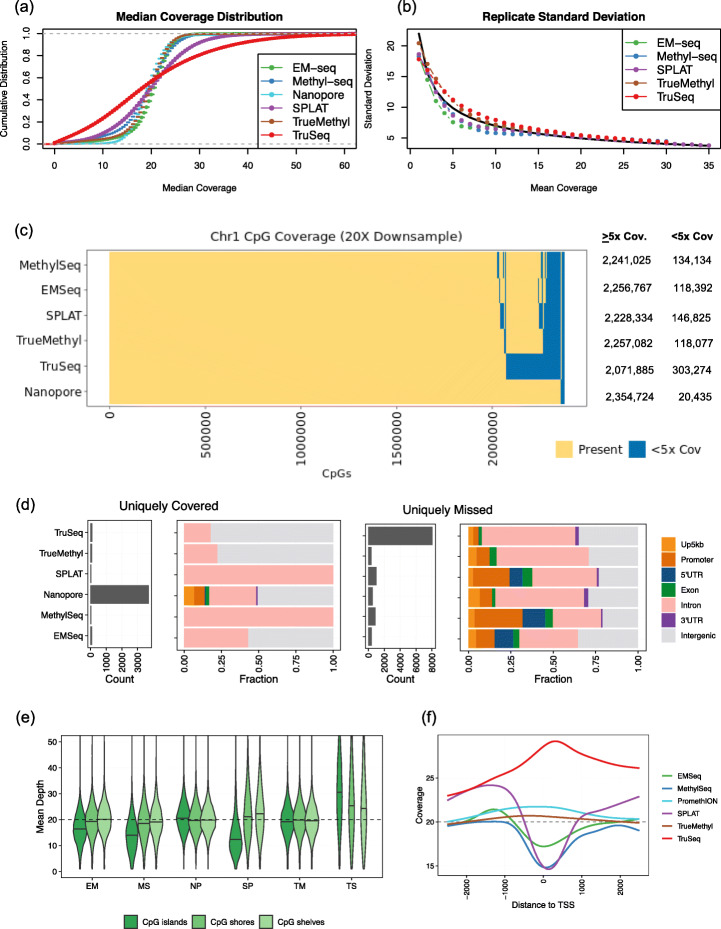
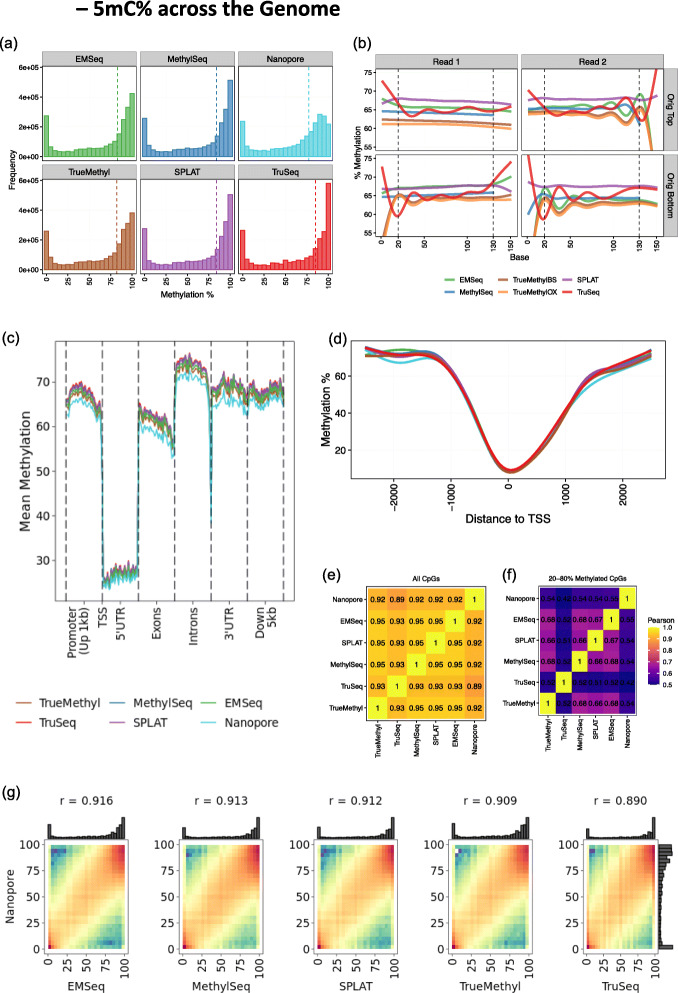
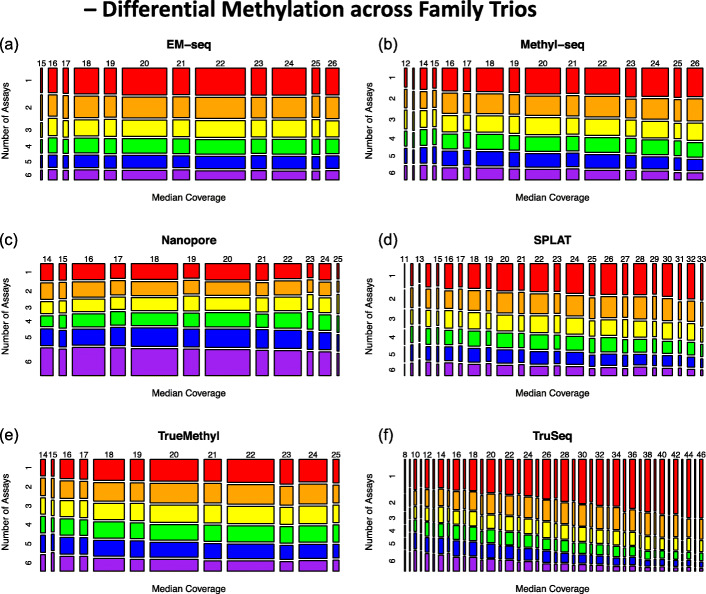
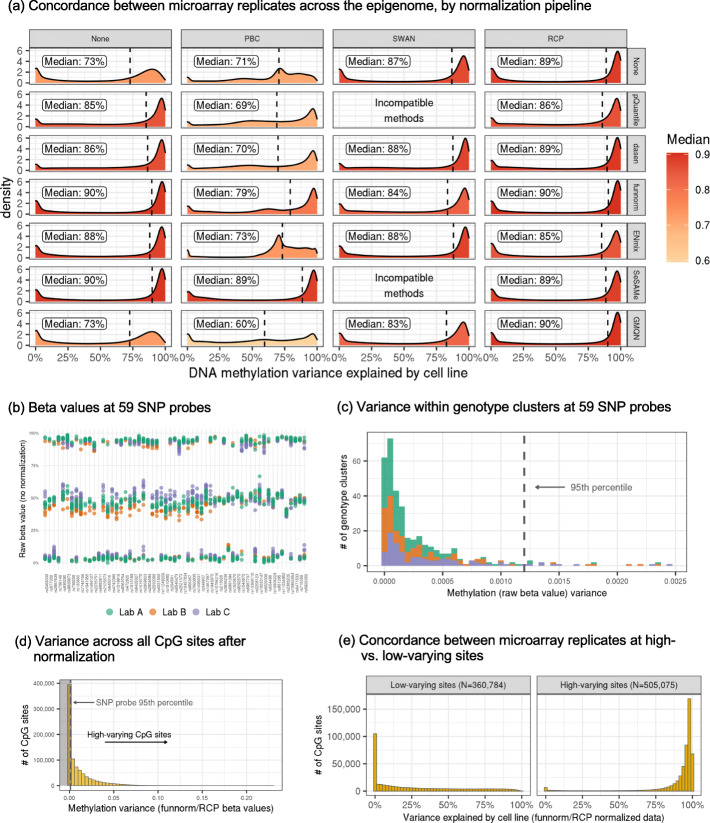
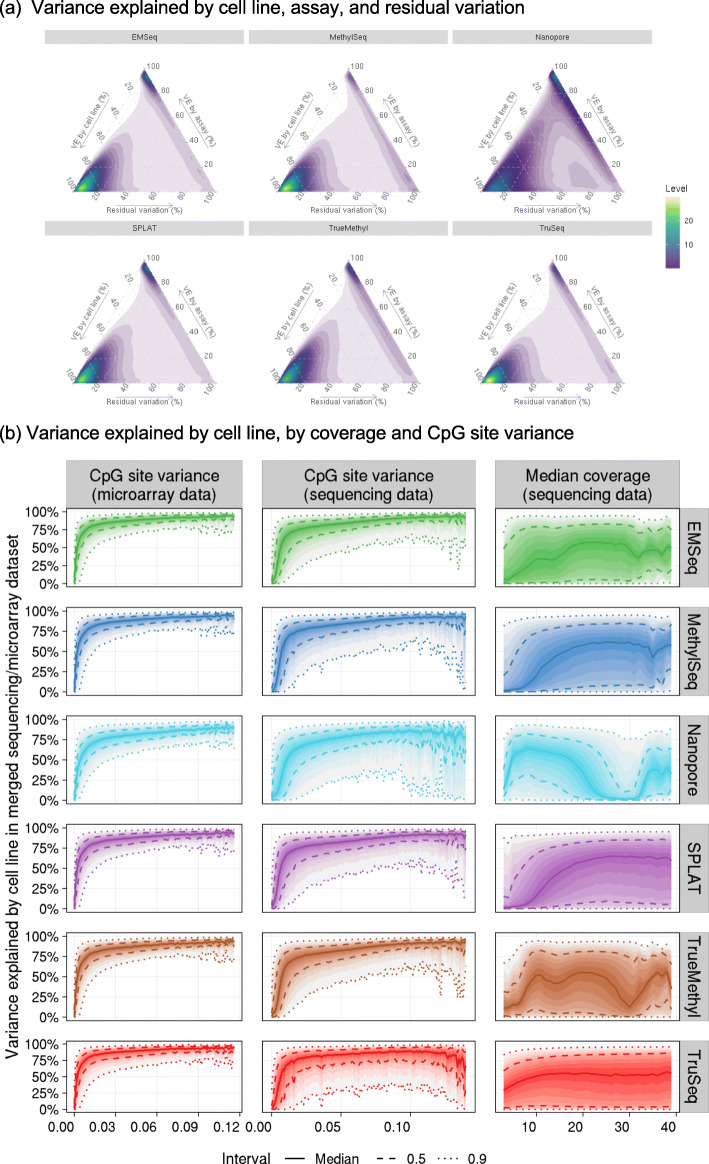
Results: Each sample is processed in multiple replicates by three whole-genome bisulfite sequencing (WGBS) protocols (TruSeq DNA methylation, Accel-NGS MethylSeq, and SPLAT), oxidative bisulfite sequencing (TrueMethyl), enzymatic deamination method (EMSeq), targeted methylation sequencing (Illumina Methyl Capture EPIC), single-molecule long-read nanopore sequencing from Oxford Nanopore Technologies, and 850k Illumina methylation arrays. After rigorous quality assessment and comparison to Illumina EPIC methylation microarrays and testing on a range of algorithms (Bismark, BitmapperBS, bwa-meth, and BitMapperBS), we find overall high concordance between assays, but also differences in efficiency of read mapping, CpG capture, coverage, and platform performance, and variable performance across 26 microarray normalization algorithms.

Conclusions: The data provided herein can guide the use of these DNA reference materials in epigenomics research, as well as provide best practices for experimental design in future studies. By leveraging seven human cell lines that are designated as publicly available reference materials, these data can be used as a baseline to advance epigenomics research.


Conflict of interest statement

B.W.L, M.C., L.W., and V.K.C.P are employees of New England Biolabs. S.L and J.W.D are employees of Abbvie, Inc. S.B is an employee of Illumina, Inc. F.W, J.I, and W.L are employees of New York Genome Center.

Figures

Fig. 1
Fig. 1
Sequencing and alignment metrics of whole methylome libraries, including all replicates across all cell lines. EM = EMSeq; MS = MethylSeq; SP=SPLAT; TS = TruSeq; TM = TrueMethyl. a Distribution of reference-based read alignment outcomes, including primary mapped reads (both mates mapped in correct orientation within a certain distance), multi-mapped reads (read pairs containing secondary or supplementary alignments), reads marked as PCR or optical duplicates, and unmapped reads. Ambiguous and duplicate reads can be a subset of properly aligned reads. b Median insert size distributions derived from distance between aligned paired end reads. c Percentage of bases trimmed per replicate, either due to low base quality, adapter content, or dovetailing reads. d Cumulative genomic coverage plot, averaged across cell line per assay. Coverage is cut off at 200× in this plot, but extends beyond for all assays. Dotted line indicates 20× mean coverage. e Nucleotide bias plot showing the log2 enrichment of covered versus expected mono- and di-nucleotides. f The relationship between the number of read pairs sequenced per assay and the mean depth of coverage per CpG dinucleotide, showing sequencing depth required to achieve a certain level of coverage. 20× CpG coverage is shown as the dotted line. g Same as f, but plotted using total bases sequenced, to include Oxford Nanopore sequencing, which produces variable read lengths
Fig. 2
Fig. 2
Coverage of CpGs across the genome. All samples visualized here were downsampled to 20× mean coverage per CpG. a Empirical cumulative distribution functions for median coverage, averaged across samples for HG002-HG007. b Standard deviation between replicate beta values for HG002 as a function of average coverage. The expected curve (computed based on the assumption that replicate beta values are independent and identically distributed estimates of a common proportion p) is added as a solid black curve. c Intersection of CpG coverage (min 5×) across Chromosome 1. Exact values of CpGs covered per assay are shown on the right. d Count and genomic annotation for CpGs uniquely covered by an assay (left) and uniquely not covered by an assay (right). Up5kb = 5 kb upstream distance from promoter region; Promoter = within 1 kb upstream of transcript start site. e Distribution of coverage in CpG shelves, shores, and islands. EM = EMSeq; MS = MethylSeq; SP=SPLAT; TS = TruSeq; TM = TrueMethyl. f Mean coverage curves around transcript start sites (TSS)
Fig. 3
Fig. 3
Estimates of methylation per CpG across the genome for HG002. All samples visualized here were downsampled to 20× mean coverage per CpG. a Methylation percentage distributions per assay. b Methylation bias (mbias) plots showing mean methylation per base for short-read assays (Nanopore excluded here). Dotted lines indicate recommended cutoffs for methylation calling for these data. Original top/bottom refer to mappings to bisulfite-converted strands in the reference genome. c Metagene plot showing mean methylation across genomic feature per assay. Promoter regions span 1 kb upstream of transcript start sites (TSS). d Mean methylation curves surrounding TSS across all genes. e Pearson correlation matrix of genome-wide methylation estimates. f Pearson correlation matrix of methylation estimates for sites where methylation was estimated to be between 20 and 80%. g Methylation percentage correlation between Oxford Nanopore and all other assays. Pearson correlation values shown on top. Marginal histograms show methylation curves per assay
Fig. 4
Fig. 4
Mosaic plots illustrating agreement between assays for differentially methylated per assay (DMA) sites as coverage levels vary. Rows represent the number of the six assays for which each DMA site was also identified, with values ranging from 1 (indicating no other assays, shaded in red) to 6 (indicating all assays, shaded in purple). Columns indicate the median coverage across HG002-HG007, with values ranging between the 5th and 95th percentiles for each assay
Fig. 5
Fig. 5
Microarray normalization and low-varying site definition. a Densities showing the percentage of DNA methylation variation explained by cell line across the epigenome (N = 677,520 overlapping CpG sites) for each normalization method. b Raw beta values at each of the 59 SNP probes on the Illumina EPIC arrays, with samples colored by lab. c Variance in methylation beta values (no normalization) within each genotype cluster at the 59 SNP probes, separated and colored by lab. The dotted vertical line represents the 95th percentile. d Variance in methylation beta values (normalized with funnorm + RCP) across the epigenome. Sites in the shaded area, which have less variation than 95% of SNP probe genotype clusters, are defined as low-varying sites. e Percentage of methylation (normalized with funnorm + RCP) variance explained by cell line across the epigenome, stratified by high-varying vs. low-varying sites
Fig. 6
Fig. 6
a Density plots of sequencing/microarray concordance indicating the percent of variance explained (VE) by cell line, assay (sequencing or microarray), and residual variation for 841,833 CpG sites with complete information in all assays. b Distribution of percent variance explained by cell line in the sequencing/microarray variance partition analysis as a function of beta value variance (binwidth = 0.001) and median coverage (binwidth = 1) at each CpG site. 90% of the y-axis values fall between the outermost dotted lines for each bin along the x-axis

References

    1. Smith ZD, Meissner A. DNA methylation: roles in mammalian development. Nat Rev Genet. 2013;14(3):204–220. doi: 10.1038/nrg3354. - DOI - PubMed
    1. Robertson KD. DNA methylation and human disease. Nat Rev Genet. 2005;6(8):597–610. doi: 10.1038/nrg1655. - DOI - PubMed
    1. Horvath S, Zhang Y, Langfelder P, Kahn RS, Boks MPM, van Eijk K, van den Berg LH, Ophoff RA. Aging effects on DNA methylation modules in human brain and blood tissue. Genome Biol. 2012;13(10):R97. doi: 10.1186/gb-2012-13-10-r97. - DOI - PMC - PubMed
    1. Zamudio N, Barau J, Teissandier A, Walter M, Borsos M, Servant N, Bourc'his D. DNA methylation restrains transposons from adopting a chromatin signature permissive for meiotic recombination. Genes Dev. 2015;29(12):1256–1270. doi: 10.1101/gad.257840.114. - DOI - PMC - PubMed
    1. Miura F, Enomoto Y, Dairiki R, Ito T. Amplification-free whole-genome bisulfite sequencing by post-bisulfite adaptor tagging. Nucleic Acids Res. 2012;40(17):e136. doi: 10.1093/nar/gks454. - DOI - PMC - PubMed

Publication types