. 2022 Jan 26;42(4):567-580.
doi: 10.1523/JNEUROSCI.1392-21.2021. Epub 2021 Dec 6.

Lunatic Fringe-GFP Marks Lamina-Specific Astrocytes That Regulate Sensory Processing

Affiliations

Lunatic Fringe-GFP Marks Lamina-Specific Astrocytes That Regulate Sensory Processing

Ekin Su Akdemir et al. J Neurosci. .

Abstract

Astrocytes are the most abundant glial cell in the brain and perform a wide range of tasks that support neuronal function and circuit activities. There is emerging evidence that astrocytes exhibit molecular and cellular heterogeneity; however, whether distinct subpopulations perform these diverse roles remains poorly defined. Here we show that the Lunatic Fringe-GFP (Lfng-GFP) bacteria artificial chromosome mouse line from both sexes specifically labels astrocyte populations within lamina III and IV of the dorsal spinal cord. Transcriptional profiling of Lfng-GFP+ astrocytes revealed unique molecular profiles, featuring an enriched expression of Notch- and Wnt- pathway components. Leveraging CRE-DOG viral tools, we ablated Lfng-GFP+ astrocytes, which decreased neuronal activity in lamina III and IV and impaired mechanosensation associated with light touch. Together, our findings identify Lfng-GFP+ astrocytes as a unique subpopulation that occupies a distinct anatomic location in the spinal cord and directly contributes to neuronal function and sensory responses.SIGNIFICANCE STATEMENT Astrocytes are the most abundant glial cell in the CNS, and their interactions with neurons are essential for brain function. However, understanding the functional diversity of astrocytes has been hindered because of the lack of reporters that mark subpopulations and genetic tools for accessing them. We discovered that the Lfng-GFP reporter mouse labels a laminae-specific subpopulation of astrocytes in the dorsal spinal cord and that ablation of these astrocytes reduces glutamatergic synapses. Further analysis revealed that these astrocytes have a role in maintaining sensory-processing circuity related to light touch.

Keywords: astrocyte; circuit activities; glia; sensory processing; spinal cord.


Figures

Figure 1.
Figure 1.
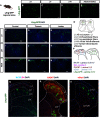
Lfng-GFP reporter mice mark a laminae-specific cell population in the dorsal spinal cord. A–E, Spinal cord sections of Lfng-GFP reporter mice immunostained with GFP. At postnatal days 3, 7,14, and 21, GFP is expressed throughout the spinal cord. In the adult mice, Lfng-GFP expression is restricted to the dorsal horn of the spinal cord. Scale bar, 100 µm. F–N, Lfng-GFP spinal cord is sectioned by segments: cervical, thoracic, and lumbar, and the dorsal-ventral expression pattern is consistent among the segments in p3 and p21, and in the adult. Scale bar, 100 µm. O, P, Diagram showing lamina markers in dorsal spinal cord and laminae where primary afferents terminate. Q, IB4 marks lamina II, while neurons expressing NK1R are in laminae I, III, and IV. LFNG-GFP+ cells are below lamina II. Scale bar, 50 µm. R, S, Immunohistochemistry for GAD67 to define the borders of Lamina III. VGluT1 is most abundant in laminae III and IV. Scale bar, 50 µm.
Figure 2.
Figure 2.
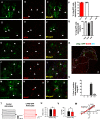
Lfng-GFP+ cells exhibit molecular and physiological properties of astrocytes. AF, P, Coexpression of NFIA, Sox9, and GFP. Lfng-GFP cells express astrocyte markers (SOX9: 98 ± 1.5%, n = 40 cells, nine slices from three mice; NFIA: 99 ± 1%, n = 40 cells, nine slices from three mice. Scale bar, 20 µm. GL, P, Coexpression of NeuN and Olig2. Lfng-GFP cells do not express markers for neuronal and oligodendrocyte lineage (NeuN: 0.5%, n = 40 cells, nine slices from three mice; Olig2: 0.5%, n = 40 cells, nine slices from three mice). Scale bar, 20 µm. MO, Q, Coexpression of AldoC and quantification of GFAP and S100B with GFP (AldoC: 97 ± 1.5% n = 40 cells, nine slices from three mice). Scale bar, 20 µm. R, S, Quantification of the percentage of Sox9 cells expressing Lfng-GFP. Scale bar, 50 µm. For lamina III, 38 ± 7.6%; for lamina IV, 4.3 ± 1.15%; n = 3 slices for three mice). T–V, Whole-cell patch-clamp electrophysiology of astrocytes shows no significant differences in the membrane potential (ventral, −72.6 ± 3.4 mV; Lfng-GFP, −72.4 ± 2.4 mV; t = 0.04673, df = 13, p = 0.9634) and conductance (ventral, 33.6 ± 13.8 pF; Lfng-GFP; 29.96 ± 7.51 pF; t = 0.2537, df = 13, p = 0.8037) between two groups. Statistical comparisons were performed with the two-tailed, unpaired Student's t test (ventral astrocytes, n = 5; Lfng-GFP+ astrocytes, n = 10). W, Stepped voltage injections revealed no differences in I–V between Lfng-GFP+ and ventral astrocytes (cell type: F(1,13) = 0.04, p = 0.8290; group interaction: F(13,169) = 0.03, p > 0.9999). Statistical comparisons were made using a two-way ANOVA (ventral astrocytes, n = 5; Lfng-GFP+ astrocytes, n = 10). Data are presented as mean ± SEM (standard error of the mean). Levels of statistical significance are indicated as follows: * (p < 0.05), ** (p < 0.01), *** (p < 0.001), ns (not significant).
Figure 3.
Figure 3.
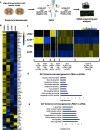
Lfng-GFP+ astrocytes have a unique molecular signature. A, Diagram showing dissection, disassociation, and collection of LFNG-GFP+ and Aldhl1l-GFP+ astrocytes for mRNA sequencing and analysis. B, Comparing our dataset with astrocytic genes showed that Lfng-GFP+ and Aldh1l1-GFP+ populations possess molecular profiles consistent with astrocyte-specific signatures. C, Analysis of differentially expressed genes in Lfng-GFP+ astrocytes. Selected genes have a fold change >1.5 and p < 0.05. We found 148 genes enriched in only Aldh1l1-GFP+ astrocytes and 81 genes only enriched in only LFNG-GFP+ astrocytes, while 247 genes were enriched within both groups. D, Examination of the GO terms was conducted in the comparison of LFNG-GFP+ versus Aldhl1l-GFP+ astrocytes. E, Examination of the GO terms was conducted in the comparison of LFNG-GFP+ astrocytes versus LFNG-GFP cells.
Figure 4.
Figure 4.
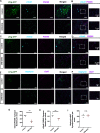
Lfng-GFP+ astrocytes are enriched with Notch and Wnt signaling pathway genes. A, Wnt-signaling genes Apcdd1, Axin 2, and Ctnnb1 (β-catenin), and Notch signaling pathway genes Lfng, Dll4, Notch3, Sox17, Jag1, Adam10, and Hes1 are enriched in Lfng-GFP+ astrocytes. B–D, β-Catenin is colocalized with Lfng-GFP+ astrocytes. Scale bar, 20 µm. E–G, Hes1 is colocalized with Lfng-GFP+ astrocytes. Scale bar, 50 µm.
Figure 5.
Figure 5.
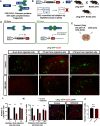
CRE-DOG and DTA mediated ablation of Lfng-GFP+ astrocytes. A, B, Diagram explaining CRE-DOG and DTA. The CRE-DOG system uses two split fragments of Cre recombinase that unite as a functional Cre molecule only in the presence of GFP. Cre-controlled cell ablation occurs cell autonomously. C, D, Diagram showing mouse crosses and injection scheme. An Lfng-GFP mouse was crossed with a ROSA26-DTA mouse to generate a Lfng-GFP; ROSA26-DTA mouse. Cell ablation because of DTA expression is seen only in cells expressing GFP. E, Diagram showing control and CRE-DOG injection sides. Only one component of the CRE-DOG system injected to control side. Contralateral side had both components of the CRE-DOG system. F–H, Control injection side of the Lfng-GFP; ROSA26-DTA mouse. Coexpression GFP and Sox9. Lfng-GFP+ astrocytes are present. Scale bar, 50 µm. I–K, CRE-DOG injection side of Lfng-GFP; ROSA26-DTA mouse. Lfng-GFP+ astrocytes are ablated. Scale bar, 50 µm. L, Quantification of the relative number of Lfng-GFP+ astrocytes from the CRE-DOG side (ablation) compared with the control side (n = 3 sections from three mice; experimental group ablation vs nonablation: F(1,14) = 117.8, p = 0.0004; group interaction: F(2,8) = 150.7, p < 0.0001; 5 µm adjusted p = 0.0007, 75 µm adjusted p = 0.0063, 150 µm adjusted p = 0.8409). Statistical comparisons were performed with the two-way ANOVA with Bonferroni's multiple-comparison test. M, Quantification of the relative number of astrocytes from the CRE-DOG side (ablation) compared with the control side. (n = 3 sections from three mice; experimental group ablation vs nonablation: F(1,4) = 34.01, p = 0.0043; group interaction: F(2,8) = 15.08, p = 0.0019, 5 µm adjusted p = 0.0058, 75 µm adjusted p = 0.0271, 150 µm adjusted p > 0.9999). Statistical comparisons were performed with two-way ANOVA with Bonferroni's multiple-comparison test. N–P, NeuN staining of control and ablation sites to quantify neurons. Scale bar, 50 µm (n = 3 sections from three mice; control, 243 ± 6.6; CRE-DOG, 226 ± 4.8; t = 1.462, df = 2, p = 0.2812). Statistical comparisons made performed with the two-tailed, unpaired Student's t test. Data are presented as mean ± SEM (standard error of the mean). Levels of statistical significance are indicated as follows: * (p < 0.05), ** (p < 0.01), *** (p < 0.001), ns (not significant).
Figure 6.
Figure 6.
Ablation of Lfng-GFP+ astrocytes decreases glutamatergic synapses. A, Glutamatergic synapse staining with VGluT1 and PSD-95 in control and ablation conditions. Scale bar, 10 µm. B, Overlay of VGluT1 and PSD-95 staining. Scale bars: 10 µm; higher magnification, 2 µm in control and ablation conditions. C, Glutamatergic synapse staining with VGluT2 and PSD-95 in control and ablation conditions. Scale bar, 10 µm. D, Overlay of VGluT2 and PSD-95 staining. Scale bars: 10 µm; higher magnification, 2 µm in control and ablation conditions. E, GABAergic synapse staining with gephyrin and VGAT in control and ablation conditions. Scale bar, 10 µm. F, Overlay of gephyrin and VGAT. Scale bars: 10 µm; higher magnification, 2 µm in control and ablation conditions. G, H, Quantification of glutamatergic synapses using Synapse Counter on ImageJ (three slides per region; n = 3 mice, n = 3 sections from three mice; VGluT1/PSD-95: control, 382.33 ± 13.691; CRE-DOG, 263.33 ± 22.303; t = 13.11, df = 2, p = 0.0058; vGLUT2/PSD-95: control, 571.33 ± 12.347; CRE-DOG, 267.66 ± 35.983; t = 12.21, df = 2, p = 0.0066). Statistical comparisons were performed with the two-tailed, paired Student's t test. I, Quantification of GABAergic synapse synapses using Synapse Counter on ImageJ (three slides per region; n = 3 mice; control, 429.33 ± 35.968; CRE-DOG, 422 ± 20.306; t = 0.1573, df = 2, p = 0.8895). Statistical comparisons were made performed with the two-tailed, paired Student's t test. Data are presented as mean ± SEM (standard error of the mean). Levels of statistical significance are indicated as follows: * (p < 0.05), ** (p < 0.01), *** (p < 0.001), ns (not significant).
Figure 7.
Figure 7.
Ablation of Lfng-GFP+ astrocytes impairs dorsal spinal cord circuit activity. A, Diagram explaining measuring of fEPSP amplitude from layer III-IV after applying electrical stimulation into layer I-II spinal cord. B, C, Amplitude of fEPSP in control and CRE-DOG-injected Lfng-GFP; ROSA26-DTA mouse. In the CRE-DOG group, there is a significant reduction in controls (ablation vs nonablation: F(1,18) = 44.98, p < 0.0001; group interaction: F(5,90) = 33.19, p < 0.0001) in the input–out curve. Statistical comparisons were made performed with the two-way ANOVA with Bonferroni's multiple-comparison test (n = 10 cells from each group with three mice per group). D, Both groups showed similar latency in hot plate test. (The CRE-DOG injected group demonstrated similar sensitivity to controls in the hot plate assay (n = 9 mice/ group; CRE-DOG, 16.333 ± 0.373; CRE-DOG, 15.556 ± 1.444; t = 1.341, df = 16, p = 0.1987). Statistical comparisons were performed with unpaired Student's t test. E, Ablation of Lfng-GFP+ astrocytes diminishes light touch sensitivity at 0.4 and 0.6 × g forces (n = 15 mice/group; experimental group ablation vs nonablation: F(1,14) = 106.4, p < 0.0001; group interaction: F(5,70) = 53.32, p < 0.0001). Statistical comparisons were performed with the two-way ANOVA with Bonferroni's multiple-comparison test. F, Ablation group showed reduced paw withdrawal frequency in the cotton swab test (n = 9 mice/group; control, 57.78 ± 3.643; CRE-DOG, 38.33 ± 3.727; t = 3.731, df = 16, p = 0.0018). Statistical comparisons were made performed with unpaired Student's t test. G, Both groups showed similar time to contact to adhesive label (n = 9 mice/group; control, 117.333 ± 15.376; CRE-DOG, 168.00 ± 25.343; t = 1.777, df = 16, p = 0.0946). Statistical comparisons were performed with unpaired Student's t test. Data are presented as mean ± SEM (standard error of the mean). Levels of statistical significance are indicated as follows: * (p < 0.05), ** (p < 0.01), *** (p < 0.001), ns (not significant).

References

    1. Acaz-Fonseca E, Ortiz-Rodriguez A, Azcoitia I, Garcia-Segura LM, Arevalo MA (2019) Notch signaling in astrocytes mediates their morphological response to an inflammatory challenge. Cell Death Discov 5:85. 10.1038/s41420-019-0166-6 - DOI - PMC - PubMed
    1. Allen NJ, Barres BA (2009) Neuroscience: glia—more than just brain glue. Nature 457:675–677. 10.1038/457675a - DOI - PubMed
    1. Allen NJ, Eroglu C (2017) Cell biology of astrocyte-synapse interactions. Neuron 96:697–708. - PMC - PubMed
    1. Alvarez FJ, Villalba RM, Zerda R, Schneider SP (2004) Vesicular glutamate transporters in the spinal cord, with special reference to sensory primary afferent synapses. J Comp Neurol 472:257–280. 10.1002/cne.20012 - DOI - PubMed
    1. Basch ML, Brown RM, Jen H-I, Semerci F, Depreux F, Edlund R, Zhang H, Norton CR, Gridley T, Cole SE, Doetzlhofer A, Maletic-Savatic M, Segil N, Groves AK (2016) Fine-tuning of Notch signaling sets the boundary of the organ of Corti and establishes sensory cell fates. eLife 5:e19921. 10.7554/eLife.19921 - DOI - PMC - PubMed

Publication types