

A Microfluidic Cancer-on-Chip Platform Predicts Drug Response Using Organotypic Tumor Slice Culture
- PMID: 34872965
- PMCID: PMC9397621
- DOI: 10.1158/0008-5472.CAN-21-0799
A Microfluidic Cancer-on-Chip Platform Predicts Drug Response Using Organotypic Tumor Slice Culture
Abstract
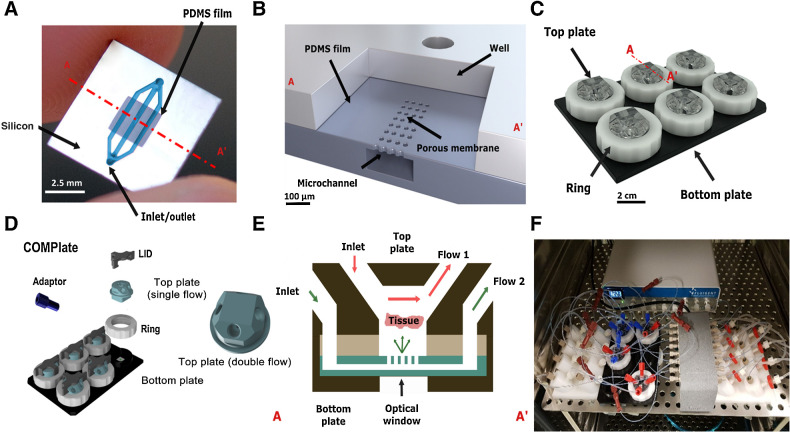
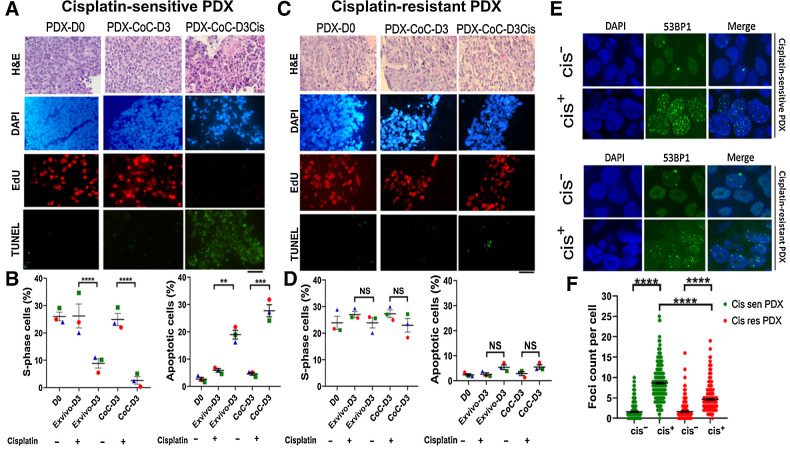
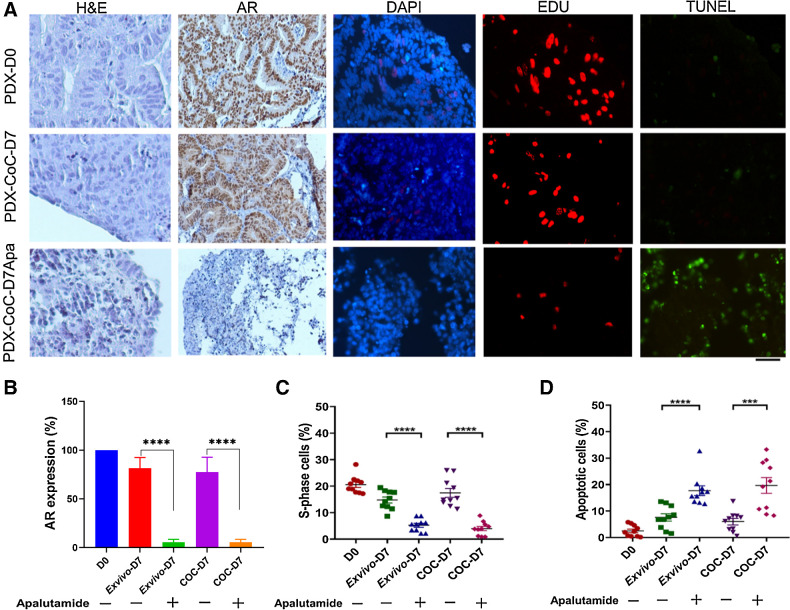
Optimal treatment of cancer requires diagnostic methods to facilitate therapy choice and prevent ineffective treatments. Direct assessment of therapy response in viable tumor specimens could fill this diagnostic gap. Therefore, we designed a microfluidic platform for assessment of patient treatment response using tumor tissue slices under precisely controlled growth conditions. The optimized Cancer-on-Chip (CoC) platform maintained viability and sustained proliferation of breast and prostate tumor slices for 7 days. No major changes in tissue morphology or gene expression patterns were observed within this time frame, suggesting that the CoC system provides a reliable and effective way to probe intrinsic chemotherapeutic sensitivity of tumors. The customized CoC platform accurately predicted cisplatin and apalutamide treatment response in breast and prostate tumor xenograft models, respectively. The culture period for breast cancer could be extended up to 14 days without major changes in tissue morphology and viability. These culture characteristics enable assessment of treatment outcomes and open possibilities for detailed mechanistic studies. SIGNIFICANCE: The Cancer-on-Chip platform with a 6-well plate design incorporating silicon-based microfluidics can enable optimal patient-specific treatment strategies through parallel culture of multiple tumor slices and diagnostic assays using primary tumor material.
©2021 The Authors; Published by the American Association for Cancer Research.
Figures
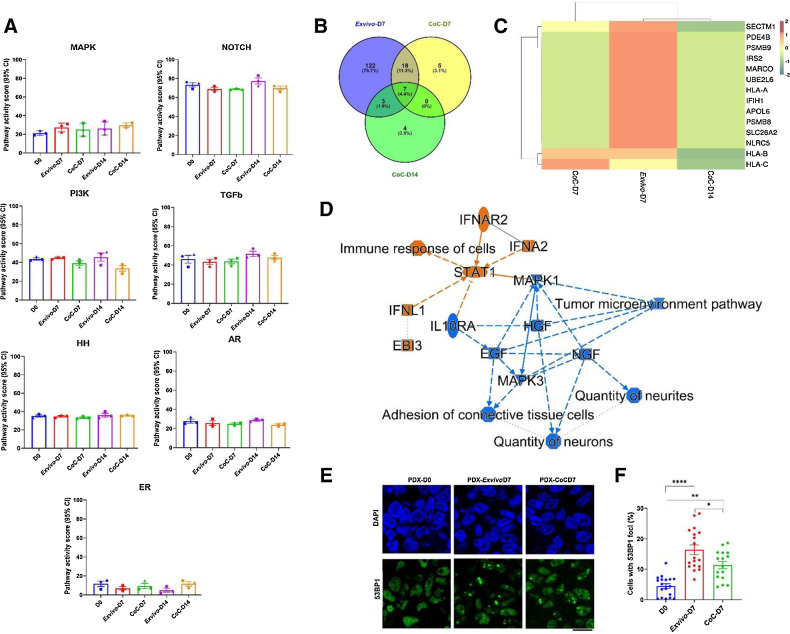
![Figure 4. Breast PDX tumor tissue slices cultured in ex vivo condition and in CoC platform for up to 14 days. A, We used five independent breast PDX tumors in five independent experiments to establish optimized culture condition for tumor slices in our CoC platform. From each breast PDX tumor, tissue slices were cultured in ex vivo 6-well plate and CoC device for up to 14 days and evaluated for tissue morphology [hematoxylin and eosin (H&E) staining], DAPI (blue nuclei), proliferation (EdU incorporation, red nuclei), Ki67 (brown nuclei), and apoptosis (TUNEL staining, green nuclei). Scale bar, 50 μm. B and C, Quantification of the fraction of EdU-positive and TUNEL-positive cells for 5 breast PDX tissue slices (derived from individual PDX tumors) cultured for up to day 7 (B) and day 14 (C). For each breast PDX tumor and each condition, tissue slices were imaged, and ten random fields of view were quantified from each breast PDX slice. Each data point in the graph represents one image field. Error bar represents the SEM for the five independent tumors performed in five independent experiments. D, Representative image showing breast PDX tumors (n = 3) labeled with geminin (red nuclei) and DAPI (blue nuclei). Scale bar, 50 μm. E, QIBC analysis of three independent breast PDX tumors with more than 3,000 cells analyzed for each are shown in each condition. F, Quantification of geminin-positive cells showed CoC at day 7 had similar cell proliferation profile as in day 0 than ex vivo condition. Error bar, SEM. NS, not significant; D0, day 0; D7, day 7, D14, day 14. NS, not significant; *, P < 0.05; **, P < 0.01; ***, P < 0.001; ****, P < 0.0001.](https://cdn.ncbi.nlm.nih.gov/pmc/blobs/7a25/9397621/07f980b4b632/510fig4.jpg)
References
-
- Ter Brugge P, Kristel P, van der Burg E, Boon U, de Maaker M, Lips E, et al. . Mechanisms of therapy resistance in patient-derived xenograft models of BRCA1-deficient breast cancer. J Natl Cancer Inst 2016;108:djw148. - PubMed
Publication types
MeSH terms
Substances
LinkOut - more resources
Full Text Sources
Miscellaneous
