. 2021 Dec 6;6(1):414.
doi: 10.1038/s41392-021-00835-6.

Azvudine is a thymus-homing anti-SARS-CoV-2 drug effective in treating COVID-19 patients

Affiliations

Azvudine is a thymus-homing anti-SARS-CoV-2 drug effective in treating COVID-19 patients

Jin-Lan Zhang et al. Signal Transduct Target Ther. .

Abstract

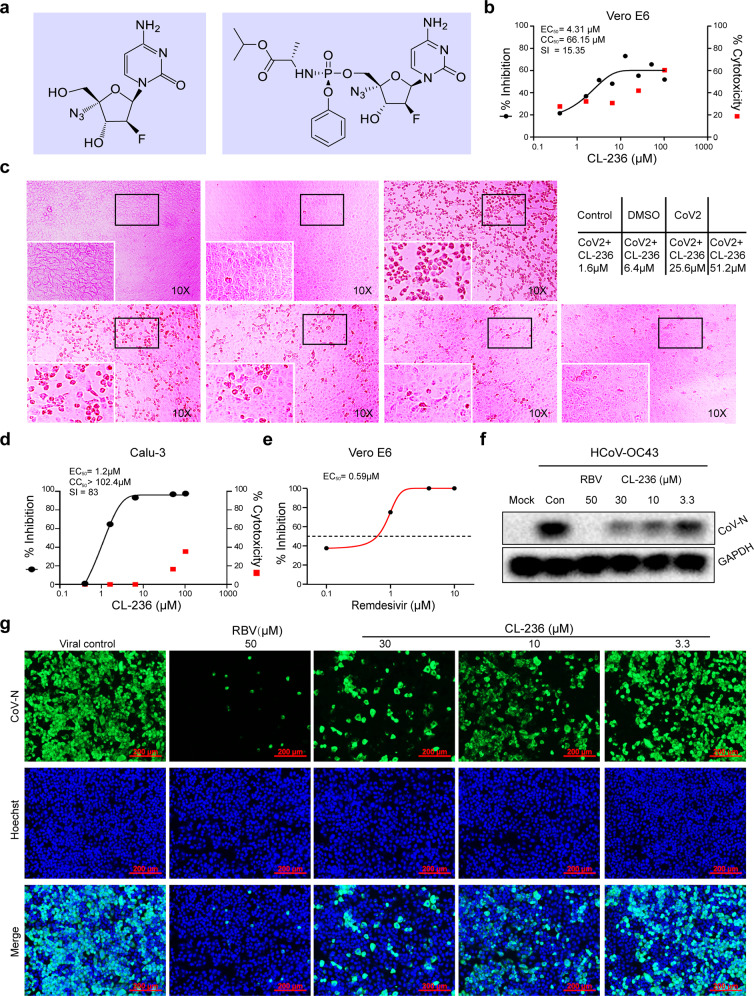
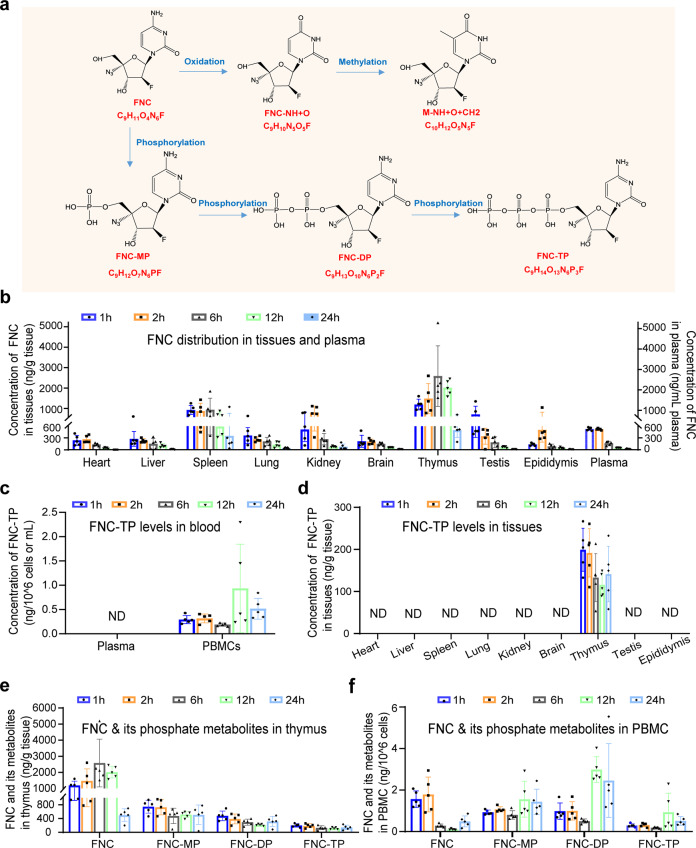
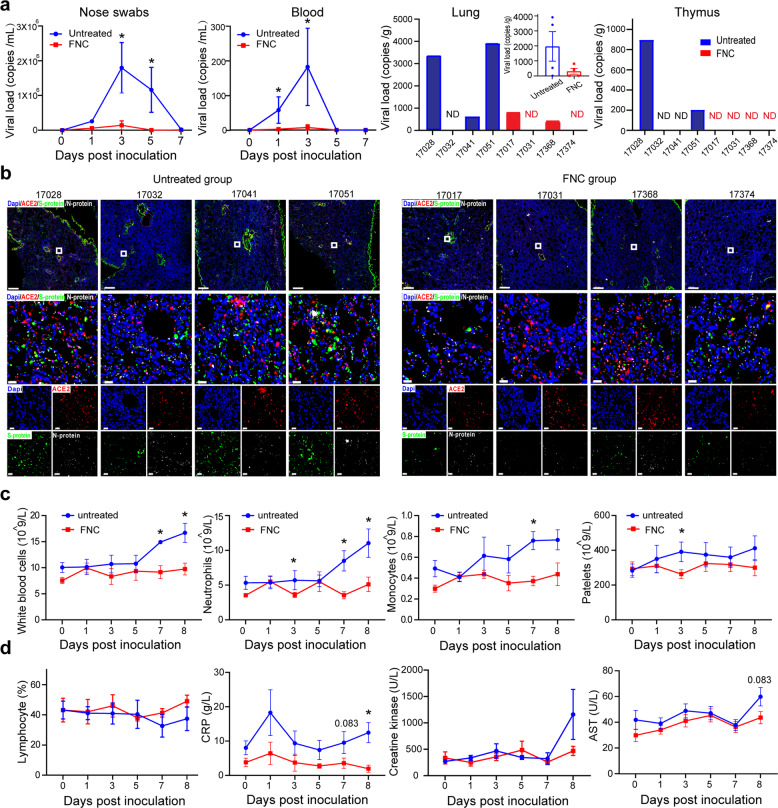
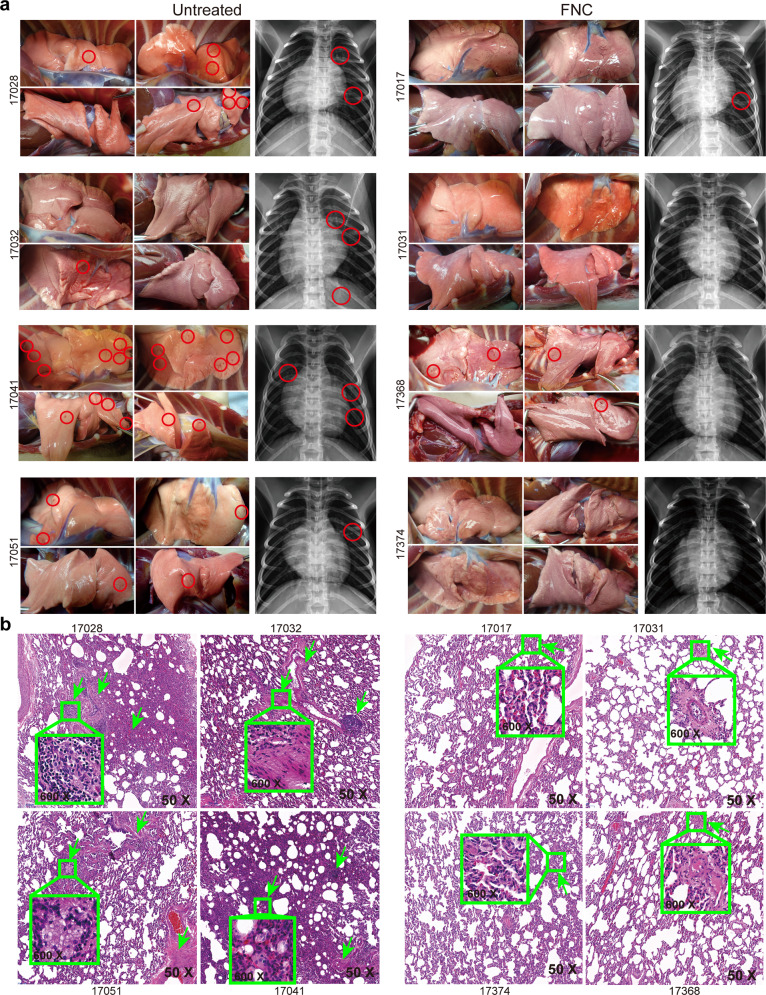
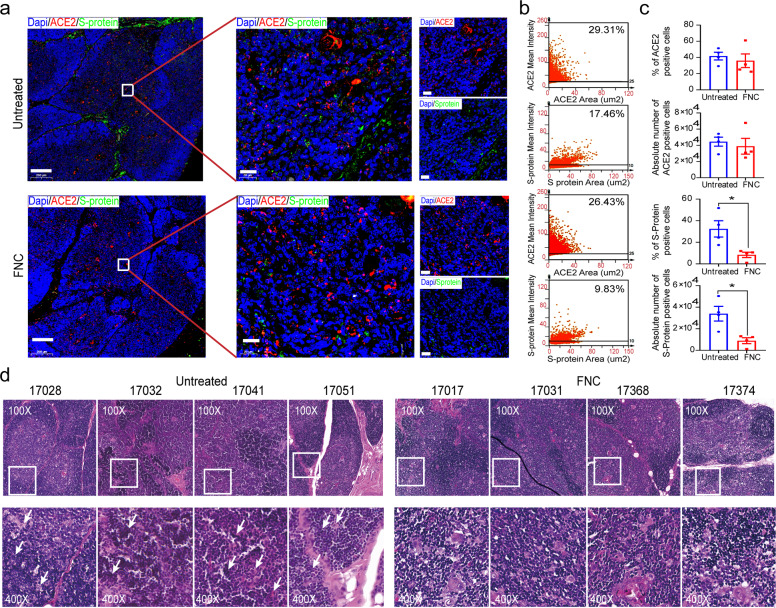
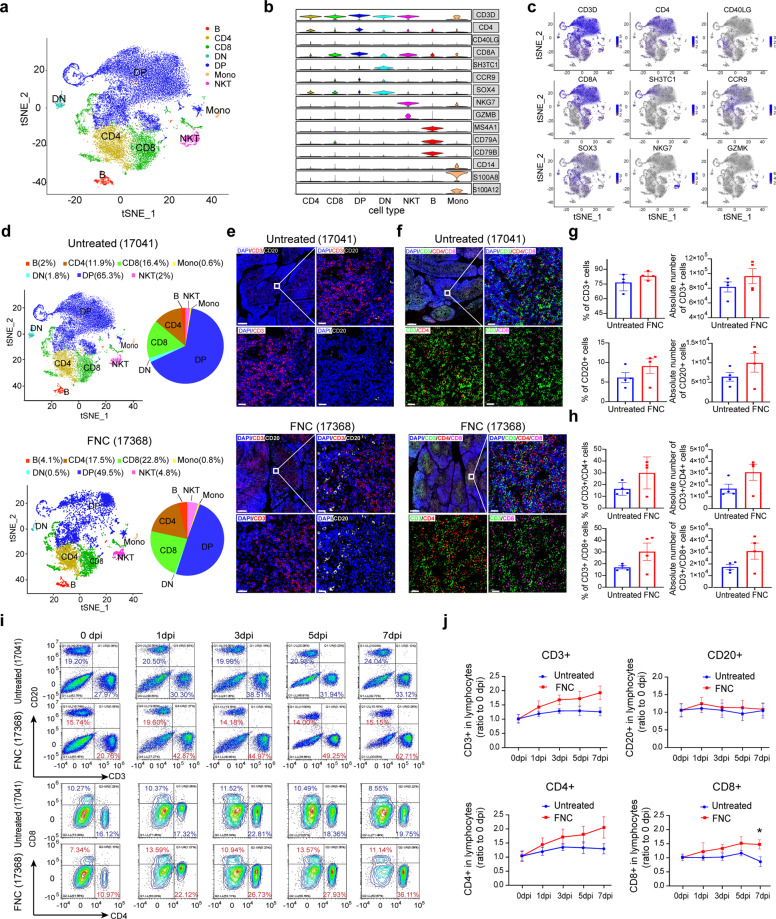
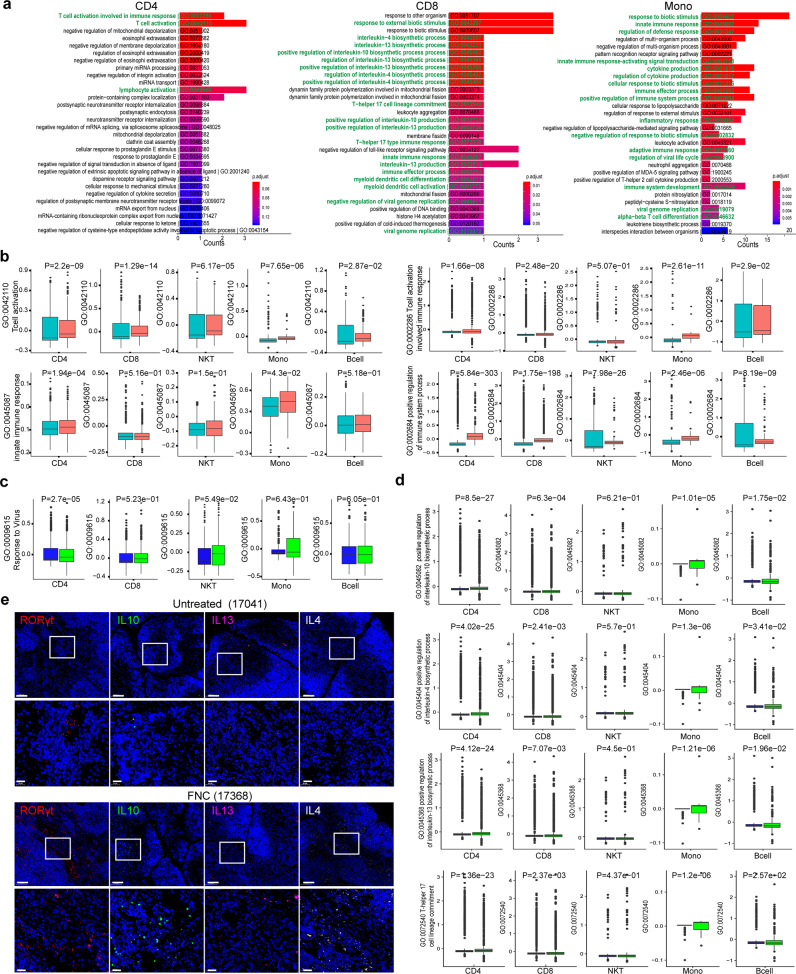
Azvudine (FNC) is a nucleoside analog that inhibits HIV-1 RNA-dependent RNA polymerase (RdRp). Recently, we discovered FNC an agent against SARS-CoV-2, and have taken it into Phase III trial for COVID-19 patients. FNC monophosphate analog inhibited SARS-CoV-2 and HCoV-OC43 coronavirus with an EC50 between 1.2 and 4.3 μM, depending on viruses or cells, and selective index (SI) in 15-83 range. Oral administration of FNC in rats revealed a substantial thymus-homing feature, with FNC triphosphate (the active form) concentrated in the thymus and peripheral blood mononuclear cells (PBMC). Treating SARS-CoV-2 infected rhesus macaques with FNC (0.07 mg/kg, qd, orally) reduced viral load, recuperated the thymus, improved lymphocyte profiles, alleviated inflammation and organ damage, and lessened ground-glass opacities in chest X-ray. Single-cell sequencing suggested the promotion of thymus function by FNC. A randomized, single-arm clinical trial of FNC on compassionate use (n = 31) showed that oral FNC (5 mg, qd) cured all COVID-19 patients, with 100% viral ribonucleic acid negative conversion in 3.29 ± 2.22 days (range: 1-9 days) and 100% hospital discharge rate in 9.00 ± 4.93 days (range: 2-25 days). The side-effect of FNC is minor and transient dizziness and nausea in 16.12% (5/31) patients. Thus, FNC might cure COVID-19 through its anti-SARS-CoV-2 activity concentrated in the thymus, followed by promoted immunity.


Conflict of interest statement

The authors declare no competing interests.

Figures

Fig. 1
Fig. 1
Anti-coronavirus activity of FNC analog CL-236 in vitro. Vero E6 cells and Calu-3 cells were pre-treated with the different doses of CL-236 for 1 h. SARS-CoV-2 (MOI = 0.05) was subsequently added to cells, followed by 1 h incubation. Then, the virus-drug mixture was removed and cells were further cultured with a fresh drug-containing medium for 48 h. Anti- SARS-CoV-2 efficacy of CL-236 was evaluated by measuring SARS-CoV-2 viral RNA copy numbers via qRT-PCR and CPE evaluation. For the antiviral test against HCoV-OC43, H460 cells were infected with HCoV-OC43 (MOI = 0.05). Then, various concentrations of CL-236 were added at the same time for 48 h incubation and then the CoV-N protein was analyzed using immunofluorescence analysis or determined by Western blot. a Chemical structure of FNC (left) and CL-236 (right). b CL-236 inhibited SARS-CoV-2 RNA replication in Vero E6 with EC50 of 4.3 μM; CC50 of 66.15 μM (qRT-PCR, 48 h). c CL-236 protected Vero E6 cells from SARS-CoV-2 infection caused CPE in 48 h. d CL-236 suppressed SARS-CoV-2 RNA replication in Calu-3 with EC50 of 1.2 μM; CC50 > 102.4 μM (qRT-PCR, 48 h). e Remdesivir inhibited SARS-CoV-2 in Vero E6 cells (48 h). f CL-236 decreased expression of HCoV-OC43 CoV-N protein in H460 cells (western blot, 48 h). g CL-236 reduced HCoV-OC43 CoV-N protein expression in H460 cells (immunofluorescence, 48 h). RBV ribavirin
Fig. 2
Fig. 2
Thymus-homing distribution and metabolism of FNC after oral administration in rats. Twenty-five male Sprague–Dawley rats were orally administered with FNC at a single dose of 5 mg/kg. At the time point of 1, 2, 6, 12, and 24 h after drug administration, 5 rats were dissected. The blood, as well as the heart, liver, spleen, lung, kidney, brain, thymus, testis, and epididymis, were collected. Peripheral blood mononuclear cells (PBMCs) were isolated from blood using Histopaque-1083. The distribution of FNC in plasma, PBMCs, and the different tissues was evaluated through UHPLC–MS/MS analysis performed on an UHPLC system (1290 series, Agilent Technologies, USA) coupled to a triple quadrupole mass spectrometer (Agilent 6470 QQQ). a Metabolic pathway of FNC. b FNC distribution in tissues and plasma (5 mg/kg, oral). c FNC-TP levels in the blood (5 mg/kg, oral). d FNC-TP levels in tissues (5 mg/kg, oral). e FNC and its phosphate metabolites (FNC-MP, FNC-DP, and FNC-TP) in the thymus (5 mg/kg). f FNC and its phosphate metabolites in PBMCs (5 mg/kg). ND not detectable
Fig. 3
Fig. 3
FNC inhibited SARS-CoV-2 and treated COVID-19 in vivo. Eight RM monkeys were inoculated with SARS-CoV-2, followed by vehicle or FNC treatment 12 h post infection and continued for 7 days (see Materials and methods). Viral load, hematology, immunology, blood biochemical, and histological evaluation were conducted at the indicated time points. a FNC significantly reduced viral load in nasal swabs, blood, as well as in lungs and thymus. b Representative images of multi-color immunofluorescent staining for ACE2 (red), S protein (green) and N protein (white) in lung tissues of RM monkeys inoculated with SARS-CoV-2, treated or untreated with FNC. The regions of interest (ROI) are boxed in white, and their magnified photos are shown below. Scale bars, 500 µm (up) and 20 µm (below). c White blood cells (WBC), neutrophil granulocytes (NG), monocytes (MC), and platelets basically remained stable by FNC after SARS-CoV-2 infection. d FNC increased the percent of lymphocytes, alleviated CRP production, and protected the heart and liver functions. Data are presented as mean ± SEM (n = 4); *p < 0.05, infected monkeys in FNC group vs. infected monkeys in the untreated group, by Mann–Whitney U test. CRP C reaction protein, AST aspartate aminotransferase
Fig. 4
Fig. 4
FNC protected lung from SARS-CoV-2 infection. a left. FNC reduced petechial spots (red circle) in lung of virus (+) monkeys. a right. Chest X-ray images clearly showed the ground-glass shadows or light shadows in the untreated monkeys (red circle), but much less in the FNC-treated virus (+) monkeys. b HE staining of the lung tissues was done and evaluated. Lesions in the lung of the untreated virus (+) monkeys included interstitial infiltration of neutrocytes or monocytes or macrophage, thickening of alveolar septae and vessel wall, blood effusion, edema, and fibrin with hyaline membranes as well as damage in cell structures (see green arrows); treating the monkeys with FNC substantially reduced the lesion described above
Fig. 5
Fig. 5
FNC-protected thymus from the damage by SARS-CoV-2 infection. By the end of the experiment, the RM monkeys have practiced euthanasia, and the thymus samples were collected. a The representative images of the multi-color immunofluorescent staining were for ACE2 (red) and S protein (green) in the thymus of the RM monkeys that were inoculated with SARS-CoV-2 and treated or untreated with FNC. The regions of interest (ROI) are boxed in white, and their magnified photos are shown in the middle, with a decomposition diagram on the right. Scale bars, 200 µm (left) and 20 µm (middle and right). b Representative images of tissue flow cytometry analysis, using Tissue FAXS platform and Tissue Quest software (Tissue Gnostics), showed that S-protein positive cells were decreased by FNC. c Statistical results of ACE2 and S-protein positive cells in the thymus of the FNC-treated group and the untreated one (n = 4 for each group) showed that FNC significantly reduced the cells infected with SARS-CoV-2. d FNC alleviated infiltration, effusion, and structure damage (white arrows) in the thymus of the FNC-treated virus (+) monkeys. The regions of interest (ROI) are boxed in white, and their magnified photos are shown below. Data are presented as mean ± SEM (n = 4), *p < 0.05, FNC-treated group vs. untreated group, by Mann–Whitney U test
Fig. 6
Fig. 6
FNC improves the profile of immune cells in RM monkey. The droplet-based scRNA-seq (10Χ Genomics) was performed to characterize the immune cell features in the thymus of RM monkeys inoculated with SARS-CoV-2, untreated (#17041) or treated (#17368) with FNC. a Through analysis of 27,751 single cells from the thymus samples of monkey #17,041 (untreated) and #17,368 (treated with FNC), 7 clusters with the respective labels were identified. Each colored dot represents a single cell, according to cell type. b Expression of selected canonical cell markers in the 7 clusters showing with violin images. Columns represent clusters and rows represent selected marker genes. c The clusters were labeled by canonical cell gene markers (blue dots). d Proportion of each cell type from samples of untreated (up) and FNC treated monkey (bottom). e The representative images of multi-color immunofluorescent staining were for CD3 (red) and CD20 (white) protein in the thymus from monkey 17,041 (untreated) and 17,368 (FNC treated). The regions of interest (ROI) are boxed in white (up left), and their magnified photos are shown in the upright. The bottom left is for CD3+ cells, and the bottom right is for CD20+ cells. f The representative images of multi-color immunofluorescent staining was for CD3 (green), CD4 (red), and CD8 (purple) protein in the thymus of virus (+) monkeys treated or untreated with FNC. The regions of interest (ROI) are boxed in white (up left), and their magnified photos are shown in the upright. Bottom left is for CD3+/CD4+ cells, and the bottom right is for CD3+/CD8+ cells. g Relative proportion and absolute numbers of CD3+ cells (up) and CD20+ cells (down) in thymus from the virus (+) monkeys, treated with or without FNC (n = 4 for each group). Cells of a given phenotype were identified and quantitated using the Tissue Quest software (Tissue Gnostics). h Relative proportion and absolute numbers of CD3+/CD4+ cells (up) and CD3+/CD8+ cells (down) in thymus from virus (+) monkeys, treated with or without FNC. Cells of a given phenotype were also analyzed using the Tissue Quest software (Tissue Gnostics). i Representative flow cytometry analysis of CD3+/CD20+ cells (up) and CD4+/CD8+ cells (down) in PBMC samples from #17,041 and #17,368 at indicated time points. j FNC increased the % of CD3+, CD4+, and CD8+ cells in PBMC of the virus-infected monkeys, measured with flow cytometer at indicated time points. Data are presented as mean ± SEM (n = 4); *p < 0.05, infected monkeys in FNC group vs. those in the untreated group, by Mann–Whitney U test. Scale bars for e and f 200 µm (up left) and 20 µm (upright, bottom left and bottom right)
Fig. 7
Fig. 7
FNC protects the function of the thymus in the virally infected RM monkeys. The droplet-based scRNA-seq (10× Genomics) was performed to characterize the immunological features in the thymus of the SARS-CoV-2(+) RM monkeys, treated or untreated with FNC. a The top 30 enriched Gene Ontology (GO) biological process terms in the subset of CD4, CD8, and monocyte are shown. GO terms are labeled with name and ID, and the red-to-blue color indicates the level of p values. Interesting terms are labeled in green. b Histogram of expression levels of the GO biological process terms, including T-cell activation, T-cell activation involved in immune response, innate immune response, and positive regulation of immune system process, in each subset cells from the infected RM monkeys, treated or untreated with FNC. Horizontal lines represent median values, and the statistical analysis is shown at the top of each figure. Light blue box: untreated (#17041); pink box: FNC treated (#17368). c Histogram of expression levels of GO biological process terms related to response to the virus in each cell subset. Horizontal lines represent median values, and the statistical analysis is shown at the top of each figure. Blue box: untreated (#17041); green box: FNC treated (#17368). d Histogram of expression levels of GO biological process terms related to IL4, IL10, IL13 biosynthesis, and Th17 lineage commitment in each subset cells. Horizontal lines represent median values, and the statistical analysis is shown at the top of each figure. Blue box: untreated (#17041); green box: FNC treated (#17368). e Representative images of immunofluorescent staining of RORγt, IL10, IL13, and IL4 in thymus samples. The regions of interest (ROI) are boxed in white (up), and their magnified photos are shown below. Scale bars, 100 µm (up) and 20 µm (down). p Value was analyzed by Mann–Whitney U test

Similar articles

Cited by

References

    1. Chen Y, Liu Q, Guo D. Emerging coronaviruses: genome structure, replication, and pathogenesis. J. Med. Virol. 2020;92:418–423. - PMC - PubMed
    1. Lu R, et al. Genomic characterisation and epidemiology of 2019 novel coronavirus: implications for virus origins and receptor binding. Lancet. 2020;395:565–574. - PMC - PubMed
    1. Zhou P, et al. A pneumonia outbreak associated with a new coronavirus of probable bat origin. Nature. 2020;579:270–273. - PMC - PubMed
    1. Guan W-J, et al. Clinical characteristics of coronavirus disease 2019 in China. N. Engl. J. Med. 2020;382:1708–1720. - PMC - PubMed
    1. Zhou F, et al. Clinical course and risk factors for mortality of adult inpatients with COVID-19 in Wuhan, China: a retrospective cohort study. Lancet. 2020;395:1054–1062. - PMC - PubMed

Publication types