. 2021 Dec 6;12(1):7082.
doi: 10.1038/s41467-021-27315-3.

Monitoring the binding and insertion of a single transmembrane protein by an insertase

Affiliations

Monitoring the binding and insertion of a single transmembrane protein by an insertase

Pawel R Laskowski et al. Nat Commun. .

Abstract

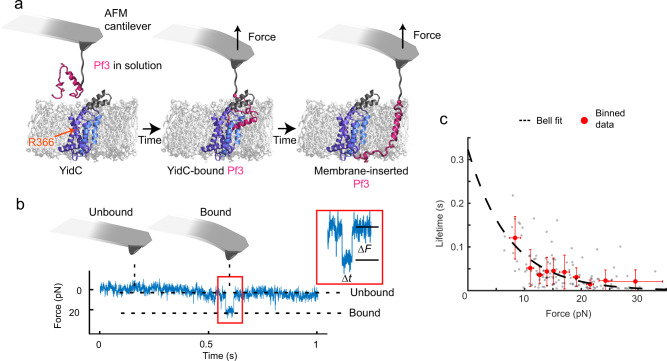
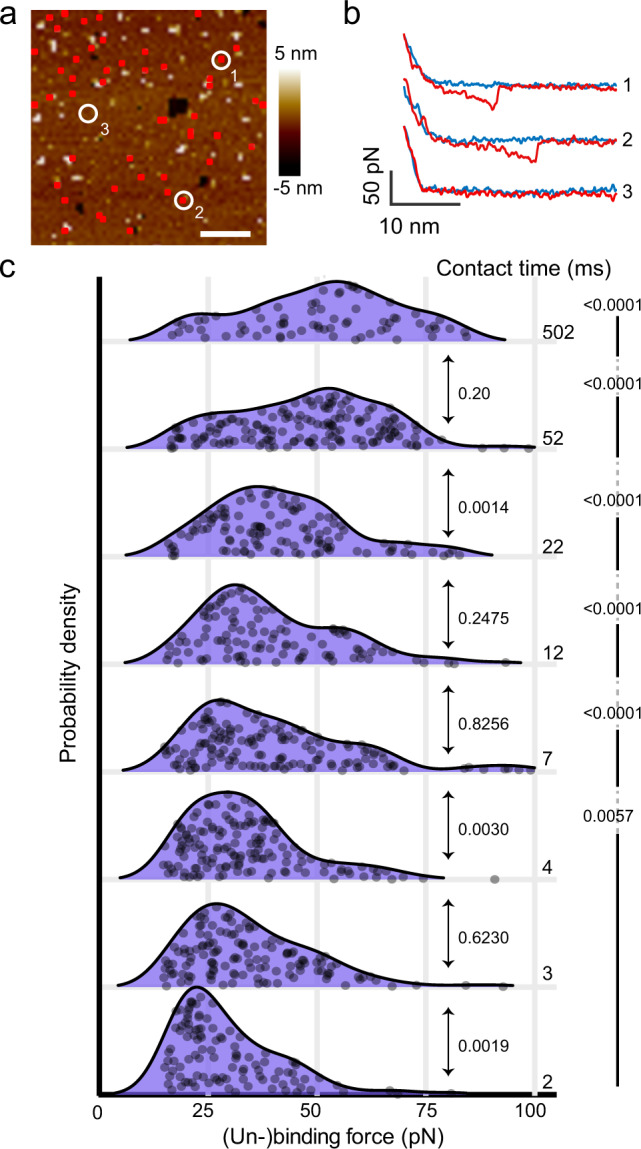
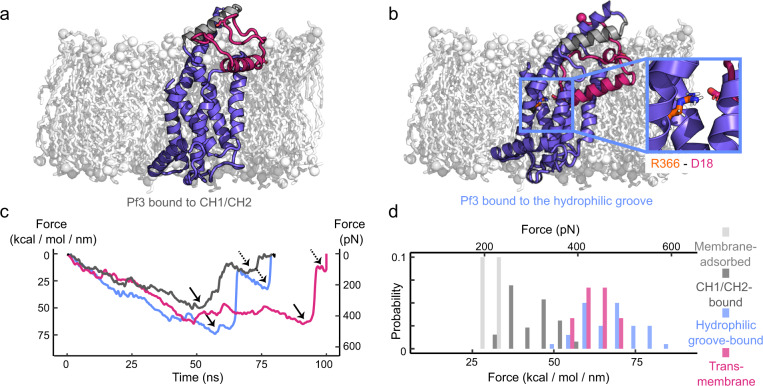
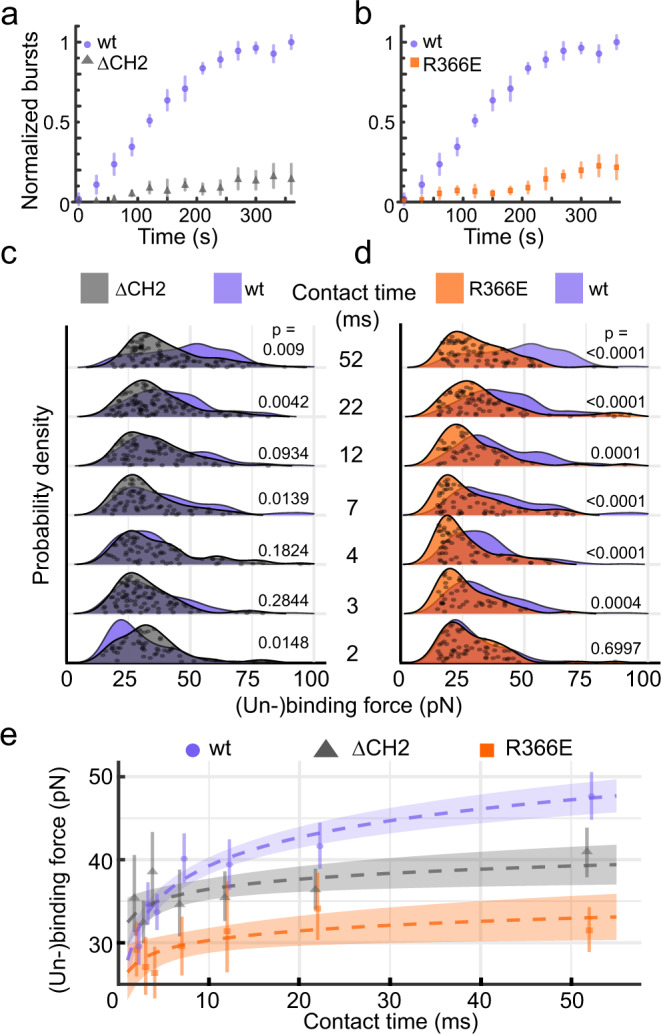
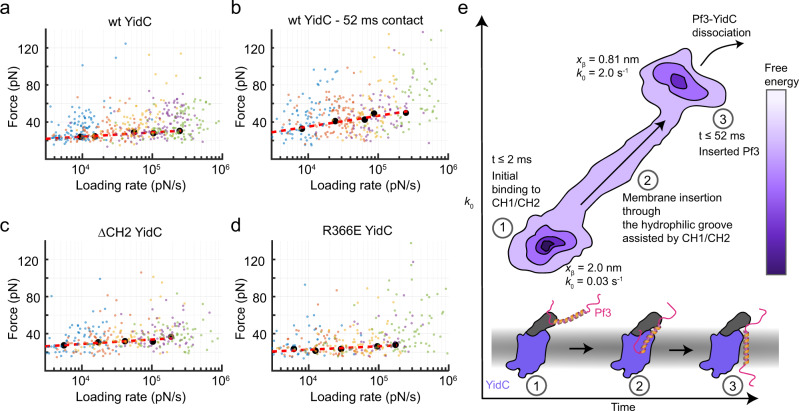
Cells employ highly conserved families of insertases and translocases to insert and fold proteins into membranes. How insertases insert and fold membrane proteins is not fully known. To investigate how the bacterial insertase YidC facilitates this process, we here combine single-molecule force spectroscopy and fluorescence spectroscopy approaches, and molecular dynamics simulations. We observe that within 2 ms, the cytoplasmic α-helical hairpin of YidC binds the polypeptide of the membrane protein Pf3 at high conformational variability and kinetic stability. Within 52 ms, YidC strengthens its binding to the substrate and uses the cytoplasmic α-helical hairpin domain and hydrophilic groove to transfer Pf3 to the membrane-inserted, folded state. In this inserted state, Pf3 exposes low conformational variability such as typical for transmembrane α-helical proteins. The presence of YidC homologues in all domains of life gives our mechanistic insight into insertase-mediated membrane protein binding and insertion general relevance for membrane protein biogenesis.


Conflict of interest statement

The authors declare no competing interests.

Figures

Fig. 1
Fig. 1. Spontaneous binding events of single Pf3 to wild-type (wt) YidC reveal life time and transition state.
a Schematic setup to detect interactions of YidC with Pf3 using AFM-based SMFS. Using AFM in the height clamp mode, the Pf3 polypeptide, which C-terminal end has been covalently tethered to the tip of the AFM cantilever (Supplementary Fig. 2), is kept in close proximity of ≈5–10 nm to a YidC containing membrane. If Pf3 (red) binds to YidC and/or inserts into the membrane the PEG27-linker tethering Pf3 to the tip stretches and the cantilever bends, thus detecting an interaction force. Highlighted structural regions of YidC are R366 (orange arrow), TMH3 and TMH5 (blue), and cytoplasmic α-helical hairpin (grey). b Example of a FT curve detecting a binding event of Pf3 to YidC. The force (∆F) and time (∆t) of single binding events (inset) is extracted for analysis. c Analyzing the lifetime of single YidC-Pf3 binding events. Grey dots show individual data points (n = 134, where n represents the number of binding events quantified) which were binned (red data points) and fitted with the Bell model (black dashed line) to extract the lifetime of the bond in the absence of an external force (e.g., at thermal equilibrium) to be t0 = 0.32 ± 0.25 s (±95% confidence interval (CI)) and the transition state xβ = 0.57 ± 0.27 nm (±95% CI) of the bond, which describes the distance Pf3 has to be pulled to separate from YidC. Error bars represent sd, which are centered at the mean value for each bin. Source data are provided as a Source Data file.
Fig. 2
Fig. 2. Binding of the YidC insertase to the Pf3 coat protein increases strength with time and saturates at 52 ms.
a FD-AFM topography of YidC reconstituted in phospholipid membranes. The topography has been recorded with an AFM tip that has been functionalized with Pf3 (Supplementary Fig. 2) to detect specific binding events to YidC. Red pixels show single binding events detected in the SMFS mode simultaneously conducted while recording the FD-AFM topography (n > 5, where n represents the number of independent experiments). Scale bar, 200 nm. b Representative approach (blue) and retraction (red) FD curves as recorded for every pixel of the FD-AFM topography (a). Occasionally retraction FD curves detected single adhesion events at tip-membrane distances corresponding to the length of the PEG27-linker that tethers the Pf3 polypeptide to the AFM tip. Shown are FD curves recording single (un-)binding events (top two) and no binding (bottom) of the Pf3 functionalized AFM tip with the YidC membrane. c Force profiles describing the (un-)binding of YidC and Pf3. With increasing contact time YidC strengthens binding to Pf3, which saturates at ≥52 ms. Numbers between force profiles depict P-values as calculated with a two sided Mann–Whitney U test between adjacent contact times (arrows) and relative to the 2 ms data set (right line). The (un-)binding force profiles were extracted from at least five independent experiments each detecting on average 15 single (un-)binding events of Pf3 and YidC. Grey dots show the raw data, individual (un-)binding forces (n ranging from 69 to 158 data points) from which the probability density functions (lines and purple shaded areas) have been constructed. For a better display the data points of the (un-)binding forces have been randomly scattered along the y-axis. Source data are provided as a Source Data file.
Fig. 3
Fig. 3. MD simulations reveal (un-)binding forces to depend on whether YidC binds the Pf3 polypeptide with the cytoplasmic α-helical hairpin or hydrophilic groove.
a MD simulation showing the cytoplasmic α-helices CH1 and CH2 (grey) of YidC to bind Pf3 (red). b MD simulation showing the hydrophilic groove (blue box) of YidC to bind Pf3 (red). The inset shows a salt bridge formed between R366 of YidC and D18 of Pf3. The highlighted interaction was observed in three out of five MD simulations. c Exemplary FT curves recorded upon mechanically separating Pf3 bound to YidC as revealed from steered MD simulations. FT curves describe the (un-)binding of Pf3 from CH1 and CH2 (dark grey), from the hydrophilic groove (blue), and the extraction of Pf3 from a membrane (red). Solid arrows indicate maximum (un-)binding forces and dashed arrows subsequently occurring weaker (un-)binding events. All FT curves are shown in Supplementary Figs. 7–10. d Distribution of maximum (un-)binding forces measuring the separation of Pf3 from CH1 and CH2 (dark grey, 287.2 ± 47.4 pN (mean ± sd), n = 26), from the hydrophilic groove (blue, 470.4 ± 57.9 pN, n = 40), and the extraction of Pf3 from the membrane (red, 439.8 ± 39.0 pN, n = 6). Reference maximum forces measure the separation of Pf3 adsorbed to phospholipid membranes (light grey, 223.0 ± 16.0 pN, n = 6, where n refers to the number of quantified binding events. Snapshots along a typical FT curve are shown in Supplementary Fig. 9 with the pulling process being visualized in Supplementary Movie 1. Source data are provided as a Source Data file.
Fig. 4
Fig. 4. YidC mutated in the cytoplasmic region or hydrophilic groove binds Pf3 with different forces.
a, b Pf3 insertion into mutant ΔCH2 YidC (grey) or mutant R366E YidC (orange) and wt (purple) YidC proteoliposomes as measured by FCS. The Atto520 dye attached to the N-terminal end of Pf3 is quenched outside proteoliposomes and bursts fluorescence upon translocation via YidC into proteoliposomes. Data points represent means from 35 measurements and error bars sd. c, d (Un-)binding forces of ΔCH2 YidC (grey) or R366E YidC (orange) and the Pf3 polypeptide as detected by FD-AFM at different contact times (grey). Overlaid are (un-)binding forces of wt YidC and Pf3 (purple). Grey dots show data points from which the probability density functions (lines and shaded areas) were constructed. For better display data points were randomly scattered along the y-axis. Probability density functions from wt YidC were taken from Fig. 2c. Force–distance curves showing single unbinding events from either wt YidC, mutant ∆CH2 YidC or mutant R366E YidC are exemplified in Supplementary Fig. 16. e Multivariate linear regression (dashed lines) of wt (purple), R366E (orange) and ΔCH2 (grey) YidC built on the mean (un-)binding forces (dashed lines) of Pf3. The y-intercept equals 27.9 ± 2.2 pN (±95% CI), 32.5 ± 2.9 pN, and 26.5 ± 3.3 pN for wt, ΔCH2, and R366E YidC, respectively. Slopes of the (un-)binding forces equal 4.94 ± 0.91 pN s–1, 1.74 ± 1.48 pN s–1 and 1.66 ± 1.61 pN s–1 for wt, ΔCH2 and R366E YidC, respectively. Circular, triangle and square data points give means (wt YidC, nevents = 899; mutant R366E YidC, nevents = 408; mutant ΔCH2 YidC, nevents = 556) for each contact time. Shaded areas indicate 95% CI and error bars represent 95% CI of the means. Force distributions were statistically compared with a two-sided Mann–Whitney U-test showing P-values for each compared condition. Mean (un-)binding forces are summarized in Supplementary Table 1. Source data are provided as a Source Data file.
Fig. 5
Fig. 5. Free-energy landscape of YidC binding Pf3.
a (Un-)binding forces of wt YidC and Pf3 plotted against the loading rate. Data points represent single (un-)binding forces collected with SMFS at 2 ms contact time. b (Un-)binding forces of wt YidC and Pf3 collected at 52 ms contact time. c (Un-)binding forces of ∆CH2 YidC and Pf3 at 2 ms contact times. d (Un-)binding forces of R366E YidC and Pf3 at 2 ms contact time. Small dots represent single (un-)binding forces detected at pulling velocities of 1 µm s–1 (blue), 3.1 µm s–1 (orange), 6.3 µm s–1 (yellow), 12.5 µm s–1 (purple), and 25 µm s–1 (green). Black larger dots represent most probable (un-)binding forces (Supplementary Fig. 14) and most probable loading rates calculated for each velocity using kernel density estimation. Bins were iteratively fitted using the Bell-Evans model (dashed line) to estimate free-energy landscape parameters (Table 1). Each experiment was repeated at least five independent times. Total numbers of (un-)binding events in each plot for wt YidC were nevents = 460 (2 ms) and nevents = 372 (52 ms), for R366E YidC nevents = 311, and for ∆CH2 YidC nevents = 322. e Schematic free-energy landscape of YidC-mediated Pf3 binding and membrane insertion. The structural model at the bottom summarizes the mechanistic insight revealed in this study. YidC with its cytoplasmic α-helices are colored purple and grey, respectively. Pf3 is colored red and orange. Within 2 ms Pf3 binds to the cytoplasmic YidC surface in diverse conformations (1). Then within 52 ms, Pf3 migrates along multiple pathways (2), which involve the hydrophilic groove of YidC, to reach the membrane-inserted state (3). After these binding and insertion steps, the Pf3 polypeptide can dissociate from YidC. Source data are provided as a Source Data file.

Similar articles

Cited by

References

    1. Cymer F, von Heijne G, White SH. Mechanisms of integral membrane protein insertion and folding. J. Mol. Biol. 2015;427:999–1022. - PMC - PubMed
    1. Pugsley AP, Francetic O, Driessen AJ, de Lorenzo V. Getting out: protein traffic in prokaryotes. Mol. Microbiol. 2004;52:3–11. - PubMed
    1. Preuss M, Ott M, Funes S, Luirink J, Herrmann JM. Evolution of mitochondrial oxa proteins from bacterial YidC. Inherited and acquired functions of a conserved protein insertion machinery. J. Biol. Chem. 2005;280:13004–13011. - PubMed
    1. Driessen AJM, Nouwen N. Protein translocation across the bacterial cytoplasmic membrane. Annu. Rev. Biochem. 2008;77:643–667. - PubMed
    1. Serdiuk T, et al. Insertion and folding pathways of single membrane proteins guided by translocases and insertases. Sci. Adv. 2019;5:eaau6824. - PMC - PubMed

Publication types

MeSH terms

Substances

LinkOut - more resources