. 2021 Dec 6;12(1):7041.
doi: 10.1038/s41467-021-27349-7.

Glucocorticoid receptor regulates PD-L1 and MHC-I in pancreatic cancer cells to promote immune evasion and immunotherapy resistance

Affiliations

Glucocorticoid receptor regulates PD-L1 and MHC-I in pancreatic cancer cells to promote immune evasion and immunotherapy resistance

Yalan Deng et al. Nat Commun. .

Abstract

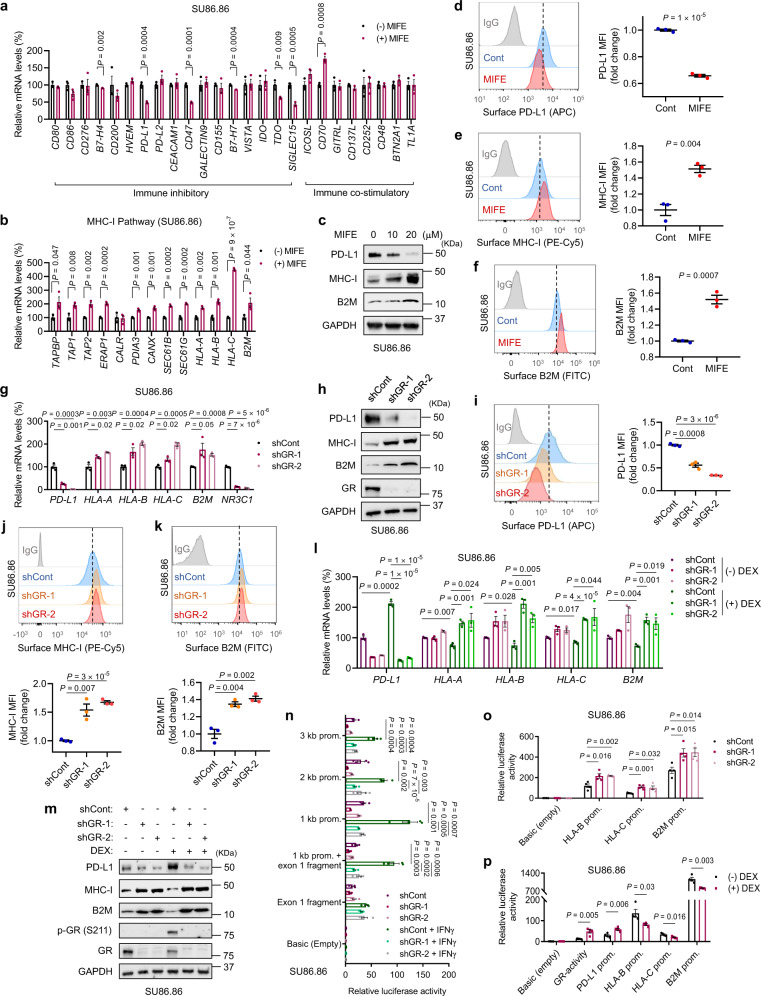
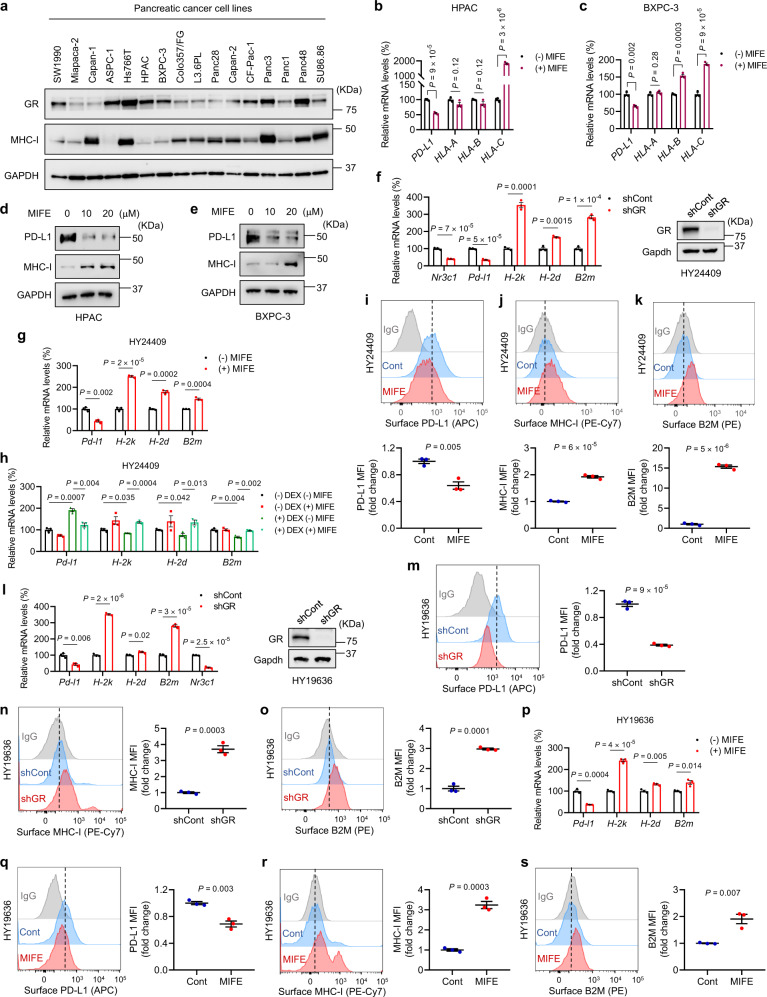
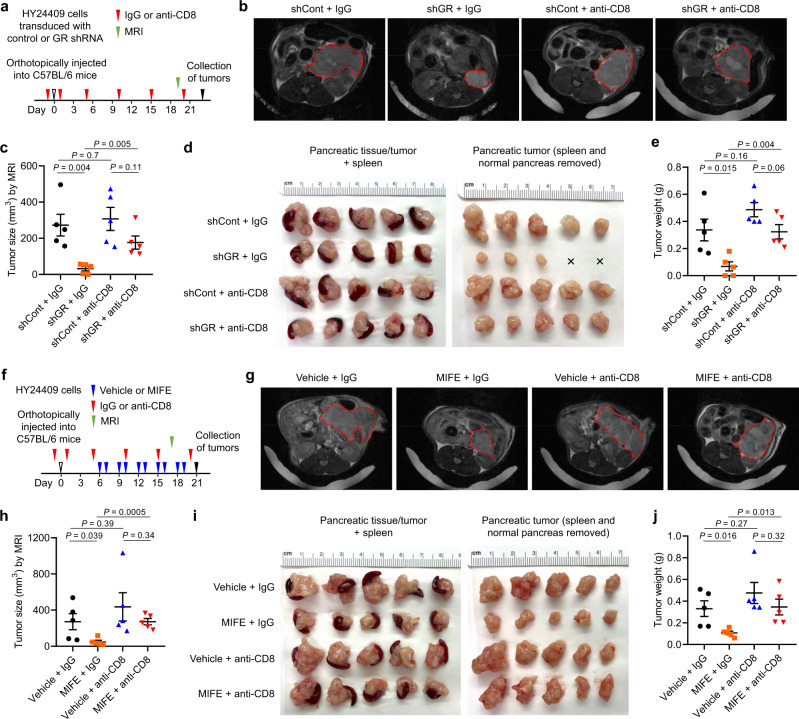
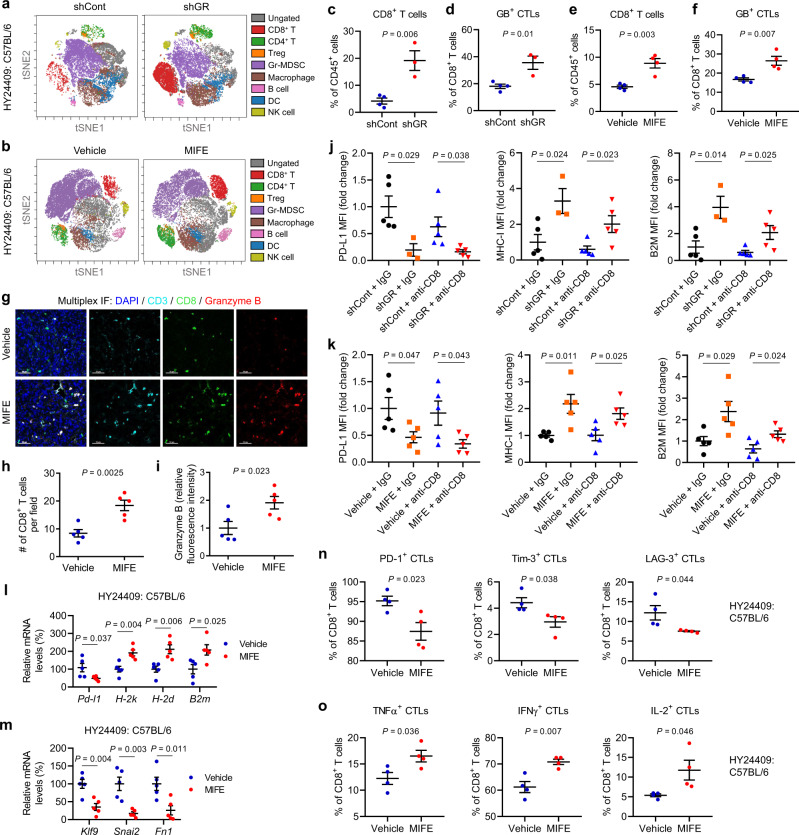
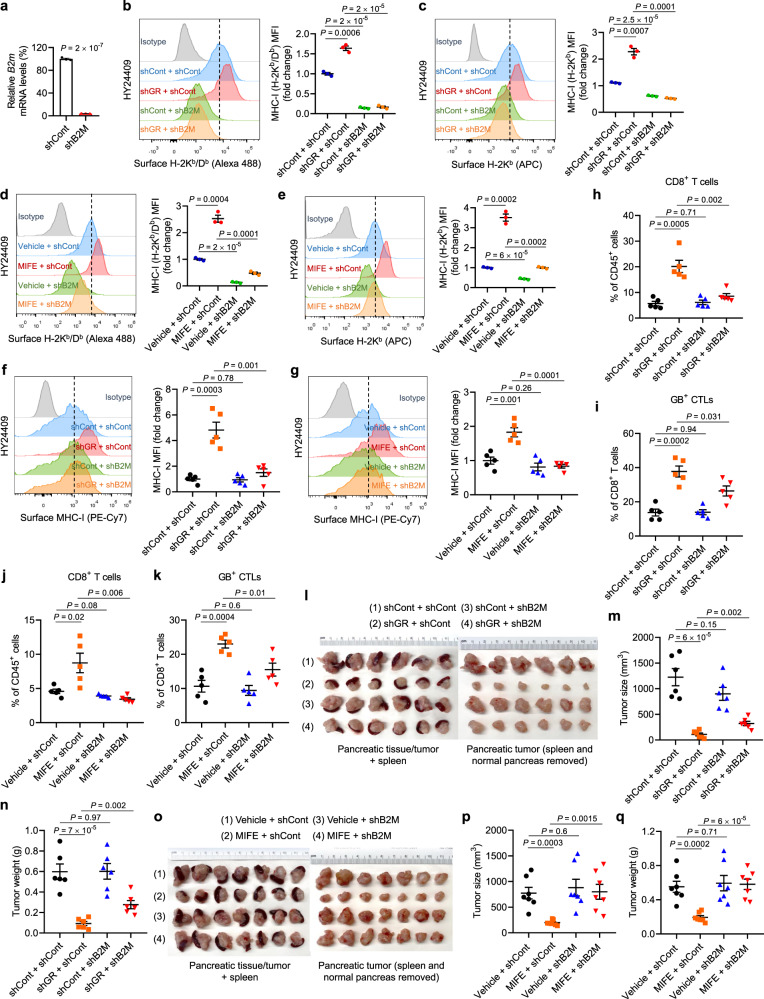
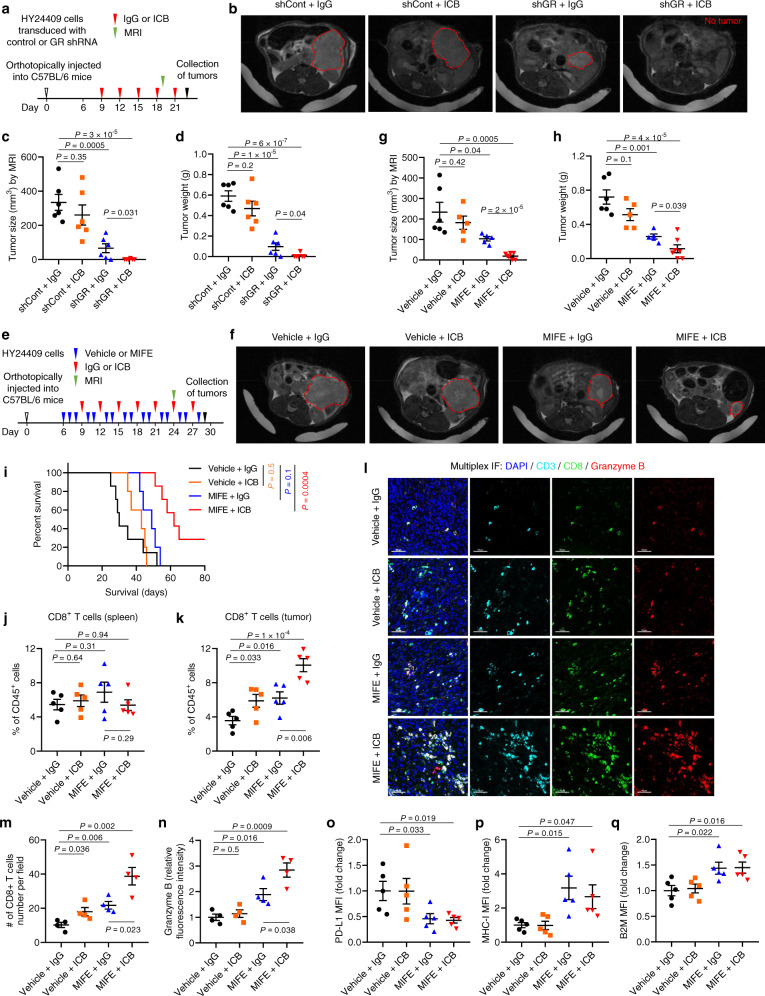
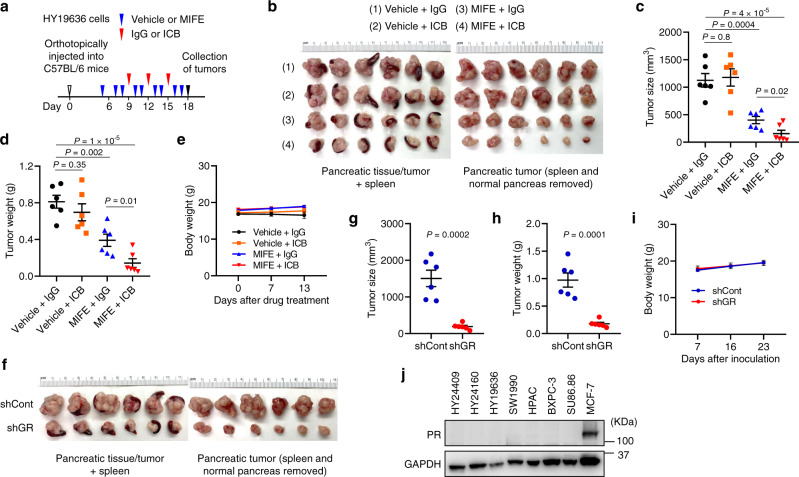
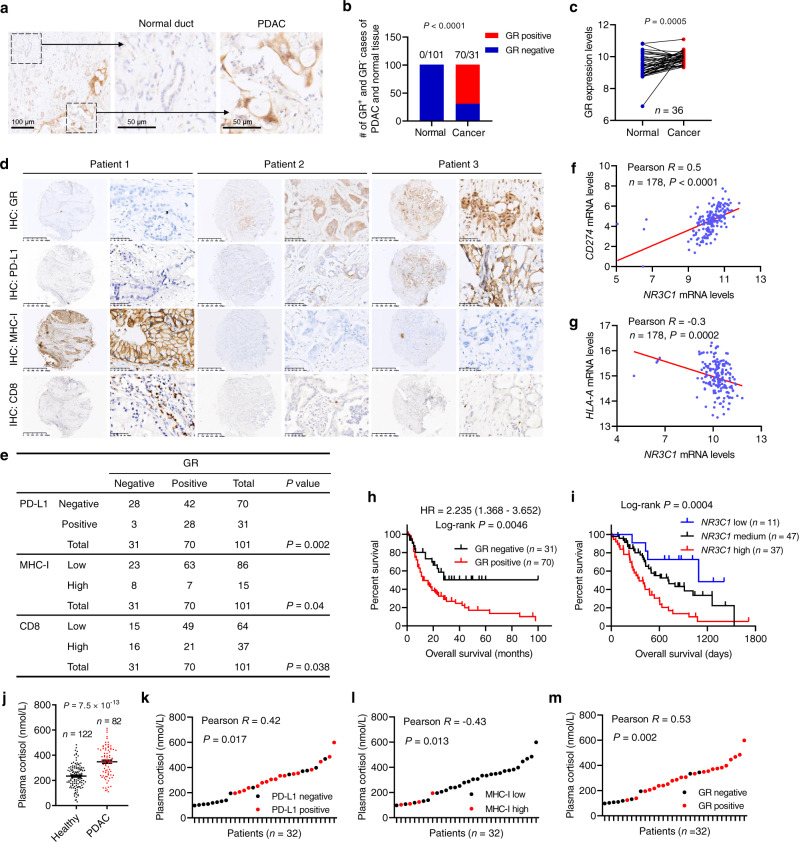
Despite unprecedented responses of some cancers to immune checkpoint blockade (ICB) therapies, the application of checkpoint inhibitors in pancreatic cancer has been unsuccessful. Glucocorticoids and glucocorticoid receptor (GR) signaling are long thought to suppress immunity by acting on immune cells. Here we demonstrate a previously undescribed tumor cell-intrinsic role for GR in activating PD-L1 expression and repressing the major histocompatibility complex class I (MHC-I) expression in pancreatic ductal adenocarcinoma (PDAC) cells through transcriptional regulation. In mouse models of PDAC, either tumor cell-specific depletion or pharmacologic inhibition of GR leads to PD-L1 downregulation and MHC-I upregulation in tumor cells, which in turn promotes the infiltration and activity of cytotoxic T cells, enhances anti-tumor immunity, and overcomes resistance to ICB therapy. In patients with PDAC, GR expression correlates with high PD-L1 expression, low MHC-I expression, and poor survival. Our results reveal GR signaling in cancer cells as a tumor-intrinsic mechanism of immunosuppression and suggest that therapeutic targeting of GR is a promising way to sensitize pancreatic cancer to immunotherapy.


Conflict of interest statement

The authors declare no competing interests.

Figures

Fig. 1
Fig. 1. GR activates PD-L1 expression and represses MHC-I expression in human pancreatic cancer cells.
a, b qPCR analysis of immune inhibitory and immune co-stimulatory genes (a) and genes involved in the MHC-I pathway (b) in SU86.86 cells with or without mifepristone (MIFE, 20 μM, 72 h) treatment. n = 3 technical replicates. c Immunoblotting of PD-L1, MHC-I, and B2M in SU86.86 cells with or without MIFE treatment with the indicated doses for 72 h. df Representative flow cytometry plots and quantification (by MFI: mean fluorescence intensity) of cell-surface PD-L1 (d), MHC-I (e), and B2M (f) in SU86.86 cells with or without MIFE (20 μM, 72 h) treatment. n = 3 biological replicates. g qPCR analysis of PD-L1, HLA-A, HLA-B, HLA-C, B2M, and NR3C1 in GR-knockdown SU86.86 cells. n = 3 technical replicates. h, Immunoblotting of PD-L1, MHC-I, B2M, and GR in GR-knockdown SU86.86 cells. ik Representative flow cytometry plots and quantification of cell-surface PD-L1 (i), MHC-I (j), and B2M (k) in GR-knockdown SU86.86 cells. n = 3 biological replicates. l qPCR analysis of PD-L1, HLA-A, HLA-B, HLA-C, and B2M in GR-knockdown SU86.86 cells, with or without dexamethasone (DEX, 100 nM, 8 h) treatment. n = 3 technical replicates. m Immunoblotting of PD-L1, MHC-I, B2M, p-GR (Ser211), and GR in GR-knockdown SU86.86 cells, with or without dexamethasone (DEX, 100 nM, 8 h) treatment. n Normalized luciferase activity of the reporters containing the indicated human PD-L1 gene promoter regions in GR-knockdown SU86.86 cells, with or without IFNγ (10 ng ml−1, 8 h) treatment. n = 4 wells. o Normalized luciferase activity of the reporters containing the indicated human HLA-B, HLA-C, and B2M gene promoter regions in GR-knockdown SU86.86 cells. n = 4 wells. p Normalized luciferase activity of the reporters containing the human GR-binding elements, PD-L1, HLA-B, HLA-C, and B2M promoter regions in SU86.86 cells with or without DEX (100 nM, 8 h) treatment. n = 4 wells. Statistical significance in a, b, dg, il, and np was determined by a two-tailed unpaired t-test. Error bars are s.e.m. Source data are provided as a Source Data file.
Fig. 2
Fig. 2. Modulation of PD-L1 and MHC-I by GR is a common regulatory mechanism in PDAC cells.
a Immunoblotting of GR, MHC-I, and GAPDH in human PDAC cell lines. b, c qPCR analysis of PD-L1, HLA-A, HLA-B, and HLA-C in HPAC (b) and BXPC-3 (c) cells with or without MIFE (20 μM, 72 h) treatment. n = 3 technical replicates. d, e Immunoblotting of PD-L1, MHC-I, and GAPDH in HPAC (d) and BXPC-3 (e) cells with or without MIFE treatment with the indicated doses for 72 h. f Left panel: qPCR analysis of Nr3c1, Pd-l1, H-2k, H-2d, and B2m in GR-knockdown HY24409 cells. Right panel: immunoblotting of GR and Gapdh in GR-knockdown HY24409 cells. g qPCR analysis of Pd-l1, H-2k, H-2d, and B2m in HY24409 cells with or without MIFE (20 μM, 48 h) treatment. h qPCR analysis of Pd-l1, H-2k, H-2d, and B2m in HY24409 cells treated with DEX (100 nM, 4 h) and MIFE (100 nM, 4 h), alone or in combination. n = 3 technical replicates in fh. ik Representative flow cytometry plots and quantification of cell-surface PD-L1 (i), MHC-I (j), and B2M (k) in HY24409 cells with or without MIFE (20 μM, 48 h) treatment. n = 3 biological replicates. l Left panel: qPCR analysis of Pd-l1, H-2k, H-2d, B2m, and Nr3c1 in GR-knockdown HY19636 cells. n = 3 technical replicates. Right panel: immunoblotting of GR and Gapdh in GR-knockdown HY19636 cells. mo Representative flow cytometry plots and quantification of cell-surface PD-L1 (m), MHC-I (n), and B2M (o) in GR-knockdown HY19636 cells. n = 3 biological replicates. p qPCR analysis of Pd-l1, H-2k, H-2d, and B2m in HY19636 cells with or without MIFE (20 μM, 48 h) treatment. n = 3 technical replicates. qs Representative flow cytometry plots and quantification of cell-surface PD-L1 (q), MHC-I (r), and B2M (s) in HY19636 cells with or without MIFE (20 μM, 48 h) treatment. n = 3 biological replicates. Statistical significance in b, c, and fs was determined by a two-tailed unpaired t-test. Error bars are s.e.m. Source data are provided as a Source Data file.
Fig. 3
Fig. 3. Tumor cell-specific GR depletion or pharmacologic GR inhibition suppresses pancreatic tumor growth.
ae C57BL/6 mice bearing orthotopic pancreatic tumors (implanted with 8 × 104 luciferase-labeled HY24409 cells transduced with control shRNA or GR shRNA) received isotype control (IgG) or anti-CD8 antibody treatment. n = 5 mice. a Study design. MRI: magnetic resonance imaging. b, c Representative magnetic resonance images (b) and tumor size quantification (c) on day 19 after tumor cell implantation. d, Endpoint images of orthotopic HY24409 tumors expressing either control shRNA or GR shRNA, with or without CD8+ T cell depletion. e, Endpoint tumor weight. fj C57BL/6 mice bearing orthotopic pancreatic tumors (implanted with 8 × 104 luciferase-labeled HY24409 cells) received vehicle or mifepristone (MIFE) and isotype control (IgG) or anti-CD8 antibody treatment. n = 5 mice. f Study design. MRI: magnetic resonance imaging. g, h Representative magnetic resonance images (g) and tumor size quantification (h) on day 17 after tumor cell implantation. i Endpoint images of vehicle- and MIFE-treated orthotopic HY24409 tumors, with or without CD8+ T cell depletion. j Endpoint tumor weight. Statistical significance in c, e, h, and j was determined by a two-tailed unpaired t-test. Error bars are s.e.m. Source data are provided as a Source Data file.
Fig. 4
Fig. 4. Tumor cell-specific GR depletion or pharmacologic GR inhibition promotes anti-tumor immunity in PDAC.
a, b CyTOF-based immune profiling of orthotopic HY24409 tumors expressing control shRNA or GR shRNA (a), and of vehicle- and MIFE-treated orthotopic HY24409 tumors (b). Representative viSNE plots were colored by immune cell populations. c, d Quantification of CD8+ T cells (c) and granzyme B (GB)+ CTLs (d) in orthotopic HY24409 tumors expressing control shRNA (n = 4 mice) or GR shRNA (n = 3 mice). e, f Quantification of CD8+ T cells (e) and granzyme B (GB)+ CTLs (f) in vehicle- and MIFE-treated orthotopic HY24409 tumors. n = 4 mice. gi Multiplex immunofluorescent staining of CD3, CD8, and granzyme B in vehicle- and MIFE-treated orthotopic HY24409 tumors (g), and quantification of CD8 (h) and granzyme B (i) signals. Scale bars, 50 μm. n = 5 mice. j Flow cytometric analysis of cell-surface PD-L1 (left), MHC-I (H-2Kb) (middle), and B2M (right) levels in cancer cells sorted from orthotopic HY24409 tumors expressing control shRNA or GR shRNA, with or without CD8+ T cell depletion. n = 5, 3, 5, and 5 mice from left to right. k Flow cytometric analysis of cell-surface PD-L1 (left), MHC-I (H-2Kb) (middle), and B2M (right) levels in cancer cells sorted from vehicle- and MIFE-treated orthotopic HY24409 tumors, with or without CD8+ T cell depletion. n = 5 mice. l qPCR analysis of Pd-l1, H-2k, H-2d, and B2m in vehicle- and MIFE-treated orthotopic HY24409 tumors. n = 5 mice. m qPCR analysis of known GR-activated target genes in vehicle- and MIFE-treated orthotopic HY24409 tumors. n = 5 mice. n Quantification of PD-1+, Tim-3+, and LAG-3+ CTLs in vehicle- and MIFE-treated orthotopic HY24409 tumors. n = 4 mice. o Quantification of TNFα, IFNγ, and IL-2 expression in intratumoral CD8+ T cells from orthotopic HY24409 tumors, after ex vivo phorbol myristate acetate (PMA)/ionomycin stimulation. n = 4 mice. Statistical significance in cf and ho was determined by a two-tailed unpaired t-test. Error bars are s.e.m. Source data are provided as a Source Data file.
Fig. 5
Fig. 5. GR-mediated regulation of MHC-I is required for the anti-tumor effect of GR depletion or inhibition.
a qPCR analysis of B2m in HY24409 cells transduced with control shRNA or B2M shRNA. n = 3 technical replicates. b, c Representative flow cytometry plots and quantification (by MFI: mean fluorescence intensity) of cell-surface H-2Kb/Db (b) and H-2Kb (c) in HY24409 cells transduced with GR shRNA and B2M shRNA, alone or in combination. Cells were treated with IFNγ (10 ng ml−1, overnight). n = 3 biological replicates. d, e Representative flow cytometry plots and quantification of cell-surface H-2Kb/Db (d) and H-2Kb (e) in HY24409 cells transduced with control shRNA or B2M shRNA, with or without mifepristone (MIFE) treatment (20 μM, 48 h). Cells were treated with IFNγ (10 ng ml−1, overnight). n = 3 biological replicates. f, g Representative flow cytometry plots and quantification of cell-surface MHC-I (H-2Kb) in orthotopic HY24409 tumors of the indicated groups. n = 5 mice. hk Quantification of CD8+ T cells (h, j) and granzyme B (GB)+ CTLs (i, k) in orthotopic HY24409 tumors of the indicated groups. n = 5 mice. l, m Endpoint (22 days after inoculation) tumor images (l), tumor size (m), and tumor weight (n) of C57BL/6 mice bearing orthotopic pancreatic tumors. Mice were implanted with 8 × 104 luciferase-labeled HY24409 cells transduced with GR shRNA and B2M shRNA, alone or in combination. n = 6 mice. oq Endpoint (22 days after inoculation) tumor images (o), tumor size (p), and tumor weight (q) of C57BL/6 mice bearing orthotopic pancreatic tumors. Mice were implanted with 8 × 104 luciferase-labeled HY24409 cells transduced with control shRNA or B2M shRNA, and were treated with vehicle or mifepristone (MIFE) twice every 3 days. n = 7 mice. Statistical significance in ak, m, n, p, and q was determined by a two-tailed unpaired t-test. Error bars are s.e.m. Source data are provided as a Source Data file.
Fig. 6
Fig. 6. Tumor cell-specific GR depletion or pharmacologic GR inhibition sensitizes PDAC to immunotherapy in male mice.
ad C57BL/6 mice bearing orthotopic pancreatic tumors (implanted with 8 × 104 luciferase-labeled HY24409 cells transduced with control shRNA or GR shRNA) were treated with isotype control (IgG) or dual ICB (anti-PD1 and anti-CTLA-4 monoclonal antibodies). n = 6 mice. a Study design. MRI: magnetic resonance imaging. b, c Representative magnetic resonance images (b) and tumor size quantification (c) on day 19 after tumor cell implantation. d Endpoint tumor weight. eh C57BL/6 mice bearing orthotopic pancreatic tumors (implanted with 4 × 104 luciferase-labeled HY24409 cells) were treated with mifepristone (MIFE) and dual ICB, alone or in combination. n = 6, 5, 5, and 7 mice from left to right. e Study design. MRI: magnetic resonance imaging. f, g Representative magnetic resonance images (f) and tumor size quantification (g) on day 24 after tumor cell implantation. h Endpoint tumor weight. i Overall survival curves of HY24409 tumor-bearing C57BL/6 mice treated with mifepristone (MIFE) and dual ICB, alone or in combination. Statistical significance was determined by the log-rank test. n = 7, 5, 5, and 7 mice from left to right. jq Flow cytometric analysis and multiplex immunofluorescent staining of tissues (orthotopic HY24409 tumors or spleens) from C57BL/6 mice treated with mifepristone (MIFE) and dual ICB, alone or in combination. j, k Quantification of CD8+ T cells in the spleens (j) and pancreatic tumors (k) by flow cytometry. n = 5 mice. ln Multiplex immunofluorescent staining of CD3, CD8, and granzyme B in the tumors (l), and the quantification of CD8 (m) and granzyme B (n) signals. Scale bars, 50 μm. n = 4 mice. oq Flow cytometric analysis of cell-surface PD-L1 (o), MHC-I (H-2Kb) (p), and B2M (q) in tumor cells (gated by ZombieDyeCD45luciferase+). MFI: mean fluorescence intensity. n = 5 mice. Statistical significance in c, d, g, h, j, k, and mq was determined by a two-tailed unpaired t-test. Error bars are s.e.m. Source data are provided as a Source Data file.
Fig. 7
Fig. 7. Depletion or inhibition of GR suppresses pancreatic tumor growth and renders sensitivity to immunotherapy in female mice.
ae C57BL/6 mice bearing orthotopic pancreatic tumors (implanted with 4 × 104 RFP-labeled HY19636 cells) were treated with mifepristone (MIFE) and dual ICB (anti-PD1 and anti-CTLA-4 monoclonal antibodies), alone or in combination. n = 6 mice. a Study design. b Endpoint tumor images. c Endpoint tumor size. d Endpoint tumor weight. e Body weight. fi C57BL/6 mice were orthotopically implanted with 8 × 104 RFP-labeled HY19636 cells transduced with control shRNA or GR shRNA. n = 6 mice. f Endpoint tumor images. g Endpoint tumor size. h Endpoint tumor weight. i Body weight. j Immunoblotting of PR and GAPDH in the indicated mouse and human pancreatic cancer cell lines. The MCF-7 cell line was used as a positive control. Statistical significance in c, d, g, and h was determined by a two-tailed unpaired t-test. Error bars are s.e.m. Source data are provided as a Source Data file.
Fig. 8
Fig. 8. GR correlates with PD-L1 expression, low MHC-I expression, and poor survival in human PDAC.
a Representative immunohistochemical (IHC) staining of GR in the normal pancreatic duct and PDAC. Scale bars, 100 μm (left), 50 μm (middle), and 50 μm (right). b Quantification of GR-positive and GR-negative cases of PDAC and adjacent normal pancreatic tissue. n = 101 patients. Statistical significance was determined by a two-tailed Fisher’s exact test. c GR (encoded by NR3C1) mRNA levels in paired normal pancreatic tissue and PDAC based on the GSE15471 dataset. n = 36 patients. Statistical significance was determined by a two-tailed paired t-test. d, e Representative IHC staining (d) and statistical analysis (e) of the correlation of GR protein levels with PD-L1, MHC-I, and CD8 proteins levels in patients with PDAC. n = 101 patients. f, g Correlation of NR3C1 (encoding GR) mRNA levels with CD274 (encoding PD-L1; f) and HLA-A (g) mRNA levels in PDAC based on TCGA data. n = 178 patients. h Kaplan–Meier curves of overall survival of pancreatic cancer patients stratified by GR protein levels based on IHC. n = 101 patients. i Kaplan–Meier curves of overall survival of pancreatic patients stratified by GR (encoded by NR3C1) mRNA levels. Data were obtained from the ICGC (International Cancer Genome Consortium). n = 95 patients. Statistical significance was determined by the log-rank test in h and i. j Plasma cortisol levels in healthy volunteers (n = 122) and PDAC patients (n = 82). Statistical significance was determined by a two-tailed unpaired t-test. Error bars are s.e.m. km Correlation of plasma cortisol levels with PD-L1 (k), MHC-I (l), or GR (m) protein levels in pancreatic tumors. n = 32 patients. Statistical significance was determined by a two-tailed Pearson correlation test in eg and km. Source data are provided as a Source Data file.

Similar articles

Cited by

References

    1. Kamisawa T, Wood LD, Itoi T, Takaori K. Pancreatic cancer. Lancet. 2016;388:73–85. - PubMed
    1. McGuigan A, et al. Pancreatic cancer: a review of clinical diagnosis, epidemiology, treatment and outcomes. World J. Gastroenterol. 2018;24:4846–4861. - PMC - PubMed
    1. Von Hoff DD, et al. Increased survival in pancreatic cancer with nab-paclitaxel plus gemcitabine. New Engl. J. Med. 2013;369:1691–1703. - PMC - PubMed
    1. Conroy T, et al. FOLFIRINOX versus gemcitabine for metastatic pancreatic cancer. New Engl. J. Med. 2011;364:1817–1825. - PubMed
    1. Hong DS, et al. KRAS(G12C) inhibition with sotorasib in advanced solid tumors. New Engl. J. Med. 2020;383:1207–1217. - PMC - PubMed

Publication types

MeSH terms

Substances