. 2021 Dec 6;11(1):23429.
doi: 10.1038/s41598-021-02787-x.

Medium levels of transcription and replication related chromosomal instability are associated with poor clinical outcome

Affiliations

Medium levels of transcription and replication related chromosomal instability are associated with poor clinical outcome

Ataaillah Benhaddou et al. Sci Rep. .

Abstract

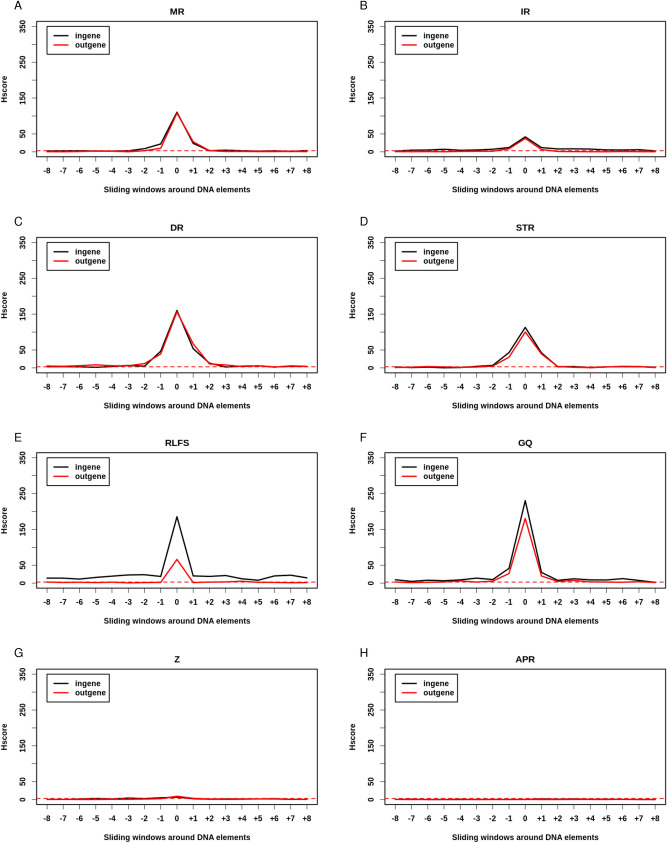
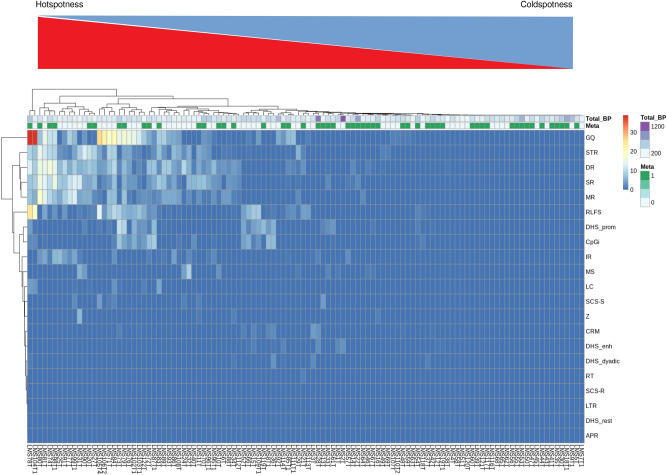
Genomic instability (GI) influences treatment efficacy and resistance, and an accurate measure of it is lacking. Current measures of GI are based on counts of specific structural variation (SV) and mutational signatures. Here, we present a holistic approach to measuring GI based on the quantification of the steady-state equilibrium between DNA damage and repair as assessed by the residual breakpoints (BP) remaining after repair, irrespective of SV type. We use the notion of Hscore, a BP "hotspotness" magnitude scale, to measure the propensity of genomic structural or functional DNA elements to break more than expected by chance. We then derived new measures of transcription- and replication-associated GI that we call iTRAC (transcription-associated chromosomal instability index) and iRACIN (replication-associated chromosomal instability index). We show that iTRAC and iRACIN are predictive of metastatic relapse in Leiomyosarcoma (LMS) and that they may be combined to form a new classifier called MAGIC (mixed transcription- and replication-associated genomic instability classifier). MAGIC outperforms the gold standards FNCLCC and CINSARC in stratifying metastatic risk in LMS. Furthermore, iTRAC stratifies chemotherapeutic response in LMS. We finally show that this approach is applicable to other cancers.


Conflict of interest statement

The authors declare that they have no conflict of interest. Request for Grant of a European patent has been submitted under the application number: EP20306558.6. the applicants are: Institut National de la Santé et de la Recherche Médicale, UNIVERSITÉ PAUL SABATIER TOULOUSE III, Benhaddou Ataaillah, and Institut Claudius Regaud. The inventors are not yet designated. The Extended european search report is closed. The application covers the aspects of the manuscript relating to hotspots detection, iTRAC and iRACIN indexes, and a method for stratification of clinical outcome based on those indexes.

Figures

Figure 1
Figure 1
Regulatory elements, non-B DNA (NBD) and DNA repeats are hotspots. (A) Random Breakage Model: hotspots are defined as DNA elements containing more BP than expected under RBM and more than surrounding regions. Hscore profile for DNA elements and sliding windows upstream and downstream for (B) Non-B DNA: R-Loops Forming Sequences (RLFS), a-Phased Repeats (APR), Direct Repeats (DR), G-quadruplex (GQ), Inverted Repeats (IR), Mirror Repeats (MR), Short Tandem Repeats (STR), Z-DNA (Z) and (C) DNA repeats: MicroSatellites (MS), Low Complexity DNA (LC), Simple Repeats (SR), Self-Chains Segements-self-aligned (SCS-S) Self-Chains Segements-Gaped (SCS-G), Long terminal repeats (LTR), RetroTransposons (RT), (D) regulatory elements: CpG islands (CpGi), Cis-Regulatory Modules (CRM), Dnase Hyper sensitive sites (DHS) of type dyadic (DHS_dyadic), Enhancer (DHS_enh), Promoter (DHS_prom), other types (DHS_rest). Horizontal red dashed line corresponds to Hscore threshold of 3 for hotspotness. (A) was drawn using LibreOffice Impress 1:6.0.7ubuntu0.18.04.10.
Figure 2
Figure 2
Regulatory elements are exclusively hot inside genes: Hscore for regulatory elements and sliding windows either inside (black) or outside genes (red). (A) Cis-Regulatory Modules (CRM). (B) CpG islands (CpGi). (C) DNase Hyper Sensitive sites (DHS) of type promoter. (D) DHS of type enhancer. (E) DHS of type dyadic. (F) DHS of other types. Horizontal red dashed line corresponds to Hscore threshold of 3 for hotspotness.
Figure 3
Figure 3
NBD are hotspots both inside and outside genes: Hscore for NBD and sliding windows either inside (black) or outside (red) genes. (A) Mirror Repeats (MR). (B) Inverted repeats (IR). (C) Direct Repeats (DR). (D) Short Tandem Repeats (STR). (E) R-loops forming sequences (RLFS). (F) G-quadruplex (GQ). (G) Z DNA (Z). (H) A-phased Repeats (APR). Horizontal red dashed line corresponds to Hscore threshold of 3 for hotspotness.
Figure 4
Figure 4
DNA repeats hotspotness relative to genes is dependent upon their type. High-copy DNA repeats: (A–C). (A) Simple Repeats (SR). (B) MiscoSatellites (MS). (C) Low Copy repeats (LCR). Viral orgin DNA repeats: (D) Retro-Transposons (RT). (E) Long Terminal Repeats (LTR). Low copy repeats: Selfchains segments (SCS) (F,G). (F) Selfchains segments of type self aligned (SCS-S). (G) Selfchains segments of type Gapped (SCS-G). Horizontal red dashed line corresponds to Hscore threshold of 3 for hotspotness.
Figure 5
Figure 5
Not all LMS present BP distributed as hotspots. Unsupervised hierarchical clustering of LMS patients and DNA elements using Hscores. Used Euclidian distance on Hscores as a distance measure and the complete method as clustering method. The subtrees in the resulting dendrogram are sorted based on the average distance of subtrees at every merging point. Heatmap was generated using pheatmap_1.0.12 package of R software (http://www.r-project.org/index.html).
Figure 6
Figure 6
Stratification of the LMS cohort into Low, Medium and High levels of TRAC and RACIN using iPART. (A) iTRAC. Left, Kaplan–Meier P-values in function of iTRAC single threshold dividing the LMS cohort into Low and High groups (black solid line). Red dashed horizontal line corresponds to 0.05 arbitrary and commonly accepted significance P-value threshold. Blue dashed horizontal line corresponds to the P-value threshold we considered for P-values that will be included in combinatorial double threshold division of the LMS cohort into Low, Medium and High groups (“Materials and methods” section for more details). Vertical green dashed lines correspond to the best combination of thresholds (tl = 0.99, th = 2.29) spliting the LMS cohort into Low, High, Medium groups. Right, Kaplan–Meier plot for iTRAC stratified LMS cohort into Low, Medium and High based on the best combination of thresholds tl = 0.99 and th = 2.29. (B) iRACIN. Both plots correspond to the same procedure as A. tl and th for iRACIN are 0.74 and 1.30 respectively. tl threshold Low, Th threshold High.
Figure 7
Figure 7
MAGIC outperforms CINSARC and FNCLCC in the stratification of metastatic risk in LMS cohort. Metastasis-free survival curves of LMS cohort stratified by (A) MAGIC, (B) CINSARC, (C) FNCLCC.
Figure 8
Figure 8
Application of iPART algorithm to the TCGA Pan-Cancer cohort of 12 cancers of Andor et al.. (A) Kaplan–Meier P-values in function of CNVAbundance single threshold dividing the TCGA Pan-Cancer cohort into Low and High groups (black solid line). Green vertical lines correspond to the four thresholds giving the best data segmentation (see text and “Materials and methods” section for details) into 5 groups, which correspond from left to right to: 0.14, 0.45, 0.67, 0.86. (B) Kaplan–Meier plot showing the stratification of the TCGA cohort into 5 clinically relevant groups. (C) Hazard Ratio (HR) with 95% confidence interval of risk of mortality of each group relative the reference group (G.1). P-values of each HR are shown above each condition. Horizontal dashed line corresponds to a Hazard ratio of 1.
Figure 9
Figure 9
iTRAC stratifies chemotherapeutic response in LMS but not iRACIN. MFS curves in LMS groups of (A) MAGIC, (B) iTRAC and (C) iRACIN stratified by chemotherapeutic treatment.

Similar articles

References

    1. Negrini S, Gorgoulis VG, Halazonetis TD. Genomic instability—An evolving hallmark of cancer. Nat. Rev. Mol. Cell Biol. 2010;11:220–228. - PubMed
    1. Tubbs A, Nussenzweig A. Endogenous DNA damage as a source of genomic instability in cancer. Cell. 2017;168:644–656. - PMC - PubMed
    1. Gaillard H, García-Muse T, Aguilera A. Replication stress and cancer. Nat. Rev. Cancer. 2015;15:276–289. - PubMed
    1. Macheret M, Halazonetis TD. DNA Replication stress as a hallmark of cancer. Annu. Rev. Pathol. Mech. Dis. 2015;10:425–448. - PubMed
    1. Técher H, Koundrioukoff S, Nicolas A, Debatisse M. The impact of replication stress on replication dynamics and DNA damage in vertebrate cells. Nat. Rev. Genet. 2017;18:535–550. - PubMed

Publication types

MeSH terms