

Molecular drivers of tumor progression in microsatellite stable APC mutation-negative colorectal cancers
- PMID: 34873211
- PMCID: PMC8648784
- DOI: 10.1038/s41598-021-02806-x
Molecular drivers of tumor progression in microsatellite stable APC mutation-negative colorectal cancers
Abstract
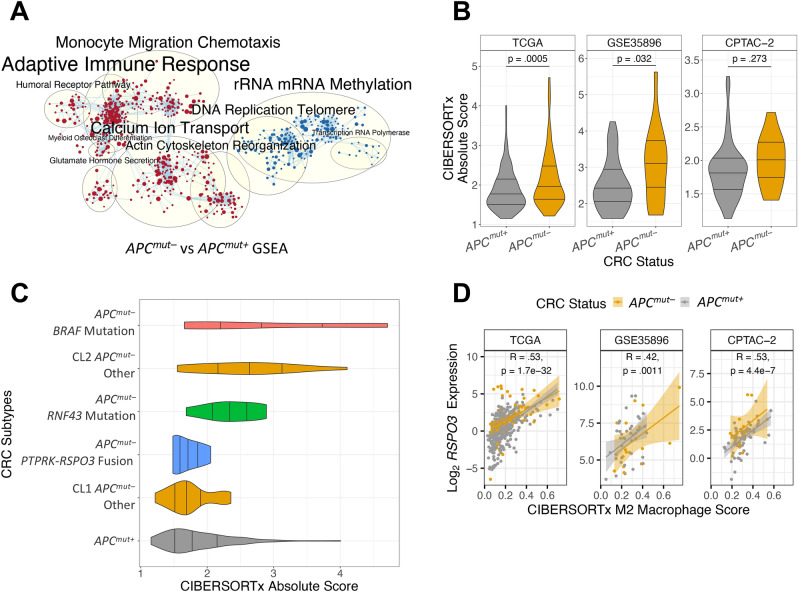
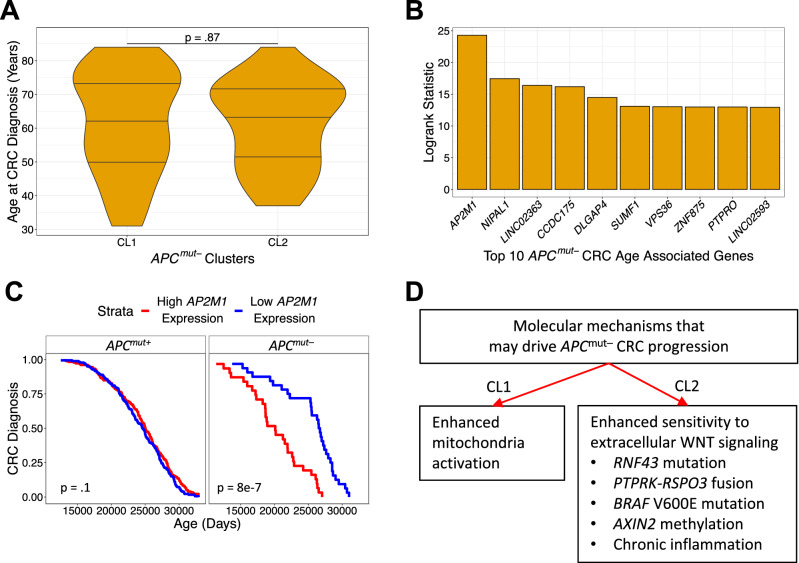
The tumor suppressor gene adenomatous polyposis coli (APC) is the initiating mutation in approximately 80% of all colorectal cancers (CRC), underscoring the importance of aberrant regulation of intracellular WNT signaling in CRC development. Recent studies have found that early-onset CRC exhibits an increased proportion of tumors lacking an APC mutation. We set out to identify mechanisms underlying APC mutation-negative (APCmut-) CRCs. We analyzed data from The Cancer Genome Atlas to compare clinical phenotypes, somatic mutations, copy number variations, gene fusions, RNA expression, and DNA methylation profiles between APCmut- and APC mutation-positive (APCmut+) microsatellite stable CRCs. Transcriptionally, APCmut- CRCs clustered into two approximately equal groups. Cluster One was associated with enhanced mitochondrial activation. Cluster Two was strikingly associated with genetic inactivation or decreased RNA expression of the WNT antagonist RNF43, increased expression of the WNT agonist RSPO3, activating mutation of BRAF, or increased methylation and decreased expression of AXIN2. APCmut- CRCs exhibited evidence of increased immune cell infiltration, with significant correlation between M2 macrophages and RSPO3. APCmut- CRCs comprise two groups of tumors characterized by enhanced mitochondrial activation or increased sensitivity to extracellular WNT, suggesting that they could be respectively susceptible to inhibition of these pathways.
© 2021. The Author(s).
Conflict of interest statement
The authors declare no competing interests.
Figures


Similar articles
-
Lack of APC somatic mutation is associated with early-onset colorectal cancer in African Americans.Carcinogenesis. 2018 Dec 13;39(11):1331-1341. doi: 10.1093/carcin/bgy122. Carcinogenesis. 2018. PMID: 30239619 Free PMC article.
-
Promoter hypermethylation leads to decreased APC mRNA expression in familial polyposis and sporadic colorectal tumours, but does not substitute for truncating mutations.Exp Mol Pathol. 2008 Dec;85(3):201-6. doi: 10.1016/j.yexmp.2008.09.006. Epub 2008 Oct 11. Exp Mol Pathol. 2008. PMID: 18977219
-
Promoter methylation of ITF2, but not APC, is associated with microsatellite instability in two populations of colorectal cancer patients.BMC Cancer. 2016 Feb 17;16:113. doi: 10.1186/s12885-016-2149-9. BMC Cancer. 2016. PMID: 26884349 Free PMC article.
-
Role of adenomatous polyposis coli (APC) gene mutations in the pathogenesis of colorectal cancer; current status and perspectives.Biochimie. 2019 Feb;157:64-71. doi: 10.1016/j.biochi.2018.11.003. Epub 2018 Nov 8. Biochimie. 2019. PMID: 30414835 Review.
-
Multiple Roles of APC and its Therapeutic Implications in Colorectal Cancer.J Natl Cancer Inst. 2017 Aug 1;109(8):djw332. doi: 10.1093/jnci/djw332. J Natl Cancer Inst. 2017. PMID: 28423402 Free PMC article. Review.
Cited by
-
The biological significance of cuproptosis-key gene MTF1 in pan-cancer and its inhibitory effects on ROS-mediated cell death of liver hepatocellular carcinoma.Discov Oncol. 2023 Jun 28;14(1):113. doi: 10.1007/s12672-023-00738-8. Discov Oncol. 2023. PMID: 37380924 Free PMC article.
-
Insights into Early Onset Colorectal Cancer through Analysis of Normal Colon Organoids of Familial Adenomatous Polyposis Patients.Cancers (Basel). 2022 Aug 26;14(17):4138. doi: 10.3390/cancers14174138. Cancers (Basel). 2022. PMID: 36077675 Free PMC article.
-
Detecting colorectal cancer using genetic and epigenetic biomarkers: screening and diagnosis.J Med Life. 2024 Jan;17(1):4-14. doi: 10.25122/jml-2023-0269. J Med Life. 2024. PMID: 38737656 Free PMC article. Review.
-
Investigating the WNT and TGF-beta pathways alterations and tumor mutant burden in young-onset colorectal cancer.Sci Rep. 2024 Aug 2;14(1):17884. doi: 10.1038/s41598-024-68938-y. Sci Rep. 2024. PMID: 39095553 Free PMC article.
-
Wnt signaling in cancer: from biomarkers to targeted therapies and clinical translation.Mol Cancer. 2025 Apr 2;24(1):107. doi: 10.1186/s12943-025-02306-w. Mol Cancer. 2025. PMID: 40170063 Free PMC article. Review.
References
-
- Siegel RL, et al. Colorectal cancer statistics, 2020. CA Cancer J. Clin. 2020;70:145–164. - PubMed
Publication types
MeSH terms
Substances
Grants and funding
LinkOut - more resources
Full Text Sources
Medical
Research Materials
