. 2021 Dec 6;11(1):23489.
doi: 10.1038/s41598-021-02929-1.

Flavivirus infections induce a Golgi stress response in vertebrate and mosquito cells

Affiliations

Flavivirus infections induce a Golgi stress response in vertebrate and mosquito cells

Mercedes Viettri et al. Sci Rep. .

Abstract

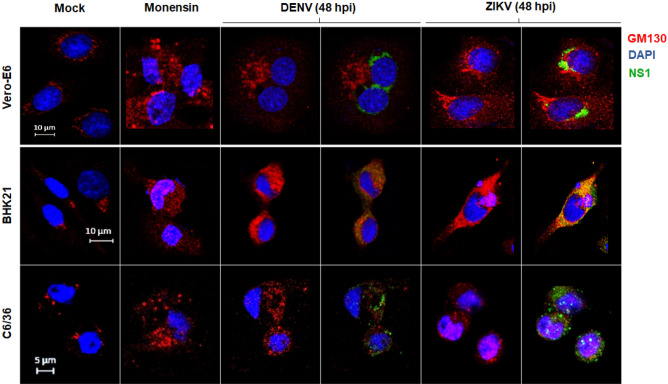
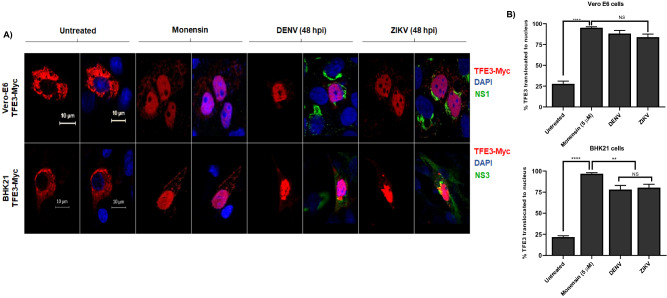
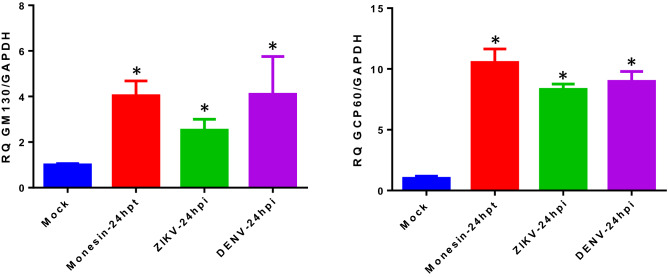
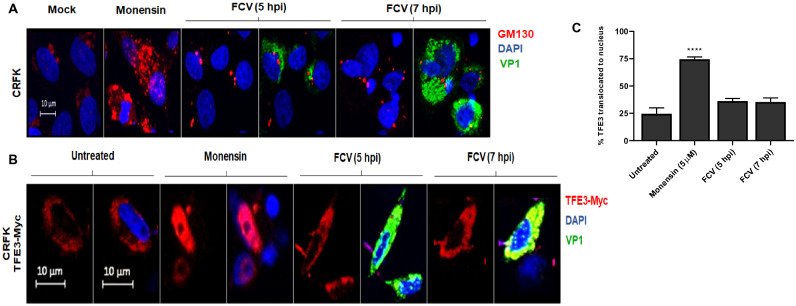
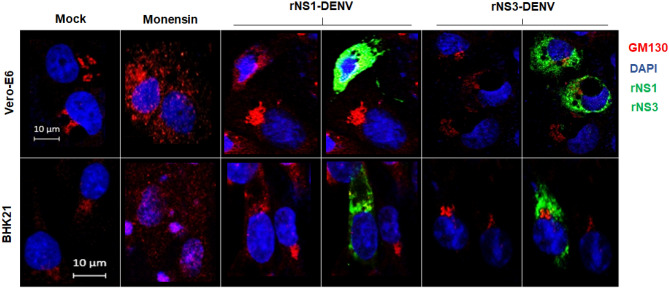
The stress of the Golgi apparatus is an autoregulatory mechanism that is induced to compensate for greater demand in the Golgi functions. No examples of Golgi stress responses due to physiological stimuli are known. Furthermore, the impact on this organelle of viral infections that occupy the vesicular transport during replication is unknown. In this work, we evaluated if a Golgi stress response is triggered during dengue and Zika viruses replication, two flaviviruses whose replicative cycle is heavily involved with the Golgi complex, in vertebrate and mosquito cells. Using GM-130 as a Golgi marker, and treatment with monensin as a positive control for the induction of the Golgi stress response, a significant expansion of the Golgi cisternae was observed in BHK-21, Vero E6 and mosquito cells infected with either virus. Activation of the TFE3 pathway was observed in the infected cells as indicated by the translocation from the cytoplasm to the nucleus of TFE3 and increased expression of pathway targeted genes. Of note, no sign of activation of the stress response was observed in CRFK cells infected with Feline Calicivirus (FCV), a virus released by cell lysis, not requiring vesicular transport. Finally, dilatation of the Golgi complex and translocation of TFE3 was observed in vertebrate cells expressing dengue and Zika viruses NS1, but not NS3. These results indicated that infections by dengue and Zika viruses induce a Golgi stress response in vertebrate and mosquito cells due to the increased demand on the Golgi complex imposed by virion and NS1 processing and secretion.


Conflict of interest statement

The authors declare no competing interests.

Figures

Figure 1
Figure 1
Golgi stress response due to flavivirus infection in vertebrate and mosquito cells. Cells were either treated with monensin and fixed at 24 h or infected with DENV and ZIKV at MOI = 3 and fixed at 48 hpi. Cells were probed against flavivirus NS1 (green), and GM130 (cis-Golgi, red). Nuclei were counter stained with DAPI (blue). Merged fluorescent images of DAPI, red and green channels are shown. The images were analyzed using a Zeiss LSM 700 confocal microscope with laser sections: 0.45 μm. Images from one out of least 3 independent experiments are shown.
Figure 2
Figure 2
Activation of TFE3 pathway due flavivirus infection in vertebrate cells. (A) Cells lines Vero-E6 and BHK-21 were transfected with 1 µg of plasmid DNA of transcriptional factor TFE3 (TEF3-Myc). Twenty-four h after transfection, cells were treated with monensin and fixed 24 h after treatment or infected with DENV and ZIKV and fixed 48 hpi. Cells were probed against flavivirus NS1 (green), and Myc (TFE3, red). Nuclei were counter stained with DAPI (blue). Merged fluorescent images of DAPI, red and green channels are shown. The images were analyzed using a LSM 700 confocal microscope with laser sections: 0.45 μm. Images from one out of least 3 independent experiments are shown. (B) Percentage of TFE3 translocated from the cytoplasm to nucleus in both cells lines were measured through images analysis with Zen Blue edition 2.6 software and the results were plotted using GraphPAD Prism version 8.01. *p ≤ 0.05.
Figure 3
Figure 3
Increase expression of genes targeted by the TFR3 pathway in infected cells. BHK-21 cells were infected with DENV and ZIKV using a MOI = 3 and harvested at 24 hpi. Mock infected and monensin treated cells were included as negative and positive controls, respectively. Changes in GOLGA 2 (GM130) and GCP60 gene expression levels were quantified by qRT-PCR using the delta-delta Ct method and GAPDH as housekeeping gene. Results are the mean ± SD of two independent experiments. Differences in mRNA expression levels were analyzed for statistical significance using the ANOVA test. *p ≤ 0.05.
Figure 4
Figure 4
CRFK cells infected with FCV showed no evidence of Golgi stress or activation of the TFE3 pathway. (A) CRFK cells were infected with FCV and fixed at 5 and 7 hpi. The cells were probed against capsid protein VP1 (green), and GM130 (cis-Golgi, red). Nuclei were counter stained with DAPI (blue). (B) CRFK cells were transfected with 1 µg of plasmid DNA of transcriptional factor TFE3 (pTEF3-Myc), then infected with FCV at MOI = 5 and fixed at 5 and 7 hpi. Cells were probed against capsid protein VP1 (green), Myc (TFE3, red). Nuclei were counter stained with DAPI (blue). Cells were analyzed using a Zeiss LSM 700 confocal microscope with laser sections: 0.45 μm. (C) Percentage of TFE3 translocated from the cytoplasm to nucleus were measured through images analysis with Zen Blue edition 2.6 software and the results were plotted using GraphPAD Prism version 8.01. *p ≤ 0.05.
Figure 5
Figure 5
Golgi stress response in vertebrate cells due to expression of recombinant NS1 of dengue virus. Cells were transfected with 1 µg of plasmid DNA of DENV-NS1 and DENV-NS3 or treated with monensin as a positive control and fixed after 24 h. Cells were probed against flavivirus NS1 and NS3 (green), GM130 (cis-Golgi, red). Nuclei were counter stained with DAPI (blue). Merged fluorescent images of DAPI, red and green channels are shown. The images were analyzed using a Zeiss LSM 700 confocal microscope with laser sections: 0.45 μm. Images from one out of least 3 independent experiments are shown.

Similar articles

Cited by

References

    1. Yoshida H. ER stress response, peroxisome proliferation, mitochondrial unfolded protein response and golgi stress response. IUBMB Life. 2009;61:871–879. doi: 10.1002/iub.229. - DOI - PubMed
    1. Sasaki K, Yoshida H. Organelle autoregulation: Stress responses in the ER, Golgi, mitochondria and lysosome. J. Biochem. 2015;157:185–195. doi: 10.1093/jb/mvv010. - DOI - PubMed
    1. Sasaki K, Yoshida H. Golgi stress response and organelle zones. Fed. Eur. Biochem. Soc. Lett. 2019;593:2330–2340. doi: 10.1002/1873-3468.13554. - DOI - PubMed
    1. Fernandez-Garcia MD, Mazzon M, Jacobs M, Amara A. Pathogenesis of flavivirus infections: Using and abusing the host cell. Cell Host Microbe. 2009;5:318–328. doi: 10.1016/j.chom.2009.04.001. - DOI - PubMed
    1. Valadão ALC, Aguiar RS, de Arruda LB. Interplay between inflammation and cellular stress triggered by Flaviviridae viruses. Front. Microbiol. 2016;7:1–19. doi: 10.3389/fmicb.2016.01233. - DOI - PMC - PubMed

Publication types

Substances