. 2021 Dec 6;11(1):23471.
doi: 10.1038/s41598-021-02994-6.

Assessment of behavioral, morphological and electrophysiological changes in prenatal and postnatal valproate induced rat models of autism spectrum disorder

Affiliations

Assessment of behavioral, morphological and electrophysiological changes in prenatal and postnatal valproate induced rat models of autism spectrum disorder

Katarine Fereshetyan et al. Sci Rep. .

Abstract

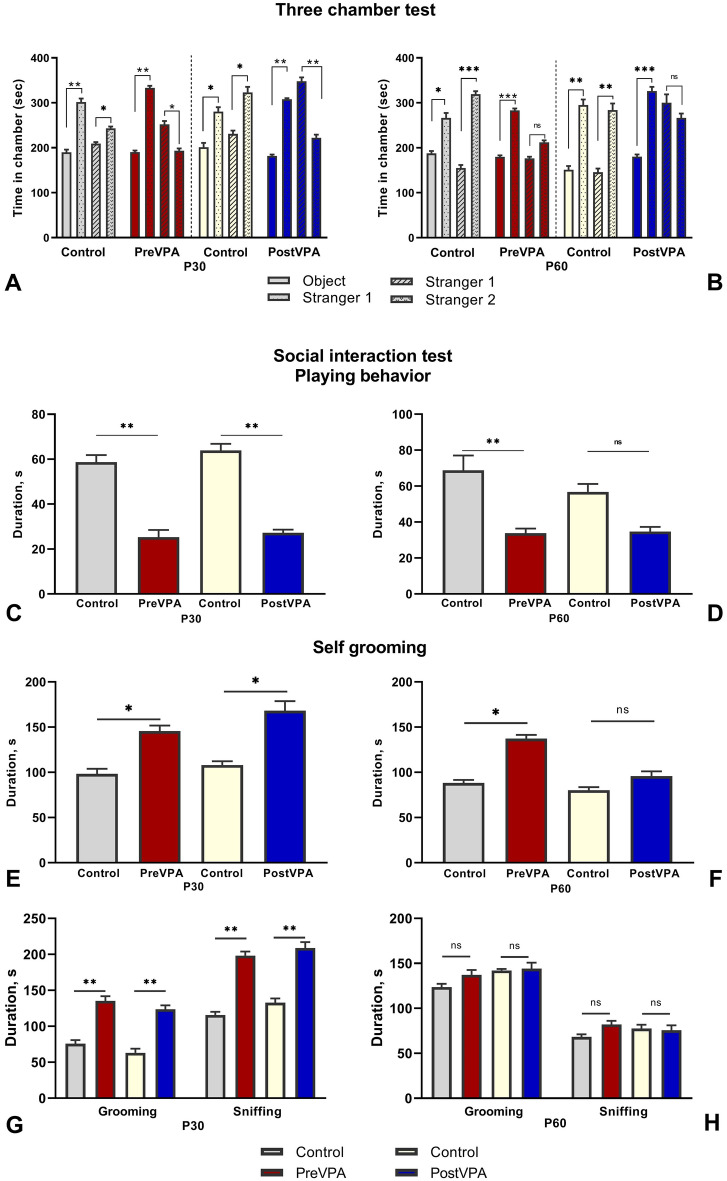
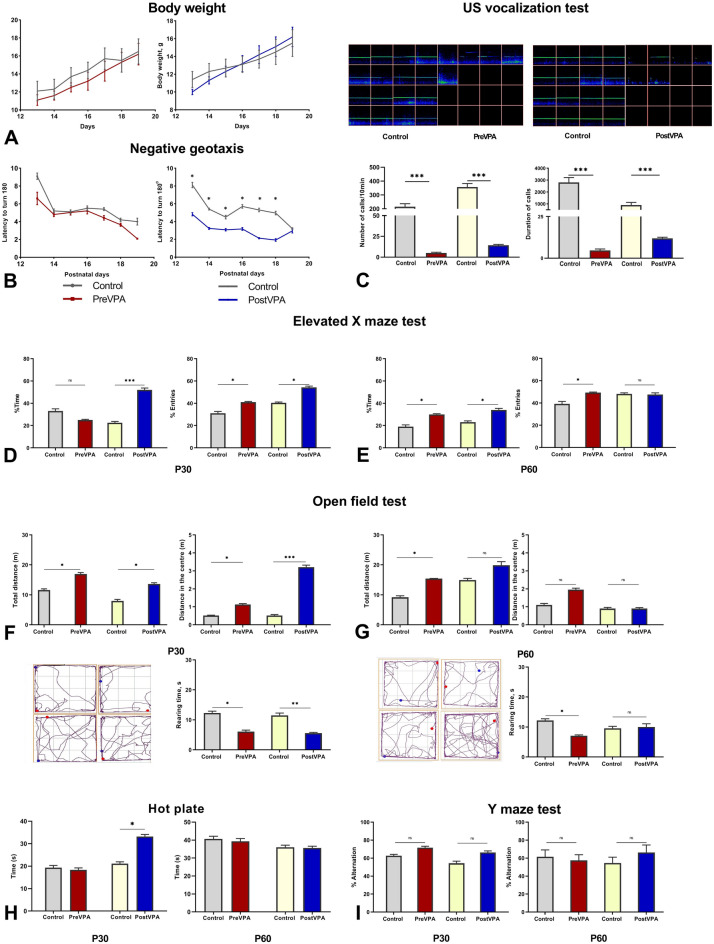
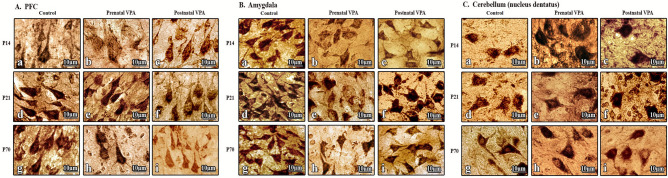
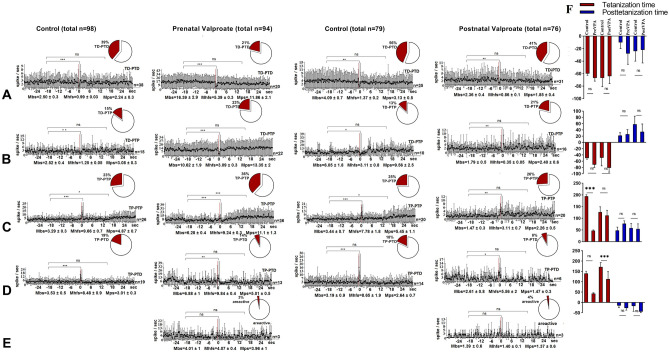
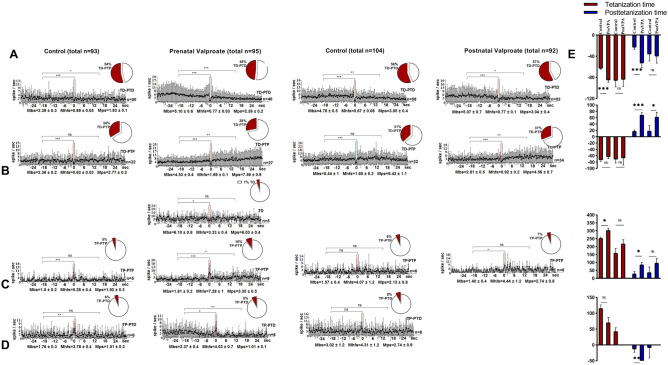
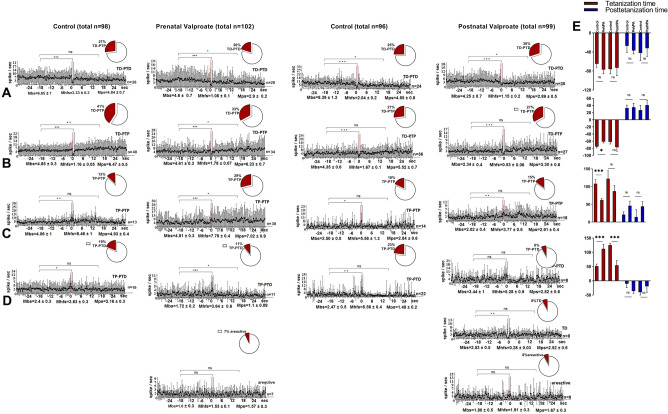
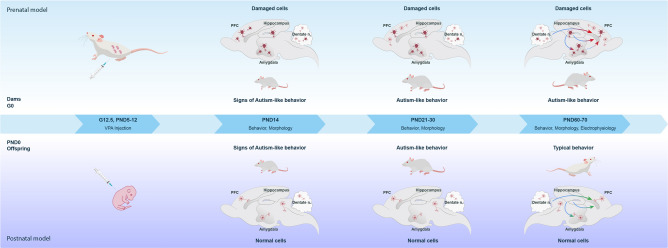
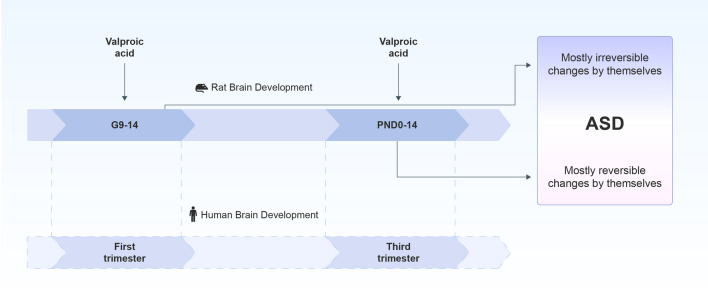
Autism spectrum disorders (ASD) are neurodevelopmental disorders, that are characterized by core symptoms, such as alterations of social communication and restrictive or repetitive behavior. The etiology and pathophysiology of disease is still unknown, however, there is a strong interaction between genetic and environmental factors. An intriguing point in autism research is identification the vulnerable time periods of brain development that lack compensatory homeostatic corrections. Valproic acid (VPA) is an antiepileptic drug with a pronounced teratogenic effect associated with a high risk of ASD, and its administration to rats during the gestation is used for autism modeling. It has been hypothesized that valproate induced damage and functional alterations of autism target structures may occur and evolve during early postnatal life. Here, we used prenatal and postnatal administrations of VPA to investigate the main behavioral features which are associated with autism spectrum disorders core symptoms were tested in early juvenile and adult rats. Neuroanatomical lesion of autism target structures and electrophysiological studies in specific neural circuits. Our results showed that prenatal and early postnatal administration of valproate led to the behavioral alterations that were similar to ASD. Postnatally treated group showed tendency to normalize in adulthood. We found pronounced structural changes in the brain target regions of prenatally VPA-treated groups, and an absence of abnormalities in postnatally VPA-treated groups, which confirmed the different severity of VPA across different stages of brain development. The results of this study clearly show time dependent effect of VPA on neurodevelopment, which might be explained by temporal differences of brain regions' development process. Presumably, postnatal administration of valproate leads to the dysfunction of synaptic networks that is recovered during the lifespan, due to the brain plasticity and compensatory ability of circuit refinement. Therefore, investigations of compensatory homeostatic mechanisms activated after VPA administration and directed to eliminate the defects in postnatal brain, may elucidate strategies to improve the course of disease.


Conflict of interest statement

The authors declare no competing interests.

Figures

Figure 1
Figure 1
Behavioral alterations associated with VPA treatment. (A,B) Graphs illustrate time spent in each chamber with Stranger1 and empty cup (object) during the first session, with Stranger1 and Stranger2 during the second session. (C,D) Graphs illustrate the total duration of pinning and pouncing during the 10 min. (E,F) Graphs illustrate the total duration of self-grooming (repetitive behavior) during the 10 min. (G,H) Graphs illustrate the total duration of grooming and sniffing (non-playing behavior) during the 10 min. On the left and right sides of the figure are shown results of the tests carried out on PND30 and PND60 respectively. Data are represented as the mean ± SEM. Statistical significance is indicated as follows: ***p < 0.001, **p < 0.01, *p < 0.05, ns -non-significant.
Figure 2
Figure 2
Behavioral alterations associated with VPA treatment. (A) Changes in body weight during the PND 13–19 after VPA prenatal and postnatal administration. (B) Impairments of ability to turn 180° when pups placed a head down position during the postnatal 13–19 days after VPA prenatal and postnatal administration. (C) Exemplary spectrograms of 50 kHz USVs emitted after isolation from mother on PND14, the intensity of the color represents the relative amount of USV with the corresponding frequency and duration respectively. Graphs illustrate duration and number of calls in VPA treated groups vs. Control (ultrasonic emissions were recorded by SPEC’T software, version 3, http://binaryacoustictech.com/batpages_files/spectr.htm, and analyzed by SCAN’R software, version 1.0, http://binaryacoustictech.com/batpages_files/scanr.htm). (I) Graphs illustrate the percentage of alternations during the 5 min tested on PND 30 and PND60, the left and right panels respectively. (D, E) Graphs illustrate (1) ratio of time spent in open arms to total time spent in the maze; (2) ratio of entries’ number into open arms to total entries’ number, tested on PND 30 and PND60, the left and right panels respectively. (F, G) Graphs illustrate the total distance travelled during the test and distance travelled in central zone, total duration of rearing activity tested on PND30 and PND60, the left and right panels respectively. In the lower left corners are rat's trajectory plots created by Any-maze behavioral tracking software, Stoelting Co. (H) Graphs illustrate the duration of response to the thermal stimulus (50 ± 0.5 °C) tested on PND 30 and PND60, the left and right panels. Data are represented as the mean ± SEM. Statistical significance is indicated as follows: ***p < 0.001, **p < 0.01, *p < 0.05, ns -non significant.
Figure 3
Figure 3
Morphological changes in brain target structures after prenatal and postnatal VPA administration compared to control group. (A) After the prenatal administration of VPA on PND 14(b), PND21(e), PND70(h) swollen pyramidal neurons with central chromatolysis and weak staining were found in prefrontal cortex. After the postnatal administration of VPA on PND 14(c), PND21(f), PND70(i) normal pyramidal neurons with centrally located nucleus and long dendrites were found. (B) After the prenatal administration of VPA on PND 14(b), PND21(e) swollen pyramidal neurons with central chromatolysis and weak staining were found in amygdala, on PND70(h) structural changes are not pronounced. After the postnatal administration of VPA on PND 14(c), PND21(f), PND70(i) normal pyramidal neurons with centrally located nucleus and long dendrites were found. (C) No morphological changes were observed on tested days in cerebellum. Magnification: × 1000 (AC).
Figure 4
Figure 4
Electrophysiological changes in form of time histograms of peri-stimulus average spike frequency in neurons of prefrontal cortexto high-frequency stimulation of hippocampus after prenatal and postnatal VPA administration. The time histograms of peri-stimulus average spike frequency in neurons of prefrontal cortex are illustrated in the figure. The mean peri-stimulus frequency diagrams built on the basis of pre-stimulus and post-stimulus manifestations of spike activity of single PFC neurons to high-frequency stimulation of hippocampus in a real time 30 s before stimulation (Mbs), 30 s post-stimulation (Mps) and during high-frequency stimulation (Mhfs), exhibiting the specified types of response: (A) TD-PTD, (B) TD-PTP, (C) TP-PTP, (D) TP-PTD, and areactivity (E) in the VPA treated groups. The data are presented as mean ± SD; n = number of neurons. The statistical significance from baseline (Mbs) was estimated according to the unpaired Student's t-test, ***p < 0.001, **p < 0.01, *p < 0.05, ns - non significant. (F) The bar diagrams show the average % change relative to the baseline (Mbs, zero level) in responses of tetanization time (red) and post-tetanization time (blue) in control vs. VPA treated groups in the population of neurons with a given type of response. Statistical significance was calculated using Fisher’s exact test, *p < 0.05.
Figure 5
Figure 5
Electrophysiological changes in form of time histograms of peri-stimulus average spike frequency in neurons of prefrontal cortexto high-frequency stimulation of nucleus dentatusafter prenatal and postnatal VPA administration. The time histograms of peri-stimulus average spike frequency in neurons of prefrontal cortex are illustrated in the figure. The mean peri-stimulus frequency diagrams built on the basis of pre-stimulus and post-stimulus manifestations of spike activity of single PFC neurons to high-frequency stimulation of nucleus dentatus of the cerebellum in a real time 30 s before stimulation (Mbs), 30 s post-stimulation (Mps) and during high-frequency stimulation (Mhfs), exhibiting the specified types of response: (A) TD-PTD, (B) TD-PTP, (C) TP-PTP, (D) TP-PTD, TD only in prenatally VPA treated group. The data are presented as mean ± SD; n = number of neurons. The statistical significance from baseline (Mbs) was estimated according to the unpaired Student's t-test, ***p < 0.001, **p < 0.01, *p < 0.05, ns -non significant. (E) The bar diagrams show the average % change relative to the baseline (Mbs, zero level) in responses of tetanization time (red) and post-tetanization time (blue) in control vs. VPA treated groups in the population of neurons with a given type of response. Statistical significance was calculated using Fisher’s exact test, *p < 0.05.
Figure 6
Figure 6
Electrophysiological changes in form of time histograms of peri-stimulus average spike frequency in neurons of amygdala to high-frequency stimulation of hippocampus after prenatal and postnatal VPA administration. The time histograms of peri-stimulus average spike frequency in neurons of amygdala are illustrated in the figure. The mean peri-stimulus frequency diagrams built on the basis of pre-stimulus and post-stimulus manifestations of spike activity of single amygdala neurons to high-frequency stimulation of hippocampus in a real time 30 s before stimulation (Mbs), 30 s post-stimulation (Mps) and during high-frequency stimulation (Mhfs), exhibiting the specified types of response: (A) TD-PTD, (B) TD-PTP, (C) TP-PTP, (D) TP-PTD, and nonreactivity in the VPA treated groups. The data are presented as mean ± SD; n = number of neurons. The statistical significance from baseline (Mbs) was estimated acording to the unpaired Student's t-test, ***p < 0.001, **p < 0.01, *p < 0.05, ns -non significant. (E)The bar diagrams show the average % change relative to the baseline (Mbs, zero level) in responses of tetanization time (red) and post-tetanization time (blue) in control vs. VPA treated groups in the population of neurons with a given type of response. Statistical significance was calculated using Fisher’s exact test, * p < 0.05.
Figure 7
Figure 7
Graphical illustration of behavioral, morphological and electrophysiological changes in pre- and postnatal VPA-induced ASD models in different time periods. In prenatal model increasing ASD-like behavior associated with cellular damage of PFC, amygdala, hippocampus and dentate n. of cerebellum neurons (damaged cells are in red) on PND 14, PND (21–30), and PND 60–70 is shown (upper panel). Red arrows trace functional alterations between structures analyzed by electrophysiological studies on PND 70. In postnatal model ASD-like behavioral changes associated with normal cellar structure of PFC, amygdala, hippocampus and dentate n. of cerebellum neurons, as well as typical behavior on PND 60–70 are shown. Green arrows trace functional connections between structures analyzed by electrophysiological studies on PND 70 (bottom panel).
Figure 8
Figure 8
Possible ASD phenotypes modeled in rats by exposure to valproic acid in different periods of brain development in rodents and humans. Exposure to valproic acid on gestation day 12.5 of pregnant rat which corresponds to the 1st trimester of human pregnancy lead to manifestation of stable and irreversible ASD phenotype. While administration of valproic acid during the first two weeks of postnatal life, which corresponds to the 3rd trimester of human pregnancy, later is manifested with reversible ASD like symptoms. Mostly they appear at early adolescence and normalized up to adulthood by themselves.
Figure 9
Figure 9
(A) In vivo recorded spike flow of single neuron in mPFC. The blue line is amplitude discriminator for making a spike selection. (B) The spikes distribution in real time before stimulation (bs), post stimulation (ps) and during high frequency (HFS) stimulation (1 s on ps) for mPFC single neurons specific types of responses. (C) Raster of spikes peri-stimulus distribution in real time produced by individual hippocampal neurons (12 trials at time intervals of 5 min). Recording and analysis of the spike activity of single neurons were performed by the software (SpikeRegistrator, Rg 1 MFC Application, Rg 1 EXE).

Similar articles

Cited by

References

    1. Home | APA DSM-5. http://www.dsm5.org/Pages/Default.aspx.
    1. Yenkoyan K, Grigoryan A, Fereshetyan K, Yepremyan D. Advances in understanding the pathophysiology of autism spectrum disorders. Behav. Brain Res. 2017;331:92–101. - PubMed
    1. Gilbert, J. & Man, H.-Y. Fundamental elements in autism: From neurogenesis and neurite growth to synaptic plasticity. Front. Cell. Neurosci.11, (2017). - PMC - PubMed
    1. Belmonte MK, et al. Autism and abnormal development of brain connectivity. J. Neurosci. 2004;24:9228–9231. - PMC - PubMed
    1. Kolb B, et al. Experience and the developing prefrontal cortex. Proc. Natl. Acad. Sci. 2012;109:17186–17193. - PMC - PubMed

Publication types

MeSH terms