. 2021 Dec;5(12):1411-1425.
doi: 10.1038/s41551-021-00826-6. Epub 2021 Dec 6.

Cancer-cell stiffening via cholesterol depletion enhances adoptive T-cell immunotherapy

Affiliations

Cancer-cell stiffening via cholesterol depletion enhances adoptive T-cell immunotherapy

Kewen Lei et al. Nat Biomed Eng. 2021 Dec.

Abstract

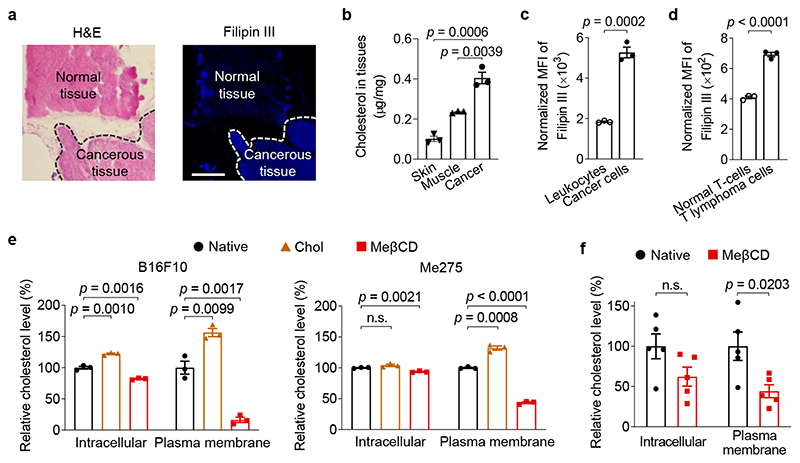
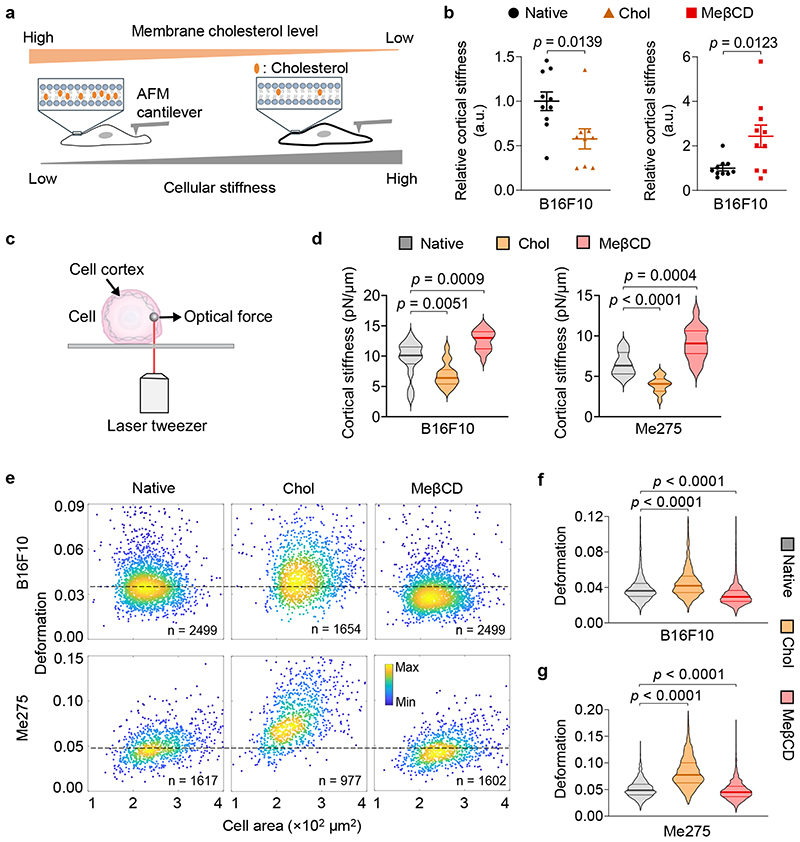
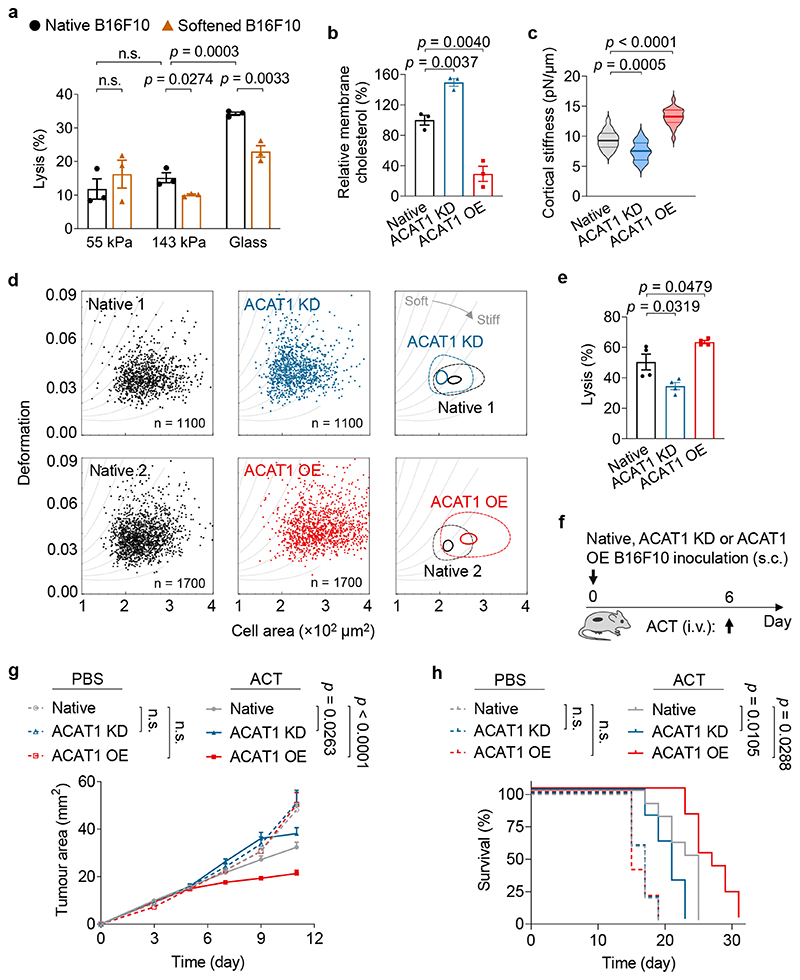
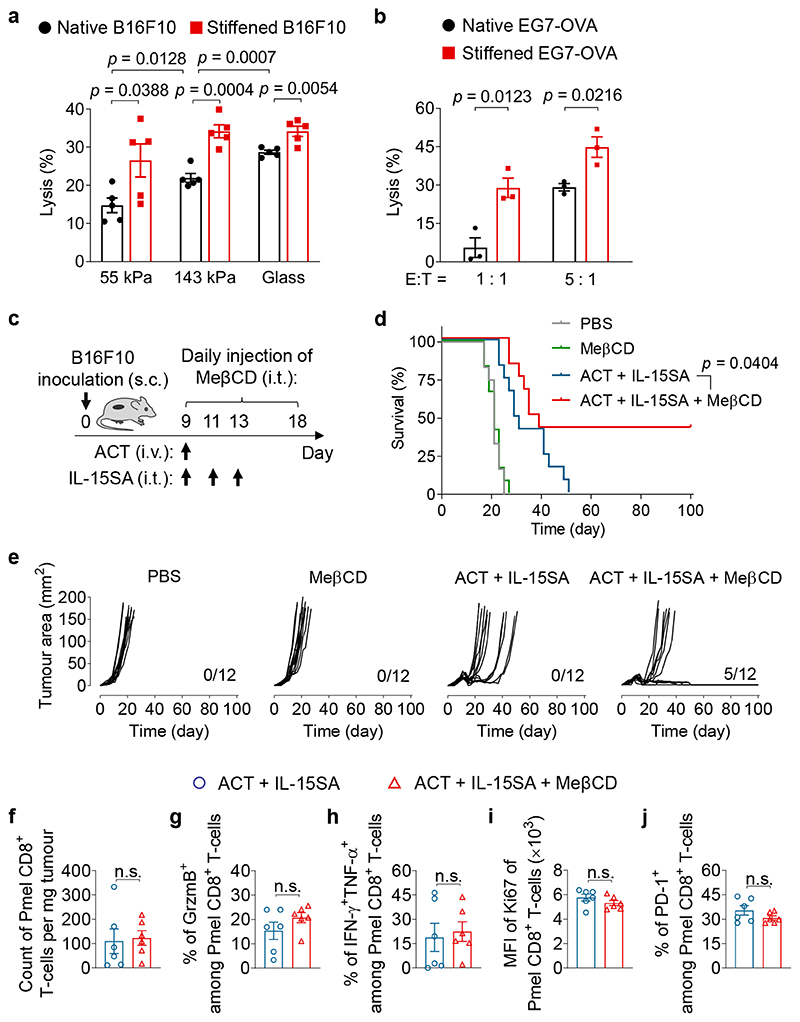
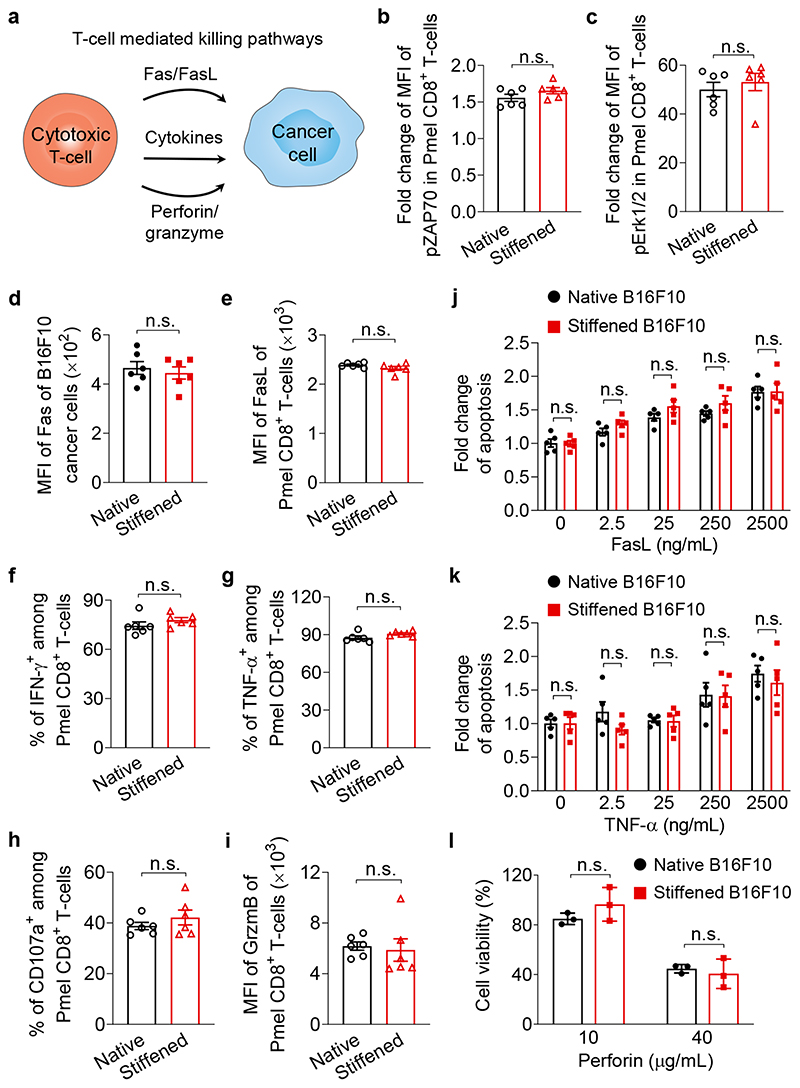
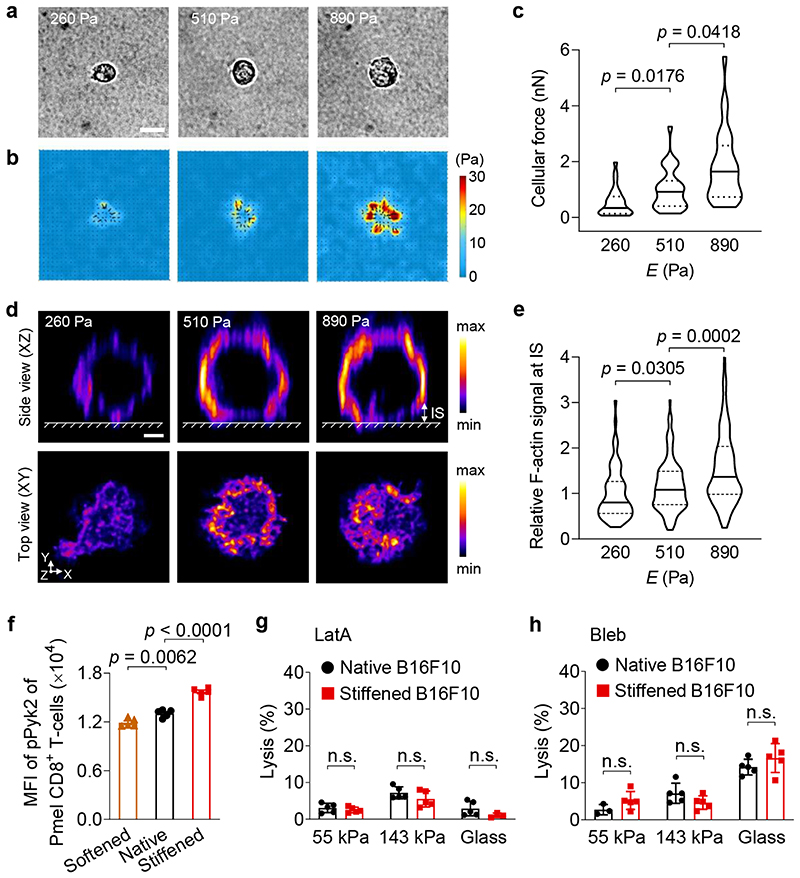
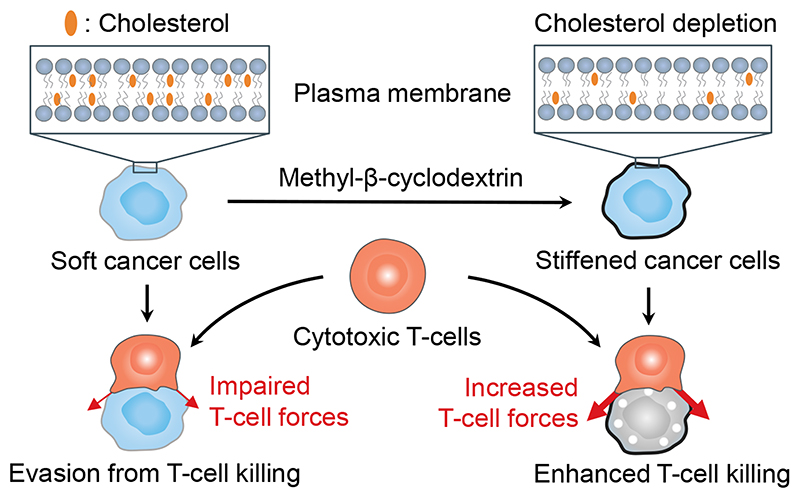
Malignant transformation and tumour progression are associated with cancer-cell softening. Yet how the biomechanics of cancer cells affects T-cell-mediated cytotoxicity and thus the outcomes of adoptive T-cell immunotherapies is unknown. Here we show that T-cell-mediated cancer-cell killing is hampered for cortically soft cancer cells, which have plasma membranes enriched in cholesterol, and that cancer-cell stiffening via cholesterol depletion augments T-cell cytotoxicity and enhances the efficacy of adoptive T-cell therapy against solid tumours in mice. We also show that the enhanced cytotoxicity against stiffened cancer cells is mediated by augmented T-cell forces arising from an increased accumulation of filamentous actin at the immunological synapse, and that cancer-cell stiffening has negligible influence on: T-cell-receptor signalling, production of cytolytic proteins such as granzyme B, secretion of interferon gamma and tumour necrosis factor alpha, and Fas-receptor-Fas-ligand interactions. Our findings reveal a mechanical immune checkpoint that could be targeted therapeutically to improve the effectiveness of cancer immunotherapies.


Conflict of interest statement

Competing interests

The authors declare no competing interests.

Figures

Fig. 1
Fig. 1. Cholesterol is enriched in the plasma membrane of cancer cells.
a, B16F10 tumour tissues (indicated with dash lines) and the adjacent normal tissues were stained with hematoxylin and eosin (H&E) and Filipin III (shown in blue colour). Scale bar, 500 μm. b, Cholesterol levels in B16F10 tumour tissues and the adjacent skin and muscle tissues (n = 3). c, d, Membrane cholesterol levels of tumour-infiltrating leukocytes (CD45.2+) and cancer cells (tdTomato+) in 4T1-Fluc-tdTomato tumour (c), and murine T lymphoma cells (EG7-OVA) and normal murine T-cells (d) determined by Filipin III staining (n = 3). The displayed MFI values were normalized by forward scatter area (FSC-A) of corresponding samples. e, f, Relative intracellular and plasma membrane levels of cholesterol (normalized to that of native cells) in murine B16F10 and human Me275 cancer cells treated with water-soluble cholesterol/methyl-β-cyclodextrin complex (Chol) or methyl-β-cyclodextrin (MeβCD) in vitro (e, n = 3) and in vivo (f, B16F10, n = 5). Data are one representative of at least two independent experiments with biological replicates. P values were determined by unpaired Student’s t test. Error bars represent standard error of the mean (SEM). MFI, mean fluorescence intensity; n.s., not significant.
Fig. 2
Fig. 2. Cancer-cell stiffness can be manipulated via the supplementation or depletion of cholesterol in the cell membrane.
a, Schematic illustration of the correlation between cellular stiffness and membrane cholesterol level. b, Relative cortical stiffness determined by nanoindentation measurements using atomic force microscopy (AFM) for native, Chol- or MeβCD-treated B16F10 cancer cells (n = 9 ~ 10 individual cells). Each data point is the average of at least twenty force curve measurements of a single cancer cell. Native B16F10 cancer cells serve as a standard (100%). Error bars represent SEM. c, Schematic illustration of the optical tweezer setting for cell cortical stiffness measurement. d, Cortical stiffness of native, Chol- or MeβCD-treated murine B16F10 and human Me275 cancer cells measured by the optical tweezer (n = 14 ~ 17 individual cells). e-g, Cellular deformation was measured using deformability cytometry to compare cellular stiffness in a high throughput manner. Shown are representative scatter plots (e; indicated are sample size, outliers not shown) and quantitative deformation of native, Chol- or MeβCD-treated murine B16F10 (f) and human Me275 (g) cancer cells. In all the violin plots (d, f, g), the middle solid line shows median, and lower and upper dash lines show 25th and 75th percentiles, respectively. P values were determined by unpaired Student’s t test. a.u., arbitrary unit; n.s., not significant.
Fig. 3
Fig. 3. Cancer-cell softness impairs T-cell mediated cytotoxicity in vitro and in vivo.
a, Lysis percentage of B16F10 cancer cells pre-treated with Chol (softened) or PBS (native) and co-cultured with activated Pmel CD8+ T-cells at an effector:target (E:T) ratio of 10:1 for 5 h (n = 3). b, Relative membrane cholesterol levels of B16F10 cancer cells with ACAT1 knock-down (ACAT1 KD) and ACAT1 overexpression (ACAT1 OE) (n = 3). Native B16F10 cancer cells serve as a standard (100%). c, Cortical stiffness of native, ACAT1 KD, and ACAT1 OE B16F10 cells measured by the optical tweezer (n = 19 ~ 21 individual cells). In the violin plots, the middle solid line shows median, and lower and upper dash lines show 25th and 75th percentiles, respectively. d, Representative scatter plots for native, ACAT1 KD, and ACAT1 OE B16F10 cells by deformability cytometry analysis, and their 50%-density contour plots (the inner contours correspond to 95% event density) with iso-elasticity lines dividing the diagrams into areas of different stiffness. e, Lysis percentage of ACAT1 KD and ACAT1 OE B16F10 cancer cells after 5-h co-culture with Pmel CD8+ T-cells at an E:T ratio of 10:1 (n = 4). Data are one representative of at least two independent experiments with biological replicates (a, b, e). f-h, Mice bearing native, ACAT1 KD, or ACAT1 OE B16F10 tumours were treated with adoptive transfer of Pmel CD8+ T-cells (5 × 10⁶ per mouse), as outlined in the experimental scheme (f) (n = 5 and 10 animals for PBS- and ACT-treated groups, respectively). Shown are tumour growth curves (g) and survival curves (h) of pooled data from two independent experiments with biological replicates. P values were determined by unpaired Student’s t test in (a-c, e), two-way ANOVA in (g), or log-rank test in (h). Error bars represent SEM. ACAT1, acyl-CoA:cholesterol acyltransferase 1; PBS, phosphate-buffered saline; ACT, adoptive cell transfer; s.c., subcutaneous; i.v., intravenous; n.s., not significant.
Fig. 4
Fig. 4. Cancer-cell stiffening by MeβCD enhances the efficacy of ACT immunotherapy.
a, Lysis percentage of B16F10 cancer cells pre-treated with MeβCD (stiffened) or PBS (native) and co-cultured with activated Pmel CD8+ T-cells at an E:T ratio of 10:1 for 5 h (n = 5). b, Lysis percentage of EG7-OVA cancer cells pre-treated with MeβCD (stiffened) or PBS (native) and co-cultured with activated OT-I CD8+ T-cells at indicated E:T ratios for 5 h (n = 3). Data in (a, b) are one representative of at least three independent experiments with biological replicates. c-e, B16F10 tumour-bearing mice were treated with adoptive transfer of Pmel CD8+ T-cells (5 × 10⁶ per mouse) adjuvanted by interleukin-15 super-agonist (IL-15SA, 10 μg per injection) with or without daily MeβCD administration (1 mg per injection) as outlined in the experimental scheme (c). Mice receiving injections of PBS or MeβCD only serve as controls (n = 12 animals per group). Shown are survival curves (d), and individual tumour growth curves (e, indicated are the number of mice with durable responses out of all treated mice) of pooled data of two independent experiments with biological replicates. f-j, Tumour-infiltrating Pmel CD8+ T-cells were analysed by flow cytometry on day 14 (experimental scheme is shown in Supplementary Fig. 12b). Shown are counts (f), frequencies of granzyme B (GrzmB)+ (g), polyfunctional (h), and PD-1+ (j), and Ki67 expression level (i) of tumour-infiltrating Pmel CD8+ T-cells (n = 6 animals per group). Data are one representative of two independent experiments with biological replicates. P values were determined by unpaired Student’s t test in (a, b, f-j) or log-rank test in (d). Error bars represent SEM. PBS, phosphate-buffered saline; ACT, adoptive cell transfer; MFI, mean fluorescence intensity; s.c., subcutaneous; i.v., intravenous; i.t., intratumoural; n.s., not significant.
Fig. 5
Fig. 5. Cancer-cell stiffening has negligible influence on biochemical cancer-cell killing pathways mediated by T-cells.
a, Schematic illustration of T-cell mediated killing pathways. b, c, Fold change of MFI of phosphorylated ZAP70 (pZAP70, b) and Erk1/2 (pErk1/2, c) in activated Pmel CD8+ T-cells stimulated by native or MeβCD-treated (stiffened) B16F10 cancer cells at 37 °C for 5 min (n = 6). d, Expression levels of Fas of native and stiffened B16F10 cancer cells (n = 6). e-i, Activated Pmel CD8+ T-cells were co-cultured with native or stiffened B16F10 cancer cells (E:T ratio = 10:1) at 37 °C for 5 h. Shown are expression levels of Fas ligand (FasL) (e) and granzyme B (GrzmB) (i), and frequencies of IFN-γ+ (f), TNF-α+ (g), and CD107a+ (h) of Pmel CD8+ T-cells (n = 6). j, k, Fold change of frequencies of apoptotic native and stiffened B16F10 cancer cells after incubation with FasL (j) or TNF-α (k) at indicated concentrations at 37 °C for 5 h (n = 5). l, Viability of native and stiffened B16F10 cancer cells after incubation with perforin of indicated concentrations at 37 °C for 20 min (n = 3). P values were determined by unpaired Student’s t test. Error bars represent SEM. MFI, mean fluorescence intensity; n.s., not significant. All data are one representative of at least three independent experiments with biological replicates.
Fig. 6
Fig. 6. Enhanced cytotoxicity against stiffened cancer cells is mediated by T-cell forces.
a-c, Forces exerted by activated Pmel CD8+ T-cells on polyacrylamide (PA) hydrogel substrates of indicated stiffness coated with anti-CD3 and anti-CD28 antibodies were measured using traction force microscopy. Shown are representative bright field images (a) and the corresponding traction stress maps (b), and average total force per cell (c) (n = 29 individual cells). The colour bar indicates the magnitude of stress. Scale bar, 5 μm. d, Representative deconvoluted confocal fluorescence images of F-actin of activated Pmel CD8+ T-cells on PA hydrogel substrates of indicated stiffness coated with anti-CD3 and anti-CD28 antibodies. The upper row shows the side view (XZ plane); the lower row shows the top view (XY plane) of F-actin at the T-cell immunological synapse (IS, defined as the structure between the surface of hydrogel and a height of 2 μm above the surface of the hydrogel). The colour bar indicates the intensity of the F-actin fluorescence signal. Scale bar, 2 μm. e, Relative total fluorescence intensity (normalized by the mean value at 260 Pa) of F-actin at the IS in the images from (d) (n = 66, 119, and 179 individual cells for 260, 510 and 890 Pa, respectively). f, MFI of phosphorylated Pyk2 (pPyk2) in activated Pmel CD8+ T-cells co-cultured with native, Chol-treated (softened) or MeβCD-treated (stiffened) B16F10 cancer cells (n = 5). g, h, Lysis percentage of native and stiffened B16F10 cancer cells co-cultured with activated Pmel CD8+ T-cells (E:T ratio = 10:1), which were pre-treated with latrunculin A (LatA, g) or blebbistatin (Bleb, h) (n = 5). P values were determined by Kruskal-Wallis test in (c, e) or unpaired Student’s t test in (f-h). Error bars represent SEM. In the violin plots (c, e), the middle solid line shows median, and lower and upper dash lines show 25th and 75th percentiles, respectively. MFI, mean fluorescence intensity; n.s., not significant. All data are one representative of at least two independent experiments with biological replicates.
Fig. 7
Fig. 7. Illustration of mechanical immuno-suppression induced by the softness of cancer cells. Stiffening the cancer cells enhances cancer-cell killing by T-cells.

Similar articles

Cited by

References

    1. Ribas A, Wolchok JD. Cancer immunotherapy using checkpoint blockade. Science. 2018;359:1350–1355. - PMC - PubMed
    1. Wang H, Mooney DJ. Biomaterial-assisted targeted modulation of immune cells in cancer treatment. Nat Mater. 2018;17:761–772. - PubMed
    1. Eil R, et al. Ionic immune suppression within the tumour microenvironment limits T cell effector function. Nature. 2016;537:539–543. - PMC - PubMed
    1. André P, et al. Anti-NKG2A mAb is a checkpoint inhibitor that promotes anti-tumor immunity by unleashing both T and NK cells. Cell. 2018;175:1731–1743. - PMC - PubMed
    1. Levental KR, et al. Matrix crosslinking forces tumor progression by enhancing integrin signaling. Cell. 2009;139:891–906. - PMC - PubMed

Publication types

Substances