. 2022 Apr;40(4):488-498.
doi: 10.1038/s41587-021-01089-x. Epub 2021 Dec 6.

T cells targeted to TdT kill leukemic lymphoblasts while sparing normal lymphocytes

Affiliations

T cells targeted to TdT kill leukemic lymphoblasts while sparing normal lymphocytes

Muhammad Ali et al. Nat Biotechnol. 2022 Apr.

Abstract

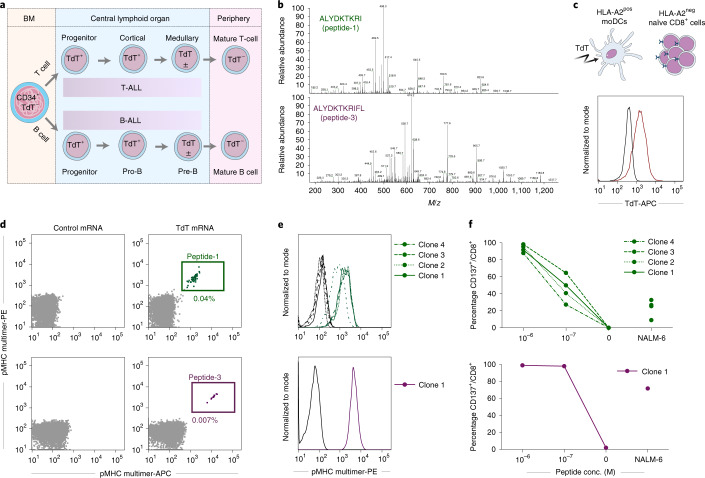
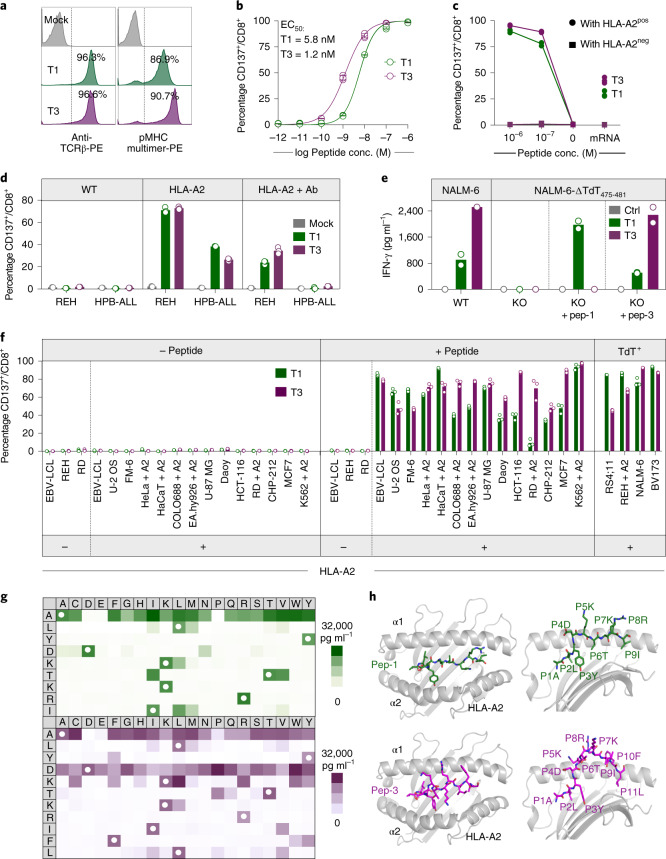
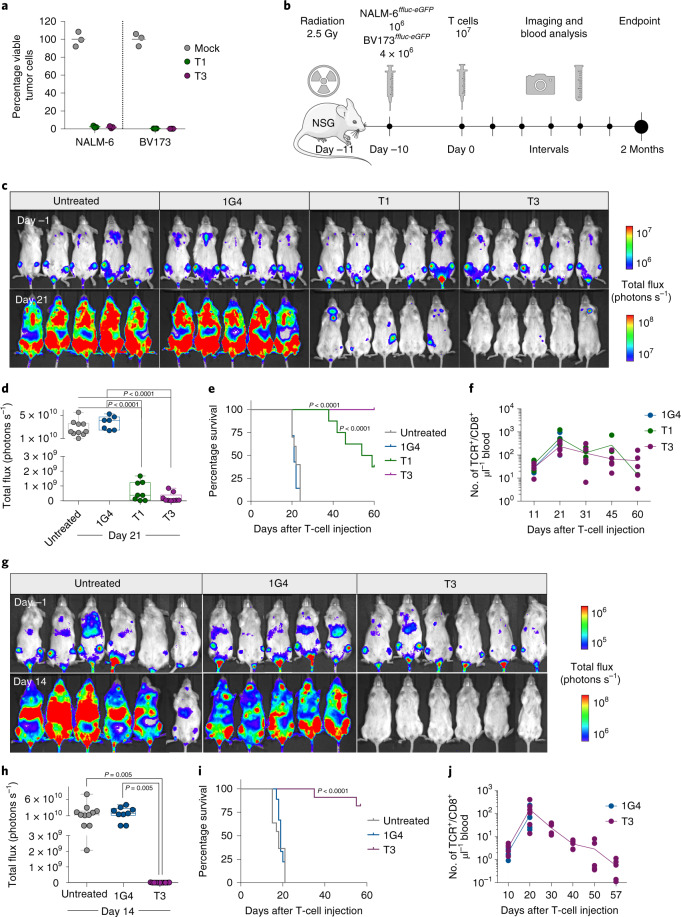
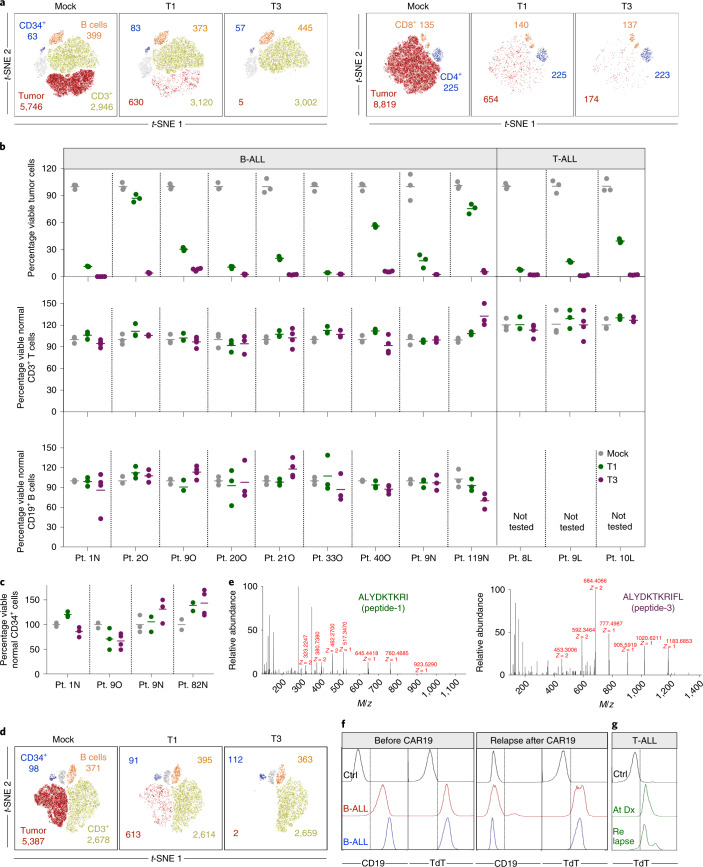
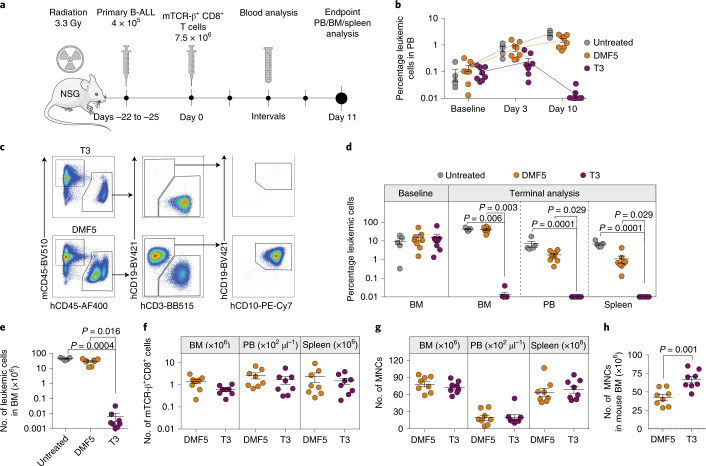
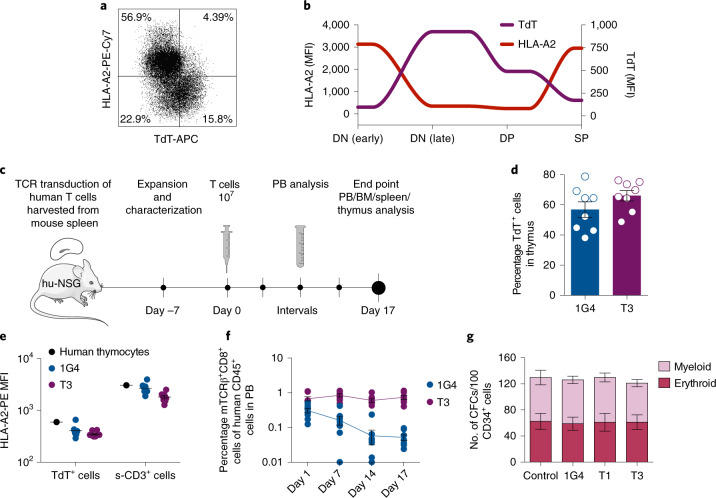
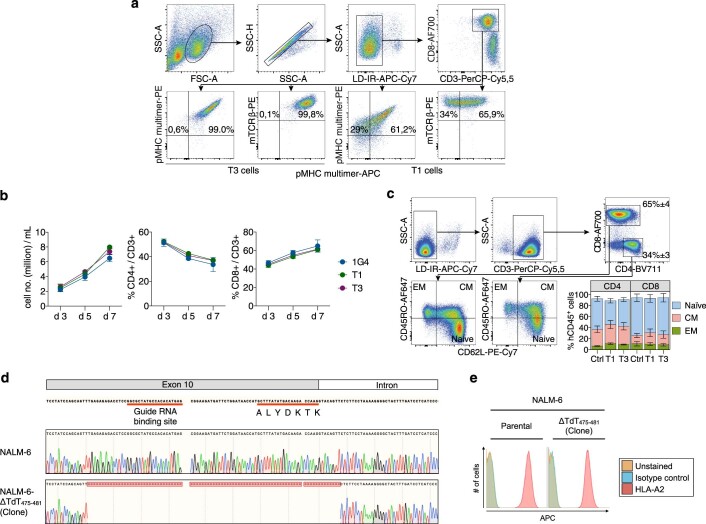
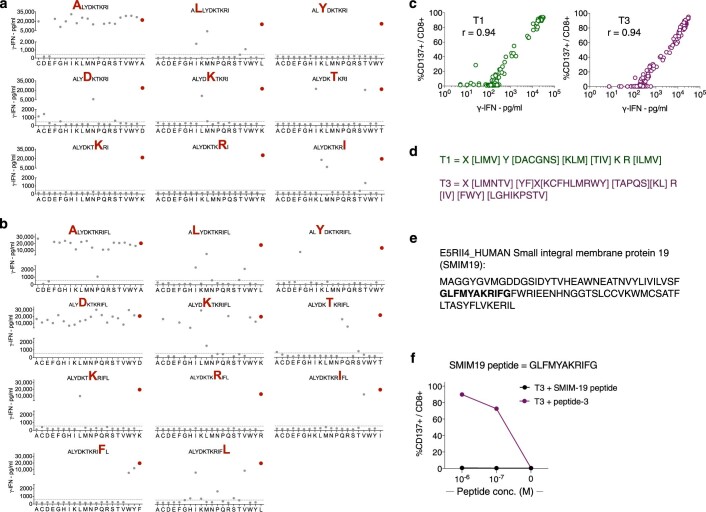
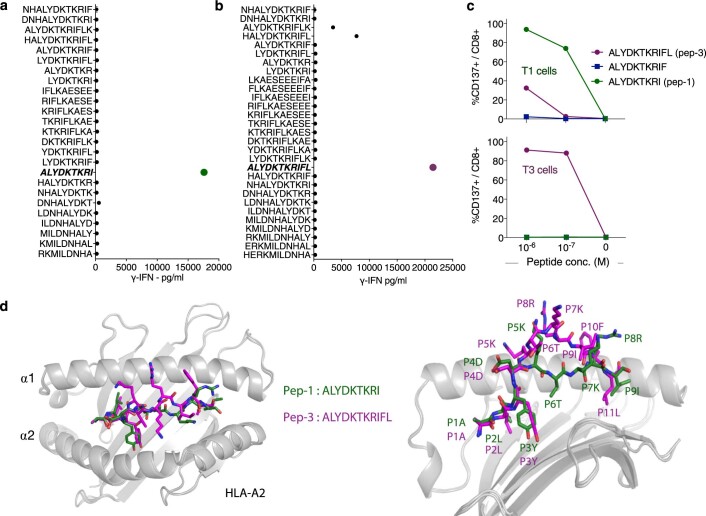
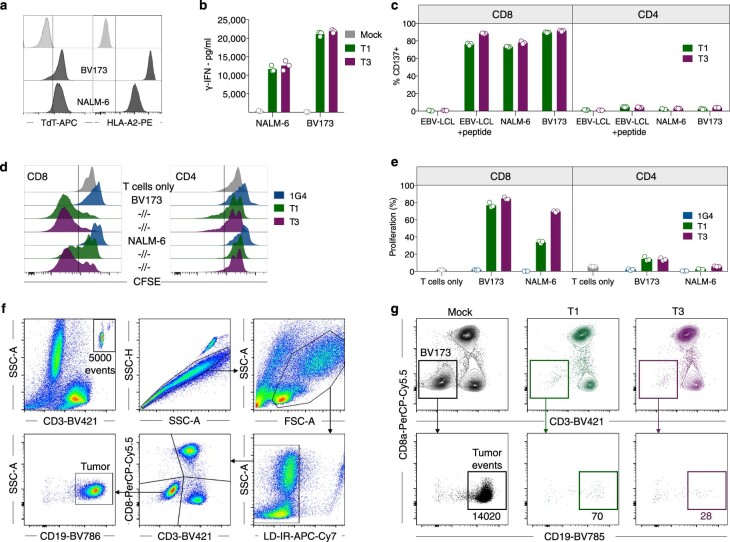
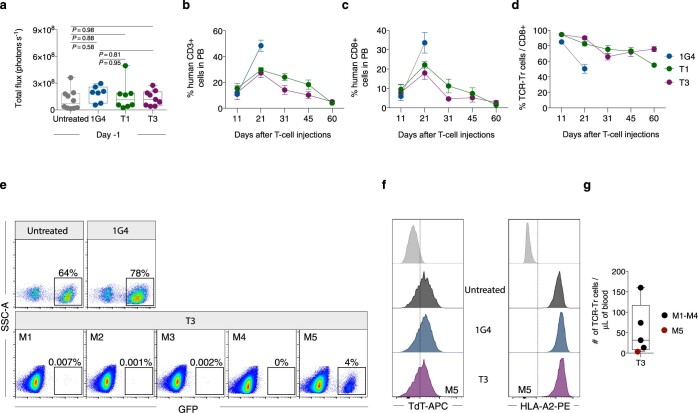
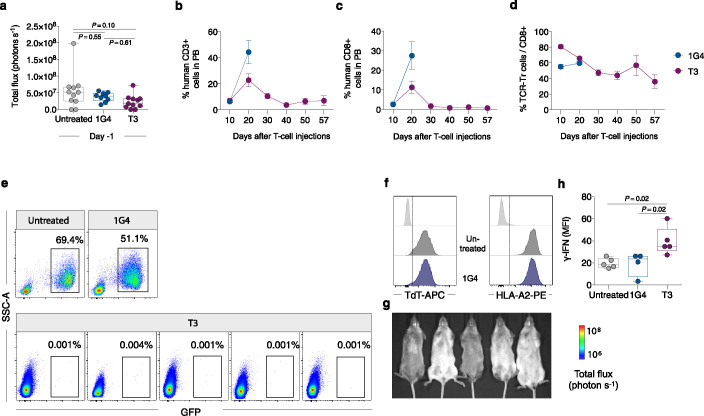
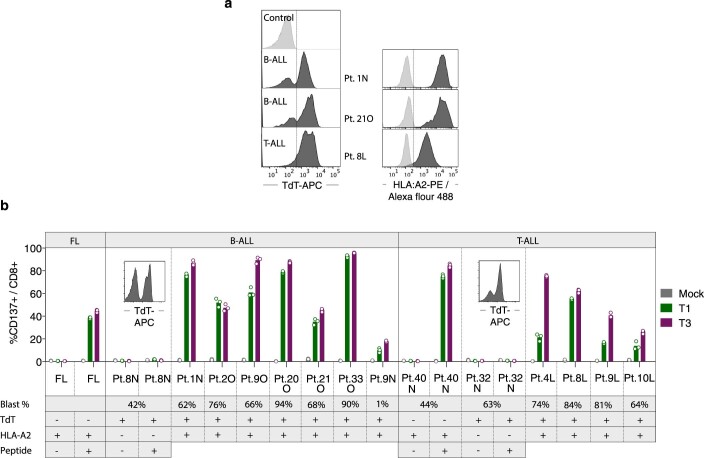
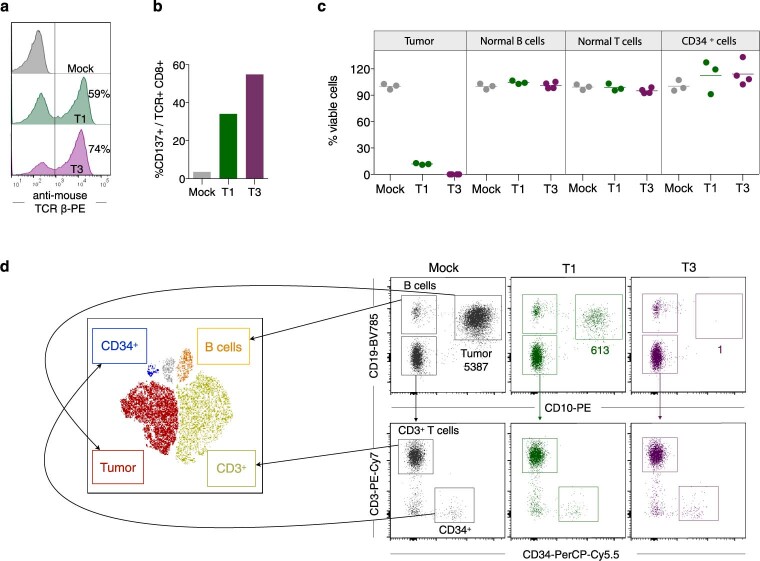
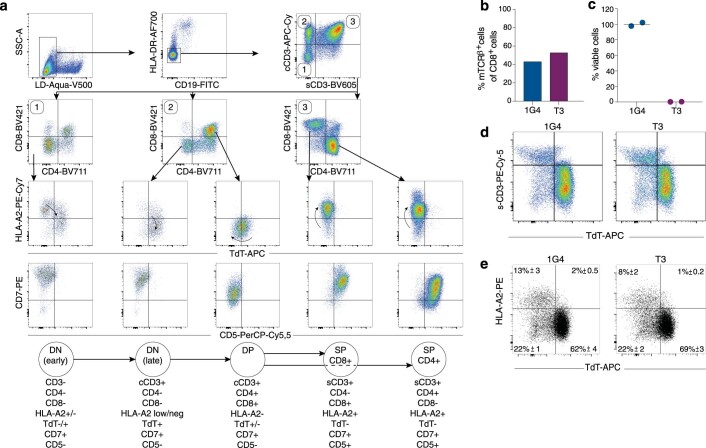
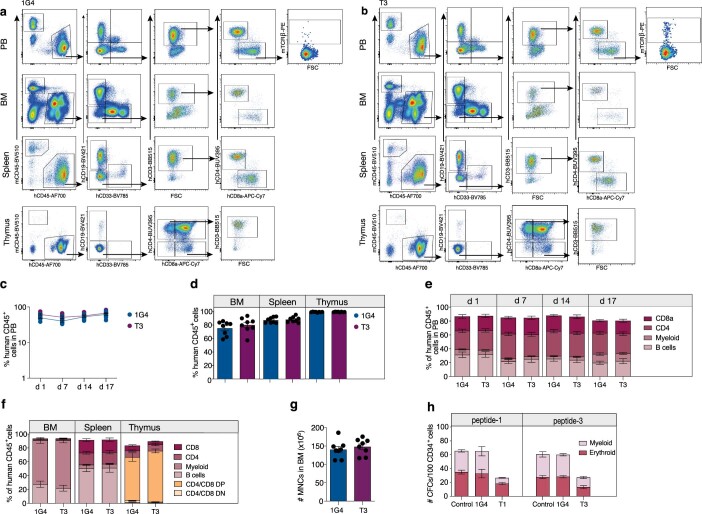
Unlike chimeric antigen receptors, T-cell receptors (TCRs) can recognize intracellular targets presented on human leukocyte antigen (HLA) molecules. Here we demonstrate that T cells expressing TCRs specific for peptides from the intracellular lymphoid-specific enzyme terminal deoxynucleotidyl transferase (TdT), presented in the context of HLA-A*02:01, specifically eliminate primary acute lymphoblastic leukemia (ALL) cells of T- and B-cell origin in vitro and in three mouse models of disseminated B-ALL. By contrast, the treatment spares normal peripheral T- and B-cell repertoires and normal myeloid cells in vitro, and in vivo in humanized mice. TdT is an attractive cancer target as it is highly and homogeneously expressed in 80-94% of B- and T-ALLs, but only transiently expressed during normal lymphoid differentiation, limiting on-target toxicity of TdT-specific T cells. TCR-modified T cells targeting TdT may be a promising immunotherapy for B-ALL and T-ALL that preserves normal lymphocytes.


Conflict of interest statement

J.O. has a research collaboration with Kite Pharma/Gilead, Inc., and a patent application by the institutional technology transfer office Inven2 was filed (patent application number 2113437.4) that covers TCR receptor sequences (inventors J.O. and M.A.). T.N.S. is a consultant for Adaptive Biotechnologies, AIMM Therapeutics, Allogene Therapeutics, Merus, Neogene Therapeutics, Neon Therapeutics and Scenic Biotech; is a recipient of grant/research support from MSD, Bristol-Myers Squibb and Merck KGaA; is a stockholder in AIMM Therapeutics, Allogene Therapeutics, Merus, Neogene Therapeutics and Neon Therapeutics; and is venture partner at Third Rock Ventures. G.E.T. has received research support from Mundipharma and lecture honoraria from Mundipharma, Abbvie, Janssen-Cilag, Alexion Pharmaceuticals and Roche Norway. The remaining authors declare no competing interests.

Figures

Fig. 1
Fig. 1. Discovery of CD8+ T-cell clones reactive to TdT peptides presented on HLA-A2.
a, Illustration of TdT expression during lymphoid differentiation. b, Mass to charge (m/z) ratio spectra of TdT peptide-1 and -3. c, Intracellular staining of TdT in HLA-A2pos moDCs after electroporation with mRNA encoding full-length TdT (red) or irrelevant control mRNA (black). HLA-A2pos moDCs were then cocultured with HLA-A2neg naïve CD8+ cells. d, Staining of CD8+ T cells with pMHC multimers complexed with peptide-1 or -3 (each multimer conjugated to both APC and PE, gating strategy shown in Extended Data Fig. 1a) following cocultures with moDCs transfected with TdT or control mRNA. e, Staining of T-cell clones reactive to peptide-1 (clones 1–4) and peptide-3 (clone 1) showing the relevant pMHC multimers (green and purple) and corresponding nonrelevant pMHC multimers (black). f, Upregulation of CD137 on T-cell clones reactive to peptide-1 (green, clones 1–4) and peptide-3 (purple, clone 1) following coincubation with TdTnegHLA-A2pos EBV-LCL cells pulsed with indicated concentrations of cognate peptides, or the B-ALL cell line NALM-6, naturally positive for TdT and HLA-A2. conc., concentration. Source data
Fig. 2
Fig. 2. T1 and T3 are specific for TdT and HLA-A2 and do not show off-target reactivity.
a, Histograms of viable CD8+ T cells transduced with T1 and T3 TCRs stained with anti-mouse TCR-β antibody or relevant peptide–MHC multimers. b, Activation of T1 and T3 cells following coincubation with peptide-pulsed T2 lymphoblast cells. Data are pooled from three independent experiments, with each circle representing the mean of three technical replicates in each experiment. Data are shown as mean ± s.d. c, CD137 upregulation on CD8+ T1 (green) and T3 (purple) cells after coculture with EBV-LCLs derived from one HLA-A2pos and one HLA-A2neg donor, either pulsed with relevant peptides or electroporated with mRNA encoding full-length TdT. d, Activation of CD8+ T1 and T3 cells after coculture with TdTpos cell lines REH (B-ALL) and HPB-ALL (T-ALL) in the presence/absence of introduced expression of HLA-A2, or pan-MHC class I blocking antibody W6/32 (Ab). e, IFN-γ production by T1 and T3 cells following coincubation with TdTpos NALM-6 cells (WT), or NALM-6 cells in which TdT475-481 was deleted by CRISPR–Cas9 (KO) in the presence/absence of added peptide. f, Activation of T1 and T3 cells after coculture with various cell lines, with indicated HLA-A2 and TdT expression, loaded or not with TdT peptides (2 × 10−7 M). The suffix + A2 denotes cell lines transduced with HLA-A*02:01. cf, Results are from one experiment representative of two or three performed with different T-cell donors. Bars or connecting lines show mean, and individual data points represent either two (e) or three (c,d,f) technical replicates. g, Heat maps of IFN-γ produced by T1 (green) and T3 cells (purple) coincubated with EBV-LCLs pulsed with peptides from mimotope libraries. White circles, amino acid in wild-type peptide. IFN-γ concentration range for positive reactions was 500–31,254 pg ml–1. One replicate per condition (see Extended Data Fig. 2c for correlation with CD137 activation assay). h, Model structures of TdT peptide-1 (green) and -3 (purple) represented as sticks, bound to the HLA-A2 molecule, in gray, shown from top (left) and side views (right). Individual amino acids are labeled with positional number and symbol. Source data
Fig. 3
Fig. 3. T1 and T3 cells efficiently kill leukemia cells in vivo.
a, Viable TdTposHLA-A2pos NALM-6 and BV173 cells after 48 h of coculture with T1 and T3 cells (E/T ratio, 1/1), in percentage of corresponding numbers following treatment with mock-transduced T cells as quantified by flow cytometry. Data points represent technical replicates in one experiment representative of three performed. b, Experimental overview of BV173 and NALM-6 in vivo models. BLI (c) and quantification (d) of BV173-bearing mice 1 day before and 21 days after treatment with human T cells transduced with 1G4, T1 or T3, or left untreated. Survival analysis (e) and numbers (f) of TCR-transduced CD8+ T cells μl1 blood at indicated time points in the aforementioned experimental groups. BLI (g) and quantification (h) of NALM-6-bearing mice 1 day before and 14 days after treatment with human T cells transduced with 1G4, T3, or left untreated. Survival analysis (i) and numbers (j) of TCR-transduced CD8+ T cells μl1 blood at indicated time points in the aforementioned experimental groups. d,e,h,i, Data are pooled from two independent experiments: untreated, n = 10 (BV173) or n = 11 (NALM-6); 1G4, n = 7 (BV173) or n = 9 (NALM-6); T1, n = 8 (BV173); T3, n = 9 (BV173) or n = 11 (NALM-6). d,h, Box plots showing interquartile range (25th–75th percentile) with central bar indicating the median and whiskers indicating the range. Dots represent individual mice and data analyzed by one-way ANOVA with adjustment for multiple comparisons with Tukey’s post-test. e,i, Survival analysis performed by two-sided log-rank (Mantel–Cox) test. f,j, Data shown are from one representative experiment out of two performed. n = 5–6 mice per group. Connecting lines, mean; dots, individual mice. Source data
Fig. 4
Fig. 4. T1 and T3 cells deplete patient-derived cancer cells while sparing normal B and T lymphocytes and nonlineage-committed hematopoietic progenitor cells.
a, Representative t-SNE plots showing live HLA-A2pos, TdTpos B-ALL tumor cells (CD19+CD10+ events, left) and T-ALL tumor cells (CD5+CD7+CD99+ and surface CD3CD4 events, right), normal B cells (CD19+CD10), normal T cells (CD3+ and CD8+ or CD4+) and CD34+lin progenitor cells following 72 h of coculture with mock-, T1- or T3-transduced T cells (E/T ratio, 1/1), as quantified by flow cytometry. b, Diagnostic samples from 12 patients (Pt.) with HLA-A2pos, TdTpos B-ALL or T-ALL, assayed as described in a. Each dot represents the number of live tumor, normal B or T cells after coculture with T1 (green) or T3 (purple) cells, as percentage of corresponding numbers in cultures treated with mock-transduced T cells (gray). c, Dots showing numbers of live CD34+lin cells after coculture with T1 (green) and T3 (purple) cells as percentage of corresponding numbers in cocultures treated with mock-transduced T cells (gray). b,c, Data points represent three or four technical replicates and horizontal lines denote mean. Data shown are from one experiment representative of at least two performed for each patient sample. d, t-SNE plot of PB diagnostic sample from B-ALL patient no. 1N after 72 h of coculture with autologous T cells transduced with T1, T3 or mock. a,d, Inset numbers denote absolute event counts of the indicated cell populations. e, Tandem mass spectrometry fragmentation spectra of TdT peptide-1 and -3 identified from leukemia cells of patient no. 119N. f, Expression of CD19 and TdT in leukemia cells before and after relapse from CD19-specific CAR T-cell therapy in two patients with B-ALL. Ctrl, control. g, Expression of TdT in leukemia cells from a patient with T-ALL at the time of primary diagnosis (Dx) and at relapse after chemotherapy. Source data
Fig. 5
Fig. 5. T3 cells efficiently eliminate primary B-ALL cells in vivo.
a, Experimental overview of the PDX model. b, Percentage leukemic cells adjusted for human T cells in PB at baseline and at indicated time points after T-cell infusion. c, Representative FACS plots of viable single MNCs from BM of T3-treated (top) and DMF5-treated (bottom) NSG mice engrafted with primary human B-ALL cells. d, Percentage leukemic cells (hCD45+CD19+CD10+) adjusted for human T cells at baseline (BM) and at terminal analysis on day 11 after T-cell infusion (BM, PB and spleen). e, Number of leukemic cells present in BM. f, Number of TCR-transduced human CD8+ cells in BM, PB and spleen. g, Total numbers of human- and mouse-derived MNCs in BM, PB and spleen. h, Number of mouse CD45+ cells in BM. b,dh, Data are pooled from two independent experiments and presented as mean ± s.e.m. of untreated (n = 5), DMF5-treated (n = 8) and T3-treated (n = 8) mice. Populations identified by flow cytometry according to gating strategy shown in c. Kruskal–Wallis one-way ANOVA by Dunn’s multiple comparisons test (d,e) and two-tailed Mann–Whitney test (fh) were performed for statistical analyses. Source data
Fig. 6
Fig. 6. T3 cells preserve healthy hematopoiesis in vivo.
a,b, FACS analysis of viable human CD19HLA-DRneg thymocytes (a), and spaghetti-plot illustrating HLA-A2 and TdT mean fluorescence intensity (MFI) at distinct stages of T-cell development (b), defined as shown in Extended Data Fig. 9a, in human thymus. c, Experimental overview of humanized NSG (hu-NSG) mouse model used to investigate the effect of T3-cell therapy on healthy human hematopoiesis. d, Percentage of human TdTpos cells in thymus of hu-NSG mice (n = 8 per group). e, HLA-A2 mean fluorescence intensity of TdTpos cells (hCD45+ TdTpos) and surface CD3+ (s-CD3+) human thymocytes derived from one normal human thymus and from thymus of 1G4 (n = 8) and T3 (n = 8)-treated humanized mice. f, Percentage of TCR-transduced CD8+ cells in PB at indicated days after T-cell infusion (n = 8 per group). g, Myeloid and erythroid colonies generated from sorted normal adult human BM CD34+ cells (n = 4 biological replicates, data pooled from two independent experiments) following coculture with or without 1G4, T1 or T3 cells for 72 h at an E/T ratio of 2/1. All data are presented as mean ± s.e.m.; dots in df represent individual mice at terminal analysis on day 17 post treatment, unless otherwise stated. Source data
Extended Data Fig. 1
Extended Data Fig. 1. T1 and T3 cells maintain a predominantly naïve/CM phenotype following expansion.
(a) Gating strategy to analyze TCR transduced T cells (percentage of parental gate is shown). Top four panels: gating on FSC/SSChigh, Live/Dead Fixable Near-IRneg, CD8+ singlets. Lower four panels: cells staining positively for APC and PE-labeled pMHC multimers complexed with either peptide-3 (left two plots: T3-transduced cells) or peptide-1 (right two plots: T1-transduced cells) and anti-mouse TCR-β antibody. Although >90% of T1 cells stain positively for the pMHC-PE multimer, a lower % was positive for the corresponding APC multimer due to lower fluorescence intensity of APC relative to PE. (b) Expansion of PB T cells after transduction with T1, T3 or 1G4 at indicated days after retroviral transduction. Data shown as mean ± s.e.m. of n = 3 (d3 and d7) or n = 2 (d5) HLA-A2pos donors. (c) FACS plots showing phenotyping of T cells transduced with T1 on day 7 after spinoculation, gating on FSC/SSChigh, Live/Dead Fixable Near-IRneg, CD3+ singlets, that are either CD4+ or CD8+. Naïve, CM (central memory) and EM (effector memory) T cells. Bar graph in the lower right corner shows proportion of naïve, CM and EM CD4+ or CD8+ T cells on d7 after retroviral transduction with T1, T3 or control TCR. Inset numbers in the top right plot represent mean ± s.e.m. of all groups analyzed together due to similar proportions of CD8+ and CD4+ T cells in experimental groups. Data shown as mean ± s.e.m. of n = 3 donors. (d) Top: The region of gDNA in exon 10 which ends with the first 7 amino acids of the A2-presented epitope, selected as binding site for guide RNA. Middle: sequencing of gDNA from wild type NALM-6 cells, in which the TdT sequence corresponds to the sequence deposited in the database. Bottom: after cloning of CRISPR/Cas9-modified NALM-6 cultures, the selected clone shows a clean deletion in both alleles of the TdT gene, including the first 7 amino acids of the A2-presented epitope. (e) HLA-A2 expression on NALM-6 cells with TdT knock out (right) is unaffected relative to parental cell line (left). Source data
Extended Data Fig. 2
Extended Data Fig. 2. Comprehensive mapping of peptide reactivity does not reveal naturally existing peptides to which T1 or T3 cells cross-react.
(a,b) Graphs depicting IFN-γ response of T1 (a) and T3 (b) cells to EBV-LCLs loaded with individual peptides from mimotope libraries containing a total of 161 9-mers for peptide-1 and 201 11-mers for peptide-3, at a concentration of (2 x 10⁻⁷ M). Red dot in each graph represents response to wild-type peptide. Substituted amino acid in the original peptide is highlighted in red in the graph heading. IFN-γ concentration range for positive reactions was 500 – 31254 pg/mL (cut-off indicated by horizontal lines, one replicate per condition). (c) Correlation analysis between data for IFN-γ release, and percentage of cells expressing CD137, by T1 (left) and T3 cells (right) following activation by EBV-LCLs loaded with individual peptides from the mimotope libraries. r = Pearson correlation coefficient. (d) Peptide reactivity motifs for T1 and T3 that were queried in the ScanProsite search tool against human proteome databases. X indicates that any amino acid is allowed, while amino acids in square brackets [] indicate alternatives that are allowed for that given position in the peptide motifs. (e) Amino acid sequence of the human small integral membrane protein 19 (SMIM19), as listed in the non-curated TrEMBL database. (f) Percentage CD137+ events among T3 CD8+ T cells after 18 h co-culture with target cells loaded with indicated concentrations of either peptide-3 or SMIM19 peptide. Data are shown as mean of three technical replicates from one experiment representative of 2 performed. Source data
Extended Data Fig. 3
Extended Data Fig. 3. T1 and T3 cell activation in response to length variants of cognate peptides and model of structural conformation of TdT peptides in the HLA-A2 peptide-binding groove.
(a,b) IFN-γ production by the T1 (a) and T3 (b) cells after co-culture with target cells loaded with indicated peptides. 9-mer and 11-mer peptides were included that contained amino acids upstream or downstream of the wild type peptide-1 and -3 in the TdT protein sequence. In addition, 8 to 12 amino acid long peptides were included that contained parts or all of peptide-1 and -3. One replicate per condition. (c) Percentage of CD137+ events among T1 and T3 cells after co-culture with EBV-LCLs loaded with indicated concentrations of cognate, or non-cognate, peptide-1 (ALYDKTKRI) or -3 (ALYDKTKRIFL). Reactivity to a 10-mer peptide (ALYDKTKRIF) is also shown. One replicate per condition. Data shown are from one experiment representative of 2 performed. (d) Overlaid structural conformations of peptide-1 and -3 bound to the HLA-A2 molecule shown from top (left) and side view (right). HLA-A2 is shown as cartoon in gray. Peptide-1 (green) and peptide-3 (purple) are shown as stick. Individual amino acids are labeled as a number in the corresponding peptide followed by their symbol. The modeled peptide-1 on HLA-A2 displays a flattened conformation, and amino acids at position (P)4, P5, P7 and P8 are facing up for potential TCR engagement. The model is supported by the mimotope reactivity pattern, as T1 was intolerant to mutations in P4, P5, P7 and P8. Although P3Y is not facing upward for TCR contact, it is likely to stabilize the peptide-MHC interaction and is thus sensitive to mutations. The P4, P5, P7 and P8 as core TCR contact residues are salient features for 9-mer peptides presented by HLA-A2. Peptide-3 displays a bulged conformation, in which P4, P5, P6, P7, P8, P9 residues are facing upwards for TCR contact. P4D and P5K are less important for TCR engagement than for peptide-1, as P4D can be substituted by almost any amino acid and P5K can be substituted by amino acids with long or bulky side chains. P6-P10 are potentially important for TCR contact, and as shown in our cross-reactivity assay, T3 was less tolerant for substitutions of these amino acids. Source data
Extended Data Fig. 4
Extended Data Fig. 4. T1 and T3 cells are activated by, and effectively kill, TdTpos HLA-A2pos leukemia cell lines.
(a) Flow cytometry histograms showing natural TdT or HLA-A2 expression in the B-ALL cell lines NALM-6 and BV173. (b) IFN-γ production in the co-culture supernatants of T1, T3 or mock T cells with indicated cell lines as measured by ELISA. (c) Expression of CD137 measured by flow cytometry by T1 and T3 cells after 18 h co-culture with indicated cell lines, loaded or not with relevant peptide and gated on CD8+ or CD4+ T cells. (d,e) Proliferation of PB T cells following transduction of T1, T3 or 1G4 in response to NALM-6 and BV173 following 5 days of co-culture at an E/T ratio of 1/1. Percentage proliferating cells is calculated based on events with low Cell Trace Violet staining out of total events that are FSC/SSChigh, Live/Dead Fixable Near-IRneg, CD3+ singlets staining positively for either CD8+ or CD4+. Bar graphs in (b), (c) and (e) show mean of three technical replicates from one experiment representative of 2 or 3 performed. (f) Gating strategy for the flow cytometry-based killing assay to enumerate BV173 tumor cells, here co-cultured with mock-transduced cells. Fluorescent beads (10,000) were added into each well and 5,000 beads were acquired for flow cytometry analysis. Live BV173 tumor cells were identified as Live/Dead Fixable Near-IRneg singlet cells that were CD3, CD8 and CD19+. (g) Flow cytometry plots of BV173 cells co-cultured with mock (black), T1 (green) and T3 cells (purple) for 48 h. Inset numbers display event counts within the live tumor cell gate. Source data
Extended Data Fig. 5
Extended Data Fig. 5. T1 and T3 cells proliferate and control BV173 ALL in vivo.
(a) Bioluminescence imaging (BLI) analysis of NSG mice on day 9 after BV173ffluc-eGFP cell injection, one day prior to T-cell therapy. Data were pooled from two independent experiments, untreated n = 10, 1G4 n = 7, T1 n = 8, T3 n = 9. Data analysis by one-way ANOVA with Tukey’s multiple comparison test. (b,c) The percentage of human CD3+ (b) and CD8+ cells (c) in PB of mice analyzed at indicated time points out of total CD45+ human and CD45+ mice leukocytes. (d) Percent cells expressing T1, T3 and 1G4 TCRs among human CD8+ T cells throughout the experiment. Data in b-d are shown as mean ± s.e.m., n = 5/group. (e) Flow cytometry plots showing bone-marrow tumor burden in five T3-treated mice analysed on day 60 (M1-M5), compared to the 1G4-treated or untreated mouse at time of sacrifice (day 21). Threshold for positive leukemia detection was set as GFP+ cells ≥ 0.01% of live viable cells. (f) Expression of HLA-A2 and TdT in leukemia cells harvested from the bone marrow of untreated, 1G4 and the one T3-treated mouse with detectable tumor burden (M5). Light gray histograms represent negative control. (g) Numbers of TCR-transduced CD8+ cells in blood of T3-treated mice on day 60 (n = 5, M1-4: black circles, M5: red circle). Box plots in (a) and (g) show interquartile range (25th to 75th percentile) with central bar indicating the median and whiskers indicating the range while dots represent data from individual mice. Source data
Extended Data Fig. 6
Extended Data Fig. 6. T3 cells proliferate and control NALM6 ALL in vivo.
(a) BLI analysis of NSG mice on day 9 after NALM-6ffluc-eGFP cell injection, one day prior to T-cell therapy. Data were pooled from two independent experiments, untreated n = 11, 1G4 n = 9, T3 n = 11. Data analysis by one-way ANOVA with Tukey’s multiple comparison test. (b,c) The percentage of human CD3+ (b) and CD8+ cells (c) in peripheral blood (PB) of mice analyzed at indicated time points out of total CD45+ human and CD45+ mouse leukocytes. (d) Percent cells expressing T3 and 1G4 TCRs among human CD8+ T cells throughout the experiment. Data in b-d are shown as mean ± s.e.m., n = 5 (1G4) and n = 6 (T3). (e) Flow cytometry plots showing bone-marrow tumor burden in one untreated and one 1G4-treated mice at time of sacrifice (day 14), and in five T3-treated mice sacrificed at end of experiment (day 57). (f) Expression of HLA-A2 and TdT in leukemia cells detected in bone marrow of untreated and 1G4-treated mice at the time of sacrifice. Light gray histograms represent negative control. (g) BLI images of mice in T3-treated group on day 57. Two of the T3-treated mice died for unknown reasons on day 35 and day 55 after T cell therapy, following negative BLI and PB flow cytometry analysis 5 days earlier, respectively, indicating that death was not related to leukemia. (h) IFN-γ levels in sera from untreated (n = 5), 1G4 (n = 4) or T3 (n = 5) cell-treated mice on day 2 after T cell therapy, measured as mean fluorescence intensity (MFI) of IFN-γ capturing fluorescent beads. Statistical analysis by one way ANOVA with Tukey’s multiple comparison test. Box plots in (a) and (h) show interquartile range (25th to 75th percentile) with central bar indicating the median and whiskers indicating the range, while dots represent data from individual mice. Source data
Extended Data Fig. 7
Extended Data Fig. 7. Primary patient B-ALL and T-ALL cells express TdT and activate T1 and T3 cells.
(a) TdT and HLA-A2 expression in diagnostic samples (PBMC) from three representative patients with B-ALL and T-ALL as analyzed by flow cytometry. Cytotoxicity data for these patients are shown in Fig. 4a, b. (b) Percentage of CD137+ events among T1, T3 and mock-transduced CD8+ cells after 18 h culture with primary B-ALL and T-ALL patient samples that were either HLA-A2pos TdTneg, HLA-A2neg TdTpos or HLA-A2pos TdTpos. Single positive patient samples were loaded or not with peptide-1 or -3 (concentration 10−7 M) for 1 h before co-culture with corresponding T1 or T3 cells. FL: Follicular lymphoma, included as an HLA-A2pos TdTneg control. Numbers below patient index show percentages of malignant blasts in the patient sample as analyzed by flow cytometry. Bar graphs in (b) show mean of 2-3 technical replicates run for individual patients. Source data
Extended Data Fig. 8
Extended Data Fig. 8. Patient-derived CD8+ T cells transduced with T1 or T3 efficiently kill autologous B-ALL cells.
(a) Transduction efficiency of the T1 (green) and T3 (purple) TCRs in normal CD8+ T cells from an HLA-A2pos TdTpos patient diagnosed with B-ALL. Histograms are gated on live, CD8+ T cells. (b) T1 and T3 cell activation after 18 h co-culture with the autologous blasts. (c) Quantification of malignant cells, normal B, T and CD34+lin progenitor cells after performing the flow cytometry-based cytotoxicity assay for 72 h. Data points represents technical replicates (3-4) from one representative experiment out of 2 performed and horizontal lines show mean. (d) Flow cytometry dot plots from one of the test replicates in c, showing gating strategy to identify tumor blasts (CD19+CD10+), normal B cells (CD19+CD10), T cells (CD19CD10CD3+) and CD34+ progenitor cells (CD19CD10CD3CD34+). Populations were gated and overlaid on a t-SNE plot with designated colors as indicated (left view). Inset numbers in d show event count of tumor cells after co-culture with mock, T1 and T3 cells. Source data
Extended Data Fig. 9
Extended Data Fig. 9. Expression of TdT and HLA-A2 during T cell development.
(a) Flow cytometric analysis of thymocytes from normal human thymus removed from a four months old child with congenital cardiac defect (but otherwise healthy) in conjunction with cardiac surgery. Flow plots show gating strategy to define four key developmental stages during thymocyte differentiation, including 1) early double negative (DN), 2) late double negative, 3) double positive (DP) and 4) single positive (SP, either CD4+ or CD8+) thymocytes. Arrows within the FACS plots in third row indicate direction of differentiation with regard to expression of TdT and HLA-A2 during these developmental stages, illustrated with continuous lines in Fig. 6b. (b) Percentage of TCR-transduced cells among CD8+ T cells isolated from spleens of three humanized NSG mice engrafted with healthy cord blood following transduction and expansion, prior to infusion into littermates day 0, as illustrated in Fig. 6c. (c) Functionality of human TCR-transduced T cells shown in (b), as determined by the number of viable BV173 cells present after 72 h co-culture, in percent of corresponding numbers following treatment with 1G4 cells, quantified by flow cytometry (E/T ratio of 1/1). Co-cultures were started on the same day as T cells were injected into mice. Data points show 2 technical replicates from one experiment. (d,e) Representative FACS plots of viable single hCD45+CD19CD33 thymocytes from 1G4 or T3-treated humanized NSG mice at terminal analysis on day 17 post T cell infusion illustrating surface CD3 and TdT expression (d) and HLA-A2 and TdT expression (e). Inset numbers show mean ± s.e.m., n = 8 per group. Source data
Extended Data Fig. 10
Extended Data Fig. 10. TdT TCR-transduced cells do not impact normal hematopoiesis in vitro or in vivo.
(a,b) Representative FACS plots from terminal analysis of viable single MNCs in PB, BM, spleen and thymus from humanized NSG mice treated with 1G4 (a) and T3 (b) cells, to determine the percentage of TCR-transduced T cells and lineage distribution (myeloid: CD33+, B cells: CD19+, T cells: CD3+CD4+ or CD3+CD8+). (c,d) Percentage human CD45+ cells (out of human and mouse CD45+ cells) in PB at indicated days after T cell infusion (c), and in BM, spleen and thymus of humanized NSG mice treated with 1G4 or T3 cells at terminal analysis on day 17 (d). (e,f) Percentage lineage distribution within human CD45+ engrafted cells in PB at indicated days after T cell infusion (e) and in BM, spleen and thymus at terminal analysis (f). (g) BM cellularity at terminal analysis. n = 8 per group in c-g. (h) Myeloid and erythroid colonies generated from sorted normal human BM CD34+Lineage cells from one donor co-cultured without T cells (control), or with 1G4, T1 or T3 cells for 48 h in the presence of peptide-1 or peptide-3 at an E/T ratio of 2/1 (2 technical replicates per group). Data are presented as mean ± s.e.m. Source data

References

    1. Maude SL, et al. Tisagenlecleucel in children and young adults with B-cell lymphoblastic leukemia. N. Engl. J. Med. 2018;378:439–448. doi: 10.1056/NEJMoa1709866. - DOI - PMC - PubMed
    1. Grupp SA, et al. Updated analysis of the efficacy and safety of tisagenlecleucel in pediatric and young adult patients with relapsed/refractory (r/r) acute lymphoblastic leukemia. Blood. 2018;132:895–895. doi: 10.1182/blood-2018-99-112599. - DOI
    1. Orlando EJ, et al. Genetic mechanisms of target antigen loss in CAR19 therapy of acute lymphoblastic leukemia. Nat. Med. 2018;24:1504–1506. doi: 10.1038/s41591-018-0146-z. - DOI - PubMed
    1. Shah NN, Fry TJ. Mechanisms of resistance to CAR T cell therapy. Nat. Rev. Clin. Oncol. 2019;16:372–385. - PMC - PubMed
    1. Ghorashian S, et al. Enhanced CAR T cell expansion and prolonged persistence in pediatric patients with ALL treated with a low-affinity CD19 CAR. Nat. Med. 2019;25:1408–1414. doi: 10.1038/s41591-019-0549-5. - DOI - PubMed

Publication types

Substances