Meta-Analysis
. 2021 Dec;53(12):1636-1648.
doi: 10.1038/s41588-021-00973-1. Epub 2021 Dec 6.

Common and rare variant association analyses in amyotrophic lateral sclerosis identify 15 risk loci with distinct genetic architectures and neuron-specific biology

Wouter van Rheenen #  1 Rick A A van der Spek #  2 Mark K Bakker #  2 Joke J F A van Vugt  2 Paul J Hop  2 Ramona A J Zwamborn  2 Niek de Klein  3 Harm-Jan Westra  3 Olivier B Bakker  3 Patrick Deelen  3   4 Gemma Shireby  5 Eilis Hannon  5 Matthieu Moisse  6   7   8 Denis Baird  9   10 Restuadi Restuadi  11 Egor Dolzhenko  12 Annelot M Dekker  2 Klara Gawor  2 Henk-Jan Westeneng  2 Gijs H P Tazelaar  2 Kristel R van Eijk  2 Maarten Kooyman  2 Ross P Byrne  13 Mark Doherty  13 Mark Heverin  14 Ahmad Al Khleifat  15 Alfredo Iacoangeli  15   16   17 Aleksey Shatunov  15 Nicola Ticozzi  18   19 Johnathan Cooper-Knock  20 Bradley N Smith  15 Marta Gromicho  21 Siddharthan Chandran  22   23 Suvankar Pal  22   23 Karen E Morrison  24 Pamela J Shaw  20 John Hardy  25 Richard W Orrell  26 Michael Sendtner  27 Thomas Meyer  28 Nazli Başak  29 Anneke J van der Kooi  30 Antonia Ratti  18   31 Isabella Fogh  15 Cinzia Gellera  32 Giuseppe Lauria  33   34 Stefania Corti  19   35 Cristina Cereda  36 Daisy Sproviero  36 Sandra D'Alfonso  37 Gianni Sorarù  38 Gabriele Siciliano  39 Massimiliano Filosto  40 Alessandro Padovani  40 Adriano Chiò  41   42 Andrea Calvo  41   42 Cristina Moglia  41   42 Maura Brunetti  41 Antonio Canosa  41   42 Maurizio Grassano  41 Ettore Beghi  43 Elisabetta Pupillo  43 Giancarlo Logroscino  44 Beatrice Nefussy  45 Alma Osmanovic  46   47 Angelica Nordin  48 Yossef Lerner  49   50 Michal Zabari  49   50 Marc Gotkine  49   50 Robert H Baloh  51   52 Shaughn Bell  51   52 Patrick Vourc'h  53   54 Philippe Corcia  54   55 Philippe Couratier  56   57 Stéphanie Millecamps  58 Vincent Meininger  59 François Salachas  58   60 Jesus S Mora Pardina  61 Abdelilah Assialioui  62 Ricardo Rojas-García  63 Patrick A Dion  64   65 Jay P Ross  64   66 Albert C Ludolph  67 Jochen H Weishaupt  68 David Brenner  68 Axel Freischmidt  67   69 Gilbert Bensimon  70   71   72   73 Alexis Brice  74 Alexandra Durr  74 Christine A M Payan  70 Safa Saker-Delye  75 Nicholas W Wood  76 Simon Topp  15 Rosa Rademakers  77 Lukas Tittmann  78 Wolfgang Lieb  78 Andre Franke  79 Stephan Ripke  80   81   82 Alice Braun  82 Julia Kraft  82 David C Whiteman  83 Catherine M Olsen  83 Andre G Uitterlinden  84   85 Albert Hofman  85 Marcella Rietschel  86   87 Sven Cichon  88   89   90   91 Markus M Nöthen  88   89 Philippe Amouyel  92 SLALOM ConsortiumPARALS ConsortiumSLAGEN ConsortiumSLAP ConsortiumBryan J Traynor  93   94 Andrew B Singleton  95 Miguel Mitne Neto  96 Ruben J Cauchi  97 Roel A Ophoff  98   99   100 Martina Wiedau-Pazos  101 Catherine Lomen-Hoerth  102 Vivianna M van Deerlin  103 Julian Grosskreutz  104   105 Annekathrin Roediger  104 Nayana Gaur  104 Alexander Jörk  104 Tabea Barthel  104 Erik Theele  104 Benjamin Ilse  104 Beatrice Stubendorff  104 Otto W Witte  104 Robert Steinbach  104 Christian A Hübner  106 Caroline Graff  107 Lev Brylev  108   109   110 Vera Fominykh  108   110 Vera Demeshonok  111 Anastasia Ataulina  108 Boris Rogelj  112   113   114 Blaž Koritnik  115 Janez Zidar  115 Metka Ravnik-Glavač  116 Damjan Glavač  117 Zorica Stević  118 Vivian Drory  45   119 Monica Povedano  62 Ian P Blair  120 Matthew C Kiernan  121 Beben Benyamin  11   122 Robert D Henderson  123   124 Sarah Furlong  120 Susan Mathers  125 Pamela A McCombe  124   126 Merrilee Needham  127   128   129 Shyuan T Ngo  123   124   126 Garth A Nicholson  120   130   131 Roger Pamphlett  132 Dominic B Rowe  120 Frederik J Steyn  124   133 Kelly L Williams  120 Karen A Mather  134   135 Perminder S Sachdev  134   136 Anjali K Henders  11 Leanne Wallace  11 Mamede de Carvalho  21 Susana Pinto  21 Susanne Petri  46 Markus Weber  137 Guy A Rouleau  64   65   66 Vincenzo Silani  18   19 Charles J Curtis  138   139 Gerome Breen  138   139 Jonathan D Glass  140 Robert H Brown Jr  141 John E Landers  141 Christopher E Shaw  15 Peter M Andersen  48 Ewout J N Groen  2 Michael A van Es  2 R Jeroen Pasterkamp  142 Dongsheng Fan  143 Fleur C Garton  11 Allan F McRae  11 George Davey Smith  10   144 Tom R Gaunt  10   144 Michael A Eberle  12 Jonathan Mill  5 Russell L McLaughlin  13 Orla Hardiman  14 Kevin P Kenna  2   142 Naomi R Wray  11   126 Ellen Tsai  9 Heiko Runz  9 Lude Franke  3 Ammar Al-Chalabi  15   145 Philip Van Damme  6   7   8 Leonard H van den Berg  2 Jan H Veldink  146
Collaborators, Affiliations
Meta-Analysis

Common and rare variant association analyses in amyotrophic lateral sclerosis identify 15 risk loci with distinct genetic architectures and neuron-specific biology

Wouter van Rheenen et al. Nat Genet. 2021 Dec.

Erratum in

  • Author Correction: Common and rare variant association analyses in amyotrophic lateral sclerosis identify 15 risk loci with distinct genetic architectures and neuron-specific biology.
    van Rheenen W, van der Spek RAA, Bakker MK, van Vugt JJFA, Hop PJ, Zwamborn RAJ, de Klein N, Westra HJ, Bakker OB, Deelen P, Shireby G, Hannon E, Moisse M, Baird D, Restuadi R, Dolzhenko E, Dekker AM, Gawor K, Westeneng HJ, Tazelaar GHP, van Eijk KR, Kooyman M, Byrne RP, Doherty M, Heverin M, Al Khleifat A, Iacoangeli A, Shatunov A, Ticozzi N, Cooper-Knock J, Smith BN, Gromicho M, Chandran S, Pal S, Morrison KE, Shaw PJ, Hardy J, Orrell RW, Sendtner M, Meyer T, Başak N, van der Kooi AJ, Ratti A, Fogh I, Gellera C, Lauria G, Corti S, Cereda C, Sproviero D, D'Alfonso S, Sorarù G, Siciliano G, Filosto M, Padovani A, Chiò A, Calvo A, Moglia C, Brunetti M, Canosa A, Grassano M, Beghi E, Pupillo E, Logroscino G, Nefussy B, Osmanovic A, Nordin A, Lerner Y, Zabari M, Gotkine M, Baloh RH, Bell S, Vourc'h P, Corcia P, Couratier P, Millecamps S, Meininger V, Salachas F, Mora Pardina JS, Assialioui A, Rojas-García R, Dion PA, Ross JP, Ludolph AC, Weishaupt JH, Brenner D, Freischmidt A, Bensimon G, Brice A, Durr A, Payan CAM, Saker-Delye S, Wood NW, Topp S, Rademakers R, Tittmann L, Lieb W, Franke A, Ripke S, Braun A, Kraft J, Whiteman DC, Olsen CM, Uitterlinden AG, Hofman A, Rietschel M, Cich… See abstract for full author list ➔ van Rheenen W, et al. Nat Genet. 2022 Mar;54(3):361. doi: 10.1038/s41588-022-01020-3. Nat Genet. 2022. PMID: 35102318 Free PMC article. No abstract available.

Abstract

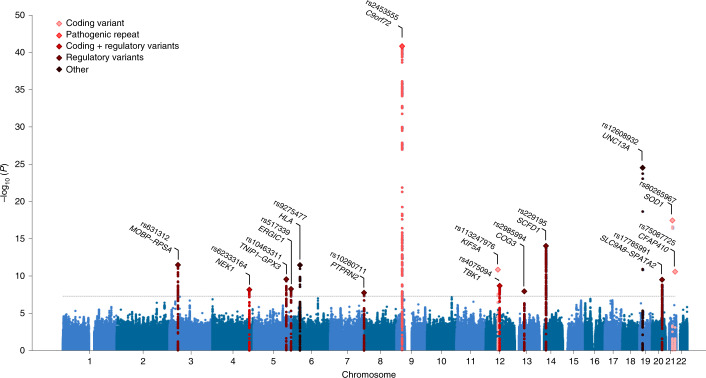
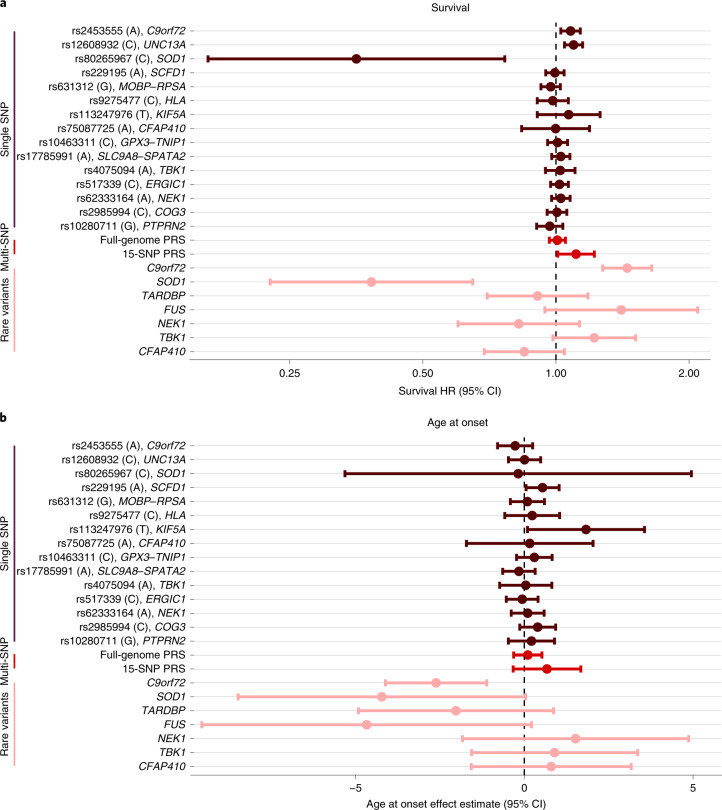
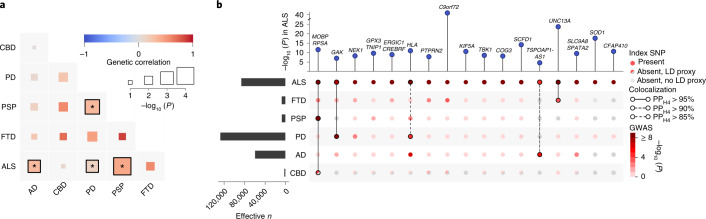
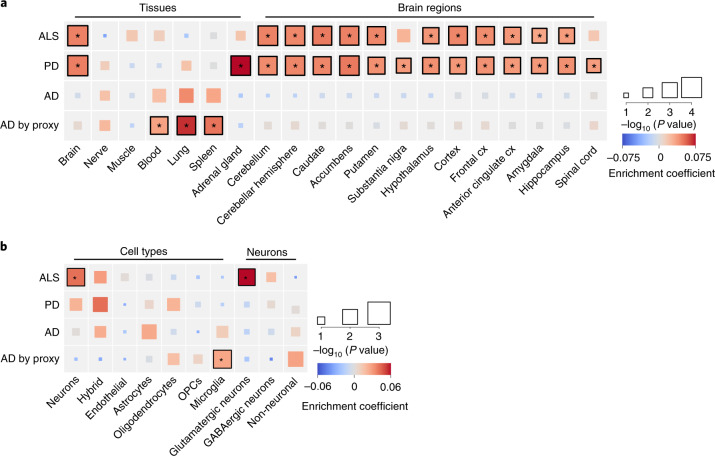
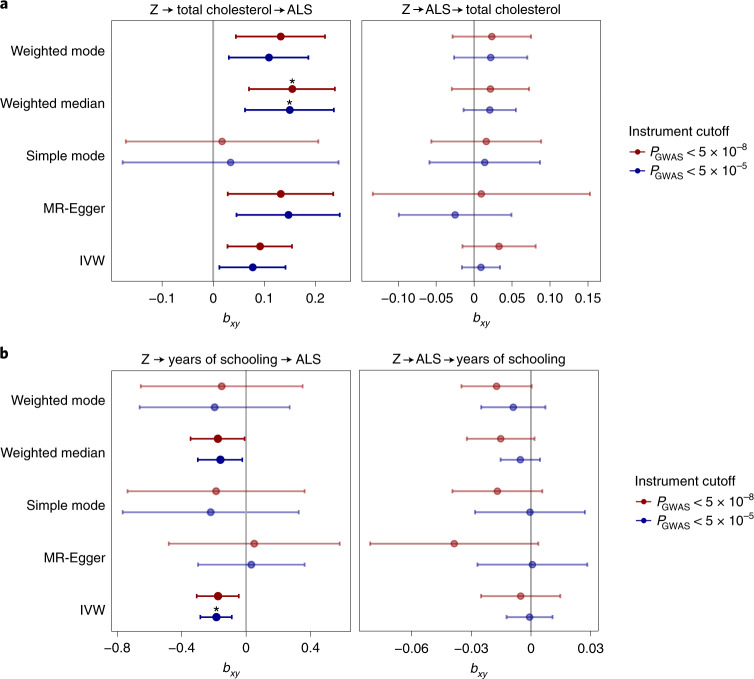
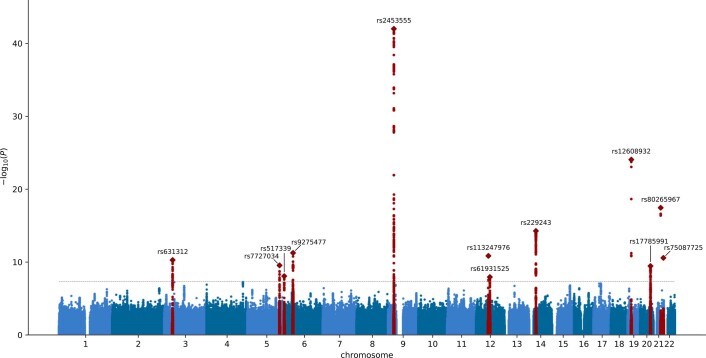
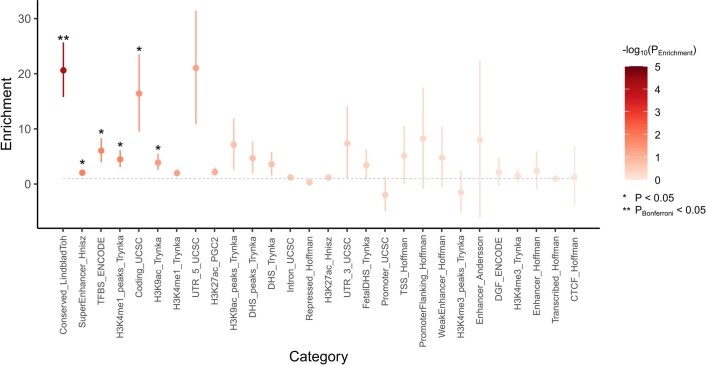
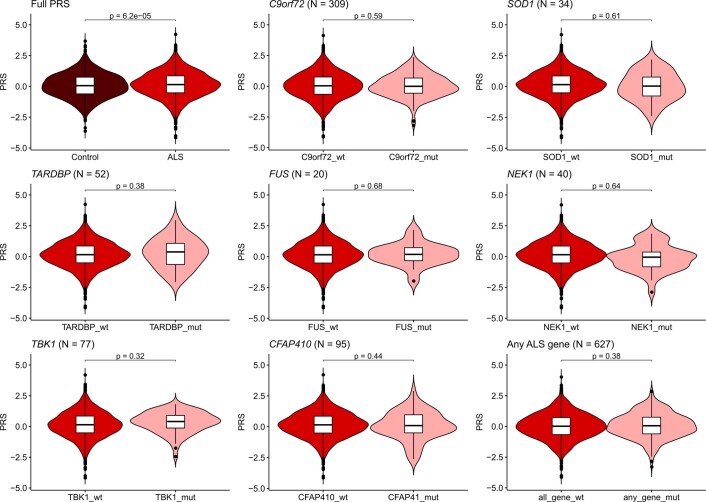
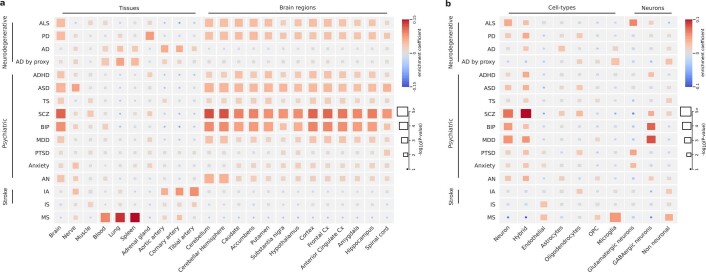
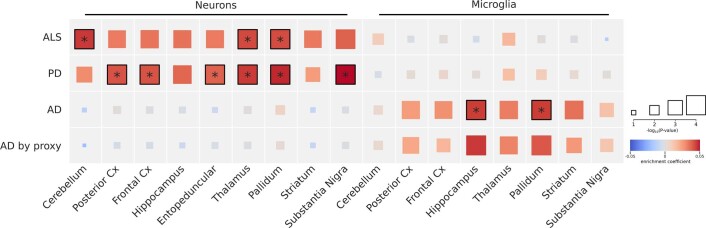
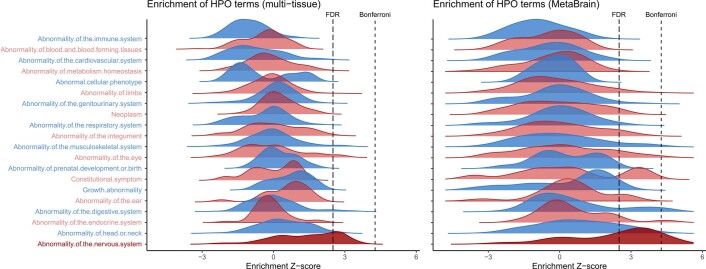
Amyotrophic lateral sclerosis (ALS) is a fatal neurodegenerative disease with a lifetime risk of one in 350 people and an unmet need for disease-modifying therapies. We conducted a cross-ancestry genome-wide association study (GWAS) including 29,612 patients with ALS and 122,656 controls, which identified 15 risk loci. When combined with 8,953 individuals with whole-genome sequencing (6,538 patients, 2,415 controls) and a large cortex-derived expression quantitative trait locus (eQTL) dataset (MetaBrain), analyses revealed locus-specific genetic architectures in which we prioritized genes either through rare variants, short tandem repeats or regulatory effects. ALS-associated risk loci were shared with multiple traits within the neurodegenerative spectrum but with distinct enrichment patterns across brain regions and cell types. Of the environmental and lifestyle risk factors obtained from the literature, Mendelian randomization analyses indicated a causal role for high cholesterol levels. The combination of all ALS-associated signals reveals a role for perturbations in vesicle-mediated transport and autophagy and provides evidence for cell-autonomous disease initiation in glutamatergic neurons.


Conflict of interest statement

J.H.V. has sponsored research agreements with Biogen. L.H.v.d.B. receives personal fees from Cytokinetics outside of the submitted work. A.A.-C. has served on scientific advisory boards for Mitsubishi Tanabe Pharma, Orion Pharma, Biogen, Lilly, GSK, Apellis, Amylyx and Wave Therapeutics. A. Chiò. serves on scientific advisory boards for Mitsubishi Tanabe, Roche, Biogen, Denali and Cytokinetics. J.E.L. is a member of the scientific advisory board for Cerevel Therapeutics, a consultant for ACI Clinical LLC sponsored by Biogen, Inc. or Ionis Pharmaceuticals, Inc. J.E.L. is also a consultant for Perkins Coie LLP and may provide expert testimony. The remaining authors declare no competing interests related to this work.

Figures

Fig. 1
Fig. 1. Manhattan plot of cross-ancestry meta-analysis.
Genome-wide association statistics obtained by IVW meta-analysis of the stratified SAIGE logistic mixed model regression. The y axis corresponds to two-tailed −log10 (Pvalues); the x axis corresponds to genomic coordinates (GRCh37). The horizontal dashed line reflects the threshold for calling genome-wide significant SNPs (P = 5 × 10−8). Color coding and gene labels reflect those prioritized by the gene-prioritization analysis. Labels in bold indicate genes with known highly pathogenic mutations for ALS. SAIGE = Scalable and Accurate Implementation of Generalized mixed model software package. Source data
Fig. 2
Fig. 2. Genetic modifier analyses.
a, Cox proportional HRs for genome-wide significant SNPs (brown, n = 15), PRSs (red, n = 2) and rare variant burden in ALS-risk genes (pink, n = 7) on survival (months) tested in 6,095 patients with ALS. Estimated HRs are displayed with error bars corresponding to 95% CIs. Higher HRs correspond to shorter survival times. b, Effect estimates from a linear regression model of age at onset (years) in 6,095 patients with ALS. Lower effect estimates correspond to a younger age at onset. Effect estimates from linear regression are displayed with error bars corresponding to 95% CIs. The risk-increasing allele for ALS corresponds to the effect allele for both survival and age-at-onset analyses. Source data
Fig. 3
Fig. 3. Shared genetic risk between ALS and neurodegenerative diseases.
a, Genetic correlation analysis. Genetic correlation was estimated with LDSC between each pair of neurodegenerative diseases (ALS, AD, CBD, PD, PSP and FTD). Correlations marked with an asterisk reached nominal statistical significance (PALS,AD = 0.01, PALS,PD = 0.01, PALS,PSP = 0.0001, PPSP,PD = 0.002). b, SNP associations of ALS lead SNPs or LD proxies in neurodegenerative diseases. The association with ALS is shown at the top. Effective sample size is shown on the left. Posterior probabilities of the same causal SNP affecting two diseases were estimated through colocalization analysis and are highlighted as connections. Source data
Fig. 4
Fig. 4. Tissue and cell type enrichment analysis.
a, Enrichment of tissues and brain regions included in GTEx version 8 illustrates a brain-specific enrichment pattern in ALS, similar to that in PD but contrasting with that in AD. Tissues and brain regions displayed are those significantly enriched in ALS or PD, tissues previously reported in AD and tissues of specific interest for ALS (spinal cord, tibial nerve and muscle). Color represents the enrichment coefficient, and size indicates two-sided −log10 (P-values) of enrichment obtained by the linear regression model in the MAGMA gene property analysis. b, Cell type enrichment analyses indicate neuron-specific enrichment for glutamatergic neurons. In ALS, no enrichment was found for microglia or other non-neuronal cell types, contrasting with the pattern observed in AD. Color represents the enrichment coefficient, and size indicates two-sided −log10 (P-values) of enrichment obtained by the linear regression model in the MAGMA gene property analysis. Statistically significant enrichments after correction for multiple testing over all tissues (n = 54), cell types (n = 7) and neurons (n = 3) with FDR < 0.05 are marked with an asterisk. Cx, cortex; GABA, γ-aminobutyric acid; OPCs, oligodendrocyte progenitor cells. Source data
Fig. 5
Fig. 5. Causal inference of total cholesterol levels and years of schooling in ALS.
a, MR results for ALS and total cholesterol levels. Results for the five different MR methods for two different P-value cutoffs for SNP instrument selection are presented. In total, 83 and 178 SNPs were used as instruments at cutoffs of P < 5 × 10−8 and P < 5 × 10−5, respectively. All methods show a consistent positive effect for an increased risk of ALS with higher total cholesterol levels. There is no evidence for reverse causality. Point estimates for MR are presented with error bars reflecting 95% CIs. b, MR results for ALS and years of schooling. In total, 306 and 681 SNPs were used as instruments at cutoffs of P < 5 × 10−8 and P < 5 × 10−5. Point estimates for MR are presented, with error bars reflecting 95% CIs. Statistically significant effects with a two-sided P-value passing Bonferroni correction for multiple testing over all tested traits (n = 22), instrument P-value cutoffs (n = 2) and MR methods (n = 5) are marked with an asterisk (total cholesterol, Pweighted median = 0.0003 and Pweighted median = 0.0007 for cutoffs at P < 5 × 10−8 and P < 5 × 10−5, respectively; years of schooling, PIVW = 0.0002 at the cutoff of P < 5 × 10−5). Here, SNP outliers were not removed for instrument selection. Z, genetic instrument; bxy, estimated causal effect for an increase of 1 s.d. in genetically predicted exposure. Source data
Extended Data Fig. 1
Extended Data Fig. 1. Manhattan plot in European ancestries GWAS.
Genome-wide association statistics obtained by inverse-variance weighted meta-analysis of the stratified SAIGE logistic mixed model regression in European ancestry cohorts. Y-axis corresponds to the two-tailed -log10(P-value), x-axis corresponds to the genomic coordinates (GRCh37). Loci containing a genome-wide significant SNP are highlighted in red. SNP IDs are the top associated SNPs in each locus. The dotted horizontal line reflects the threshold for genome-wide significance (P = 5 × 10⁻⁸). Source data
Extended Data Fig. 2
Extended Data Fig. 2. Annotation specific heritability enrichment.
Enrichment of SNP-based heritability was calculated with LD-score regression. Grey dashed line represents no enrichment (enrichment = 1). Error bars denote standard error of enrichment estimate. Nominal statistically significant enrichment estimates (two-sided P < 0.05) are marked with an asterisk (Conserved_LindbladToh P = 6.5 × 10⁻⁵, SuperEnhancer_Hnisz P = 0.014, TFBS_ENCODE P = 0.017, H3K4me1_peaks_Trynka P = 0.018, Coding_UCSC P = 0.028, H3K9ac_Trynka P = 0.037). The category Conserved_LindbladToh was significant after Bonferroni correction for multiple testing across all categories (N = 28). Due to the regression framework in LDSC, enrichment estimates < 0 are possible (with large standard errors). Source data
Extended Data Fig. 3
Extended Data Fig. 3. PRS stratified by rare variant carrier status.
Distribution of PRS in controls and ALS patients with or without one or more rare variants in ALS risk genes. There was no statistically significant difference in PRS between ALS patients with and without rare variants in ALS risk genes (labeled as gene_mut or gene_wt respectively). In total, 5,112 ALS patients and 2,132 controls from stratum 6 with whole-genome sequencing data available were included. For SOD1, TARDBP, FUS, NEK1, TBK1, and CFAP410, rare variants were included according to the model that yielded the strongest association in the rare variant burden association analyses. For C9orf72, patients with the pathogenic hexanucleotide repeat expansion were compared to those without the expansion. The ‘any ALS gene’ groups all patients together with a rare variant in any of the ALS risk genes. P-values for difference in PRS were derived by two-tailed logistic regression. The number of ALS patients carrying a rare variant per gene is denoted in the corresponding panel. Intervals for boxplots: center = median, box = lower and upper quartile, hinges = median ± 2 * IQR, IQR = interquartile range. Source data
Extended Data Fig. 4
Extended Data Fig. 4. NEK1 repeat distribution.
The frequency of STR alleles in ALS cases and controls are shown. A repeat length of 11 and longer was used as the optimal threshold for disease-associated genotype. The P-value was calculated by Firth logistic regression and FDR correction over all possible thresholds. Y-axis shows the allele frequency of repeat lengths. Repeat position on GRCh37, and repeat motif are shown. Source data
Extended Data Fig. 5
Extended Data Fig. 5. Genetic correlations between brain diseases.
Correlation matrix for genetic correlation estimates obtained from bivariate LD score regression. Colors correspond to genetic correlation estimates. Strongest clusters appear between neurodegenerative diseases and within the psychiatric traits. ALS = amyotrophic lateral sclerosis, FTD = frontotemporal dementia, PSP progressive supranuclear palsy, PD = Parkinson’s disease, CBD = corticobasal degeneration, AD = (clinically diagnosed) Alzheimer’s disease, MS = multiple sclerosis, IS = ischemic stroke (any), ICH = intracerebral hemorrhage, IA = intracranial aneurysm (any), AN = anorexia nervosa, OCD = obsessive compulsive disorder, Anxiety = anxiety disorder (score), PTSD = post-traumatic stress disorder, MDD = major depressive disorder, BIP = bipolar disorder, SCZ = schizophrenia, TS = Tourette’s syndrome, ASD = autism spectrum disorder, ADHD = attention-deficit hyperactivity disorder. Source data
Extended Data Fig. 6
Extended Data Fig. 6. Colocalization signals.
Loci were selected for colocalization analysis when the top associated SNP was associated with any neurodegenerative disease at 5 × 10⁻⁵. For ALS, the European ancestries meta-analysis was used. Bayesian posterior probabilities for a shared variant driving risk of both traits (PPH4) are reported below locus names. Colors reflect LD between the variant and top associated SNP. Source data
Extended Data Fig. 7
Extended Data Fig. 7. Colocalization analysis with FTD subtypes.
Top associated SNPs in the ALS GWAS were selected for colocalization analysis between ALS and FTD subtypes using COLOC. In the top panel, point height is the two-sided -log10(P-value) of the top-associated SNP in the ALS GWAS. In the bottom panel, association P-values of these SNPs with FTD subtypes are shown by color. The Bayesian posterior probability for a shared causal variant between traits (PPH4) is depicted by a connection between points. Source data
Extended Data Fig. 8
Extended Data Fig. 8. Tissue and cell-type enrichment analyses for all brain diseases.
Tissue (a) and cell-type (b) enrichment for all included brain diseases obtained from two-sided MAGMA linear regression. Only brain diseases with exome-wide significant gene-based MAGMA associations (P < 2.7 × 10⁻⁶) were suitable for tissue and cell-type enrichment analyses. The color represents enrichment coefficient and size indicates two-sided -log10(P-value) of enrichment obtained by the linear regression model in the MAGMA gene-property analysis. Due to the large number of significant genes in the gene-based MAGMA analyses for schizophrenia, bipolar disorder and multiple sclerosis the enrichment P-values were truncated at P < 1.0 × 10⁻⁵. ALS = amyotrophic lateral sclerosis, PD = Parkinson’s disease, AD = Alzheimer’s disease, ADHD = attention-deficit hyperactivity disorder, ASD = autism spectrum disorder, TS = Tourette’s syndrome, SCZ = schizophrenia, BIP = bipolar disorder, MDD = major depressive disorder, PTSD = post-traumatic stress disorder, Anxiety = anxiety disorder (score), AN = anorexia nervosa, IA intracranial aneurysm (any), IS = ischemic stroke, MS = multiple sclerosis, Cx = cortex, OPC = oligodendrocyte progenitor cells. Source data
Extended Data Fig. 9
Extended Data Fig. 9. Cell-type enrichment analysis in mice.
Cell-type enrichment analysis using the DropViz single-cell RNA sequencing dataset obtained from mice. Similar to the cell-type enrichment analyses there is neuron-specific enrichment in ALS and Parkinson’s disease. In Alzheimer’s disease microglia are the most enriched cell-types. The color represents enrichment coefficient and size indicates two-sided -log10(P-value) of enrichment obtained by the linear regression model in the MAGMA gene-property analysis. Statistically significant enrichments after correction for multiple testing with a false discovery rate (FDR) < 0.05 are marked with an asterisk. ALS = amyotrophic lateral sclerosis, PD = Parkinson’s disease, AD = Alzheimer’s disease, Cx = cortex. Source data
Extended Data Fig. 10
Extended Data Fig. 10. Human phenotype ontology term enrichment.
Downstreamer enrichment analyses were performed using the multi-tissue and brain-specific co-expression matrix to identify co-regulated ALS-genes. The distribution of enrichment statistics (Z-scores) for all Human phenotype ontology (HPO) terms are plotted per HPO parent branch. The multi-tissue analysis indicates enrichment for the neurology parent branch ‘abnormality of the nervous system’ (dark-red), although no term passes the Bonferroni threshold for multiple testing. The brain-specific analysis illustrates stronger enrichment for the neurology parent branch. In total, 58 HPO terms pass the threshold for multiple testing of which 42 are defined within the ‘abnormality of the nervous system’ branch. Source data

Comment in

Similar articles

Cited by

References

    1. van Es MA, et al. Amyotrophic lateral sclerosis. Lancet. 2017;390:2084–2098. - PubMed
    1. Al-Chalabi A, van den Berg LH, Veldink JH. Gene discovery in amyotrophic lateral sclerosis: implications for clinical management. Nat. Rev. Neurol. 2017;13:96–104. - PubMed
    1. Trabjerg BB, et al. ALS in Danish registries: heritability and links to psychiatric and cardiovascular disorders. Neurol. Genet. 2020;6:e398. - PMC - PubMed
    1. Ryan M, Heverin M, McLaughlin RL, Hardiman O. Lifetime risk and heritability of amyotrophic lateral sclerosis. JAMA Neurol. 2019;76:1367–1374. - PMC - PubMed
    1. Byrne S, Elamin M, Bede P, Hardiman O. Absence of consensus in diagnostic criteria for familial neurodegenerative diseases. J. Neurol. Neurosurg. Psychiatry. 2012;83:365–367. - PubMed

Publication types

Grants and funding