Review
. 2021 Dec 7;5(1):52.
doi: 10.1186/s41747-021-00250-0.

Advances in liver US, CT, and MRI: moving toward the future

Affiliations
Review

Advances in liver US, CT, and MRI: moving toward the future

Federica Vernuccio et al. Eur Radiol Exp. .

Abstract

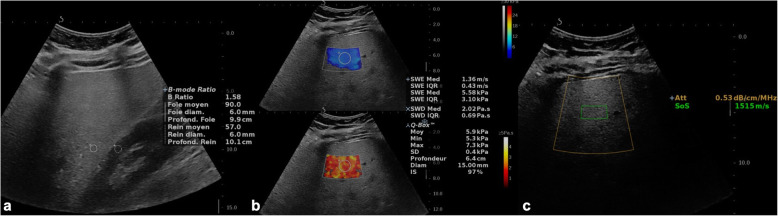
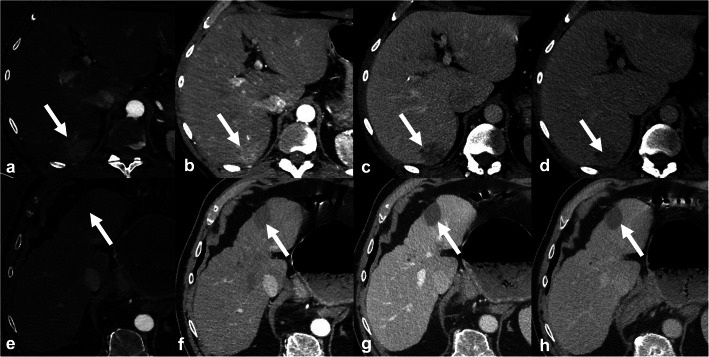
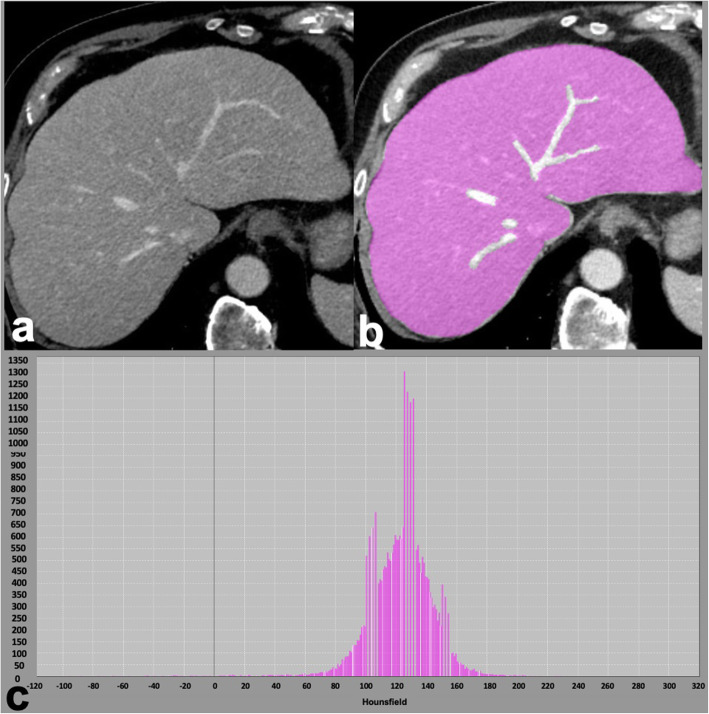
Over the past two decades, the epidemiology of chronic liver disease has changed with an increase in the prevalence of nonalcoholic fatty liver disease in parallel to the advent of curative treatments for hepatitis C. Recent developments provided new tools for diagnosis and monitoring of liver diseases based on ultrasound (US), computed tomography (CT), and magnetic resonance imaging (MRI), as applied for assessing steatosis, fibrosis, and focal lesions. This narrative review aims to discuss the emerging approaches for qualitative and quantitative liver imaging, focusing on those expected to become adopted in clinical practice in the next 5 to 10 years. While radiomics is an emerging tool for many of these applications, dedicated techniques have been investigated for US (controlled attenuation parameter, backscatter coefficient, elastography methods such as point shear wave elastography [pSWE] and transient elastography [TE], novel Doppler techniques, and three-dimensional contrast-enhanced ultrasound [3D-CEUS]), CT (dual-energy, spectral photon counting, extracellular volume fraction, perfusion, and surface nodularity), and MRI (proton density fat fraction [PDFF], elastography [MRE], contrast enhancement index, relative enhancement, T1 mapping on the hepatobiliary phase, perfusion). Concurrently, the advent of abbreviated MRI protocols will help fulfill an increasing number of examination requests in an era of healthcare resource constraints.

Keywords: Biomarkers; Magnetic resonance imaging; Non-alcoholic fatty liver disease; Tomography; Ultrasonography; X-ray computed.


Conflict of interest statement

The authors declare that they have no competing interests.

Figures

Fig. 1
Fig. 1
40-year-old man with hepatic steatosis. Multiparametric ultrasound assessment includes (a) hepatorenal index, (b) shear wave elastography imaging, and (c) attenuation imaging coefficient and sound speed estimation
Fig. 2
Fig. 2
Ultrasound shear wave elastography for assessment of hepatic fibrosis. a Brightness-mode image with a 1.0-cm circular region of interest indicating a mean stiffness of 7.2 kPa. b Shear wave imaging mode indicating the liver stiffness with a color parametric map along a scale from 0 to 42 kPa
Fig. 3
Fig. 3
Contrast-enhanced ultrasound for assessment of focal nodular hyperplasia. Dual-display images with brightness-mode (left) and contrast-enhanced ultrasound images (right). a Images in arterial phase (28 s after the i.v. injection of contrast agent) show homogeneous and strong enhancement (white arrows) with a central hypoechoic scar (black arrow). b In the portal venous phase (86 s after the injection), the lesion is still slightly hyperechoic to the adjacent liver parenchyma (white arrows) and the central scar remains hypoechoic (black arrow)
Fig. 4
Fig. 4
Microvascular flow imaging in a young woman with focal nodular hyperplasia. a Brightness-mode ultrasound demonstrates a 2.8-cm focal nodular hyperplasia (arrow) lacking any vascularization at conventional color Doppler. b Microvascular assessment with microvascular flow imaging clearly depicts an intralesional vessel (arrowhead)
Fig. 5
Fig. 5
Dual-energy computed tomography (DECT). a-d 58-year-old man with 39-mm hepatocellular carcinoma (arrows) imaged with DECT. Arterial phase hyperenhancement is better visualized on iodine map (a) than on the standard late hepatic arterial phase (b). Lesion also shows washout on portal venous (c) and delayed phase (d). e-h 79-year-old man with hepatocellular carcinoma treated with microwave ablation (arrows) and imaged with DECT. Iodine map (e), standard late hepatic arterial phase (f), portal venous (g), and delayed phase (h) demonstrate no residual enhancement consistent with complete tumor treatment
Fig. 6
Fig. 6
79-year-old man with nonalcoholic fatty liver disease and histopathologically proven advanced fibrosis (stage F3). Contrast-enhanced CT in portal venous phase (a) shows a dysmorphic liver with mild lobulations. Whole liver segmentation was performed (b), excluding major hepatic vessels, to extract radiomics features using a free software (LIFEx, www.lifexsoft.org). The corresponding histogram (c) shows the distribution of pixel intensities within the segmented region of interest
Fig. 7
Fig. 7
Computed tomography (CT) texture analysis in a 34-year-old man with chronic hepatitis B and 50-mm hepatocellular carcinoma. Contrast-enhanced CT shows hyperenhancement in the late arterial phase (a, white arrow), washout in portal venous phase (b, white arrowhead), and in delayed phase (c); a capsule is visible in delayed phase (c). The tumor was segmented on the portal venous phase by manually drawing a region of interest within the lesions margin (d), using a free software (LIFEx, www.lifexsoft.org), the corresponding histogram shows distribution of signal intensities within the region of interest (e)
Fig. 8
Fig. 8
Magnetic resonance imaging of the liver. Standard and proposed abbreviated protocols. 66-year-old man with 30-mm hepatocellular carcinoma (HCC) imaged with standard gadoxetate disodium protocol (a) and proposed abbreviated protocols for HCC screening. Gadoxetate disodium may be administered outside the scanner 20 min before abbreviated protocols that contain a hepatobiliary phase (b-d) or an extracellular agent can be administered before dynamic phases (e). Abbreviated protocols may include T2-weighted single-shot (SS) and hepatobiliary phase (HBP) (b); T2-weighted SS, diffusion-weighted imaging (DWI), and HBP (c); DWI and HBP (d); or pre-contrast and arterial, portal venous, and delayed phases (e). ECA, extracellular contrast agent; HBA, hepatobiliary contrast agent
Fig. 9
Fig. 9
Liver fat detection and quantification in patients with nonalcoholic steatohepatitis undergoing in- and out-of-phase magnetic resonance imaging sequences (first and second columns, respectively), and proton density fat fraction (PDFF, third column). Top row: 78-year-old man without hepatic steatosis. Note the lack of signal drop on out-of-phase image and PDFF of only 3–4%. Middle row: 39-year-old woman with moderate hepatic steatosis. Note the minimal signal drop on out-of-phase image and PDFF from 8 to 16%. Bottom row: 48-year-old man with severe hepatic steatosis. Note the marked signal drop on out-of-phase image and PDFF from 45 to 49%

References

    1. Younossi Z, Anstee QM, Marietti M, Hardy T, Henry L, Eslam M, George J, Bugianesi E. Global burden of NAFLD and NASH: trends, predictions, risk factors and prevention. Nat Rev Gastroenterol Hepatol. 2018;15:11–20. - PubMed
    1. Lombardi A, Mondelli MU, ESCMID Study Group for Viral Hepatitis (ESGVH) Hepatitis C: is eradication possible? Liver Int. 2019;39:416–426. - PubMed
    1. Kleiner DE, Brunt EM, Van Natta M, et al. Nonalcoholic Steatohepatitis Clinical Research Network. Design and validation of a histological scoring system for nonalcoholic fatty liver disease. Hepatology. 2005;41:1313–1321. - PubMed
    1. Byrne CD, Targher G. NAFLD: a multisystem disease. J Hepatol. 2015;62:S47–S64. - PubMed
    1. Ratziu V, Charlotte F, Heurtier A, Gombert S, Giral P, Bruckert E, Grimaldi A, Capron F, Poynard T, LIDO Study Group Sampling variability of liver biopsy in nonalcoholic fatty liver disease. Gastroenterology. 2005;128:1898–1906. - PubMed

MeSH terms