. 2022 Mar;43(4):1419-1430.
doi: 10.1002/hbm.25733. Epub 2021 Dec 7.

Brain opioid segments and striatal patterns of dopamine release induced by naloxone and morphine

Affiliations

Brain opioid segments and striatal patterns of dopamine release induced by naloxone and morphine

Ehsan Shokri-Kojori et al. Hum Brain Mapp. 2022 Mar.

Abstract

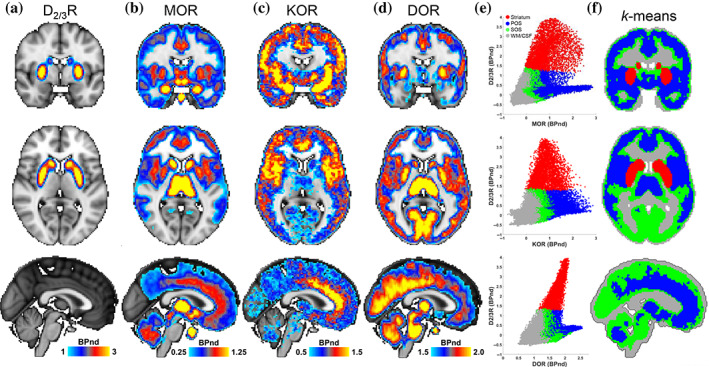
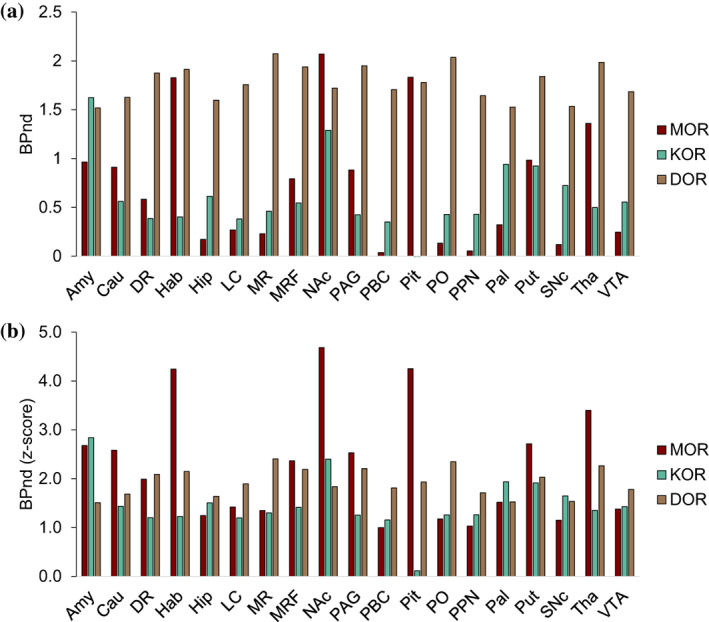
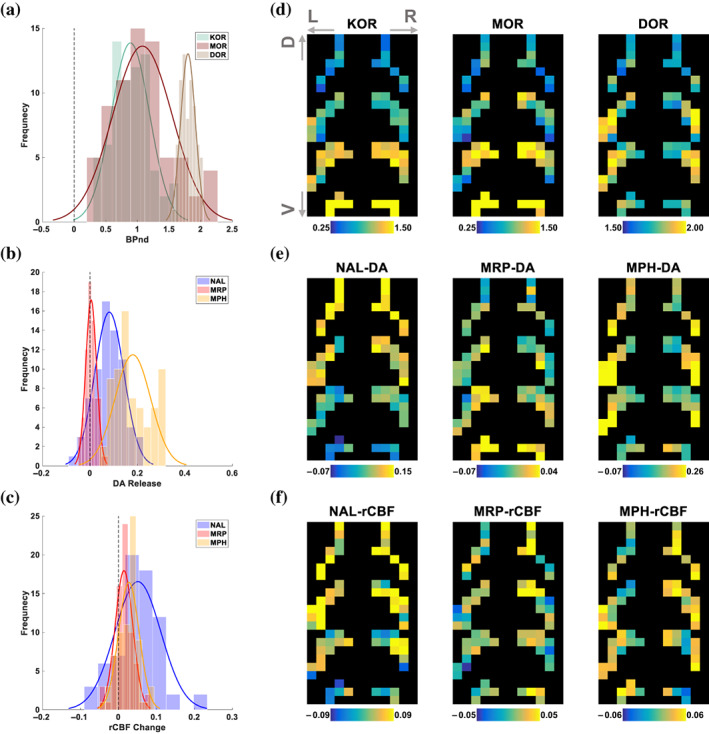
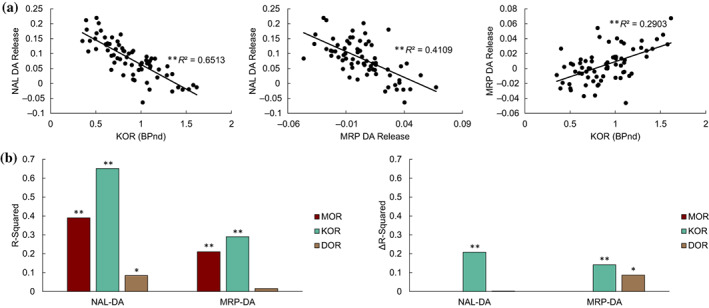
Opioid receptors are expressed throughout the brain and play a major role in regulating striatal dopamine (DA) release. Clinical studies have shown that naloxone (NAL, a nonspecific opioid antagonist) in individuals with opioid use disorder and morphine (MRP, a nonspecific opioid agonist) in healthy controls, resulted in DA release in the dorsal and ventral striatum, respectively. It is not known whether the underlying patterns of striatal DA release are associated with the striatal distribution of opioid receptors. We leveraged previously published PET datasets (collected in independent cohorts) to study the brain-wide distribution of opioid receptors and to compare striatal opioid receptor availability with striatal DA release patterns. We identified three major gray matter segments based on availability maps of DA and opioid receptors: striatum, and primary and secondary opioid segments with high and intermediate opioid receptor availability, respectively. Patterns of DA release induced by NAL and MRP were inversely associated and correlated with kappa (NAL: r(68) = -0.81, MRP: r(68) = 0.54), and mu (NAL: r(68) = -0.62, MRP: r(68) = 0.46) opioid receptor availability. Kappa opioid receptor availability accounted for a unique part of variance in NAL- and MRP-DA release patterns (ΔR2 >0.14, p <.0001). In sum, distributions of opioid receptors distinguished major cortical and subcortical regions. Patterns of NAL- and MRP-induced DA release had inverse associations with striatal opioid receptor availability. Our approach provides a pattern-based characterization of drug-induced DA targets and is relevant for modeling the role of opioid receptors in modulating striatal DA release.

Keywords: dopamine; k-means; morphine; naloxone; opioid receptors; positron emission tomography (PET); striatum.


Conflict of interest statement

The authors declare no potential conflict of interest.

Figures

FIGURE 1
FIGURE 1
Brain segmentation based on the distributions of DA and opioid receptors. (a–d) Coronal, (y = −2 mm), axial (z = 6 mm), and sagittal (x = 0) views of average D2/3R, MOR, KOR, and DOR availability maps. (e) Scatterplots of opioid receptor availability across brain voxels in the four major segments identified by k‐means clustering. Red: striatum, blue: primary opioid segment (POS), green: secondary opioid segment (SOS), and gray: white matter (WM) and CSF. (f) The k‐means clusters shown on the brain
FIGURE 2
FIGURE 2
Mu (MOR), kappa (KOR), and delta (DOR) opioid receptor availability in subcortical, brainstem, and pituitary regions. (a) Average binding potential (BPnd) for MOR, KOR, and DOR (see Section 2). MOR BPnd was higher in VTA (M = 0.25, SD = 0.24) than SNc (M = 0.12, SD = 0.175) (t(9) = 4.36, p = .002). KOR BPnd was higher in SNc (M = 0.72, SD = 0.18) than VTA (M = 0.56, SD = 0.30) (t(9) = 2.28, p = .049). KOR BPnd in the pituitary was insignificant. (b) The z‐scores of BPnd values shown in (a) calculated with whole‐brain mean–variance normalization. It should be noted that for each opioid receptor, BPnd values were estimated using a different modeling technique and in a different cohort, thus differences in BPnd values between different opioid receptors should be interpreted with caution. Amy, amygdala; Cau, caudate; DR, dorsal raphé; Hab, habenula; Hip, hippocampus; LC, locus coeruleus; MR, median raphé; MRF, midbrain reticular formation; NAc, nucleus accumbens; PAG, periaqueductal gray; PBC, parabrachial complex; PO, pontis oralis; PPN, pendunculopontine nucleus; Pal, pallidum; Pit, pituitary; Put, putamen; SNc; substantia nigra pars compacta; Tha, thalamus; VTA, ventral tegmental area. See Section 2 for ROI definitions. MOR is shown in “maroon,” KOR in “keppel,” and DOR in “dirt” colors
FIGURE 3
FIGURE 3
Striatal distribution of opioid receptors compared to the patterns of DA release and change in rCBF. (a) Histograms of BPnd for kappa (KOR), mu (MOR), and delta (DOR) opioid receptors (frequency refers to the number of striatal sub‐partitions). (b) Striatal DA release with naloxone (NAL), morphine (MOR), and methylphenidate (MPH). (c) Change in relative cerebral blood flow (rCBF) induced by NAL, MRP, and MPH in the striatum derived from changes in R1 (see Methods). (d–f) 2D representation of striatal‐sub partitions for the data shown in a–c, respectively. Specifically, the most ventral striatal sub‐partitions (6‐mm cubes) were placed at the bottom rows of each 2D map while preserving their placement along the sagittal and coronal axes. Next, striatal sub‐partitions that were immediately dorsal to these sub‐partitions were placed in the 2D map in the same manner, just above the lastly placed sub‐partitions. This procedure was repeated until all striatal sub‐partitions were placed in the 2D map. Bottom to top rows generally correspond to ventral (V) to dorsal (D) axis of the striatum, respectively. The dark background was added to improve visibility
FIGURE 4
FIGURE 4
Associations between striatal DA‐release patterns and opioid receptor availability. (a) Linear associations between KOR and NAL‐ and MRP‐induced DA release. Each data point represents the average measure across participants in one of the 70 striatal sub‐partitions shown in Figure 3d–f. These spatial correlations are between separate groups of subjects (see Section 2). (b) Left: R‐squared values of the linear correlations between opioid receptor distributions and NAL‐ and MRP‐induced DA release patterns. Right: Difference in R‐squared values of full model (including all opioid receptors) and the reduced model (removing the opioid receptor of interest) in explaining variability in DA‐release across striatal sub‐partitions. Significance was calculated by partial F‐tests (*p <.02, **p <.00025)

Similar articles

Cited by

References

    1. Al‐Hasani, R. , McCall, J. G. , Shin, G. , Gomez, A. M. , Schmitz, G. P. , Bernardi, J. M. , … Bruchas, M. R. (2015). Distinct subpopulations of nucleus accumbens dynorphin neurons drive aversion and reward. Neuron, 87(5), 1063–1077. 10.1016/j.neuron.2015.08.019 - DOI - PMC - PubMed
    1. Beier, K. T. , Steinberg, E. E. , DeLoach, K. E. , Xie, S. , Miyamichi, K. , Schwarz, L. , … Luo, L. (2015). Circuit architecture of VTA dopamine neurons revealed by systematic input‐output mapping. Cell, 162(3), 622–634. - PMC - PubMed
    1. Bilgel, M. , Beason‐Held, L. , An, Y. , Zhou, Y. , Wong, D. F. , & Resnick, S. M. (2020). Longitudinal evaluation of surrogates of regional cerebral blood flow computed from dynamic amyloid PET imaging. Journal of Cerebral Blood Flow and Metabolism, 40(2), 288–297. 10.1177/0271678x19830537 - DOI - PMC - PubMed
    1. Birn, R. M. , Converse, A. K. , Rajala, A. Z. , Alexander, A. L. , Block, W. F. , McMillan, A. B. , … Populin, L. C. (2019). Changes in endogenous dopamine induced by methylphenidate predict functional connectivity in nonhuman primates. The Journal of Neuroscience, 39(8), 1436–1444. 10.1523/jneurosci.2513-18.2018 - DOI - PMC - PubMed
    1. Bontempi, B. , & Sharp, F. R. (1997). Systemic morphine‐induced Fos protein in the rat striatum and nucleus accumbens is regulated by μ opioid receptors in the substantia nigra and ventral tegmental area. Journal of Neuroscience, 17(21), 8596–8612. - PMC - PubMed

Publication types