Meta-Analysis
. 2021 Dec 7:10:e71601.
doi: 10.7554/eLife.71601.

Investigating the replicability of preclinical cancer biology

Affiliations
Meta-Analysis

Investigating the replicability of preclinical cancer biology

Timothy M Errington et al. Elife. .

Abstract

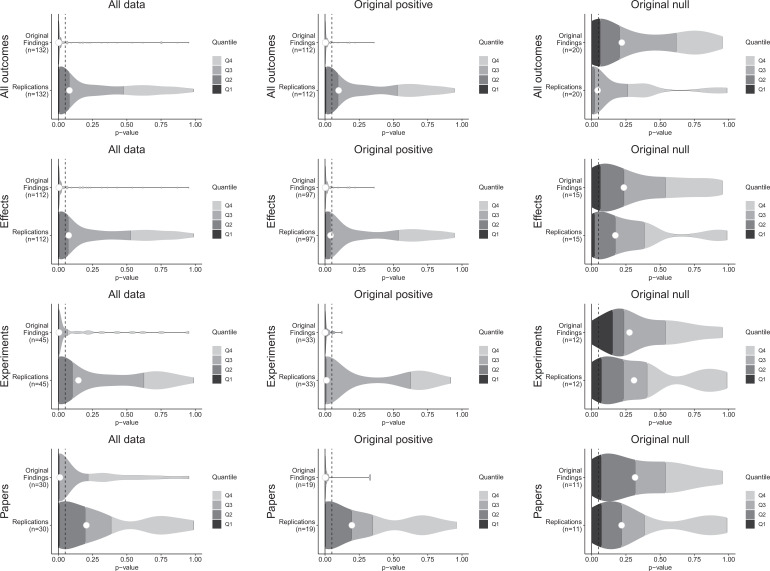
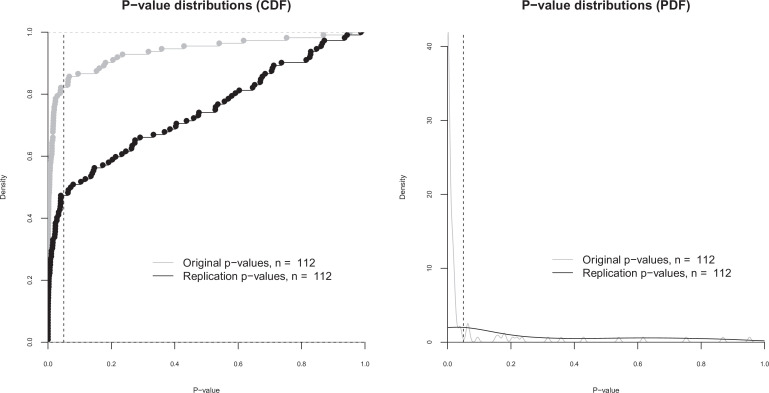
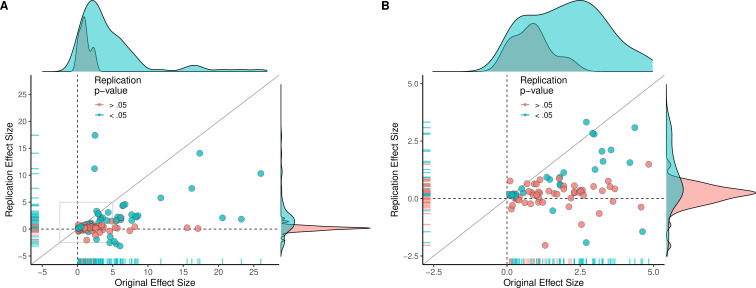
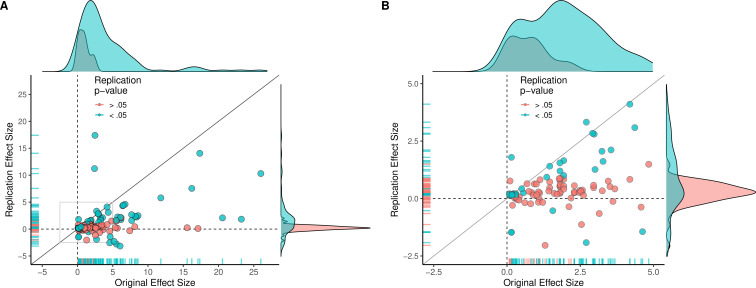
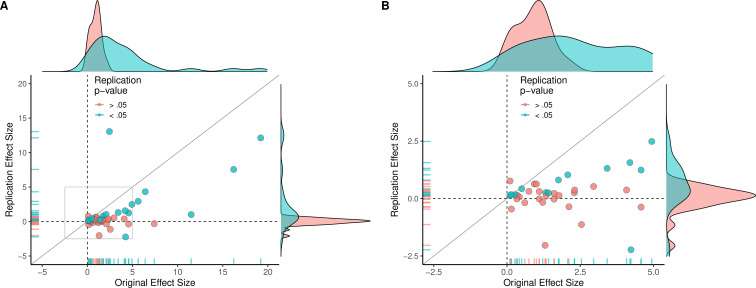
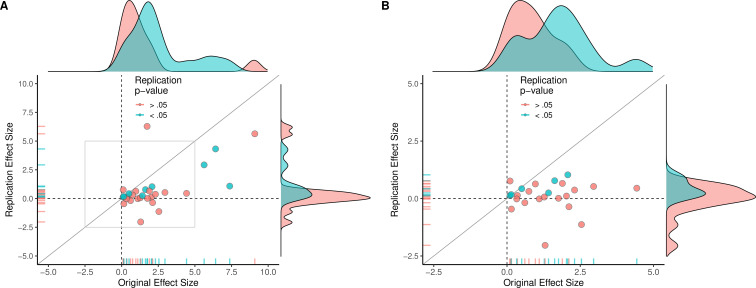
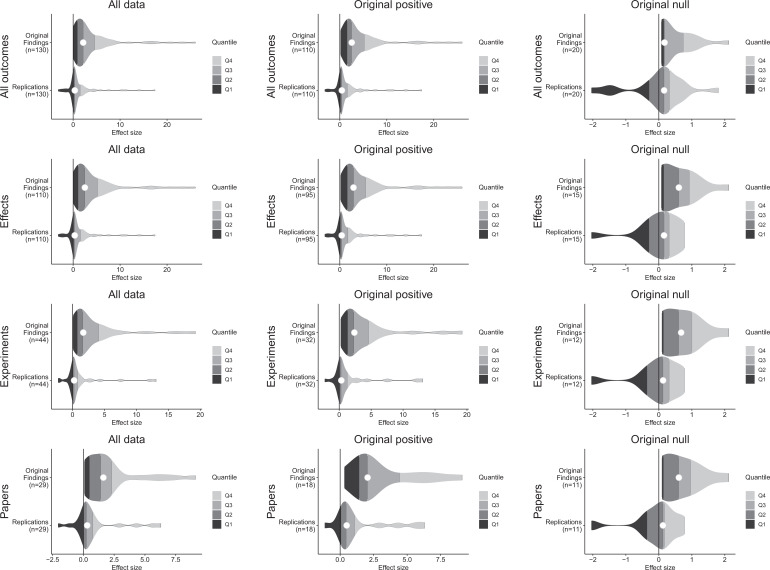
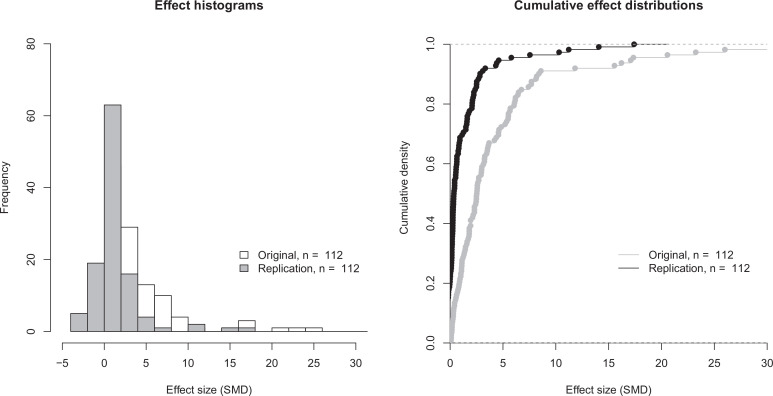
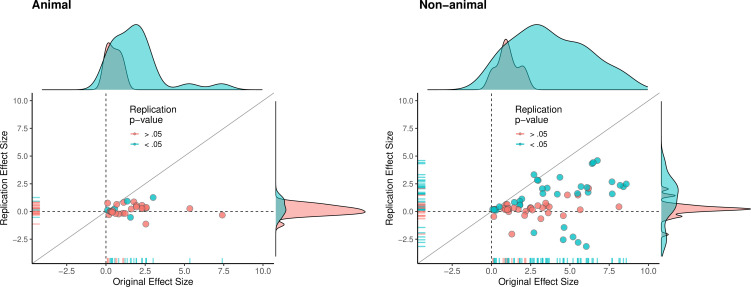
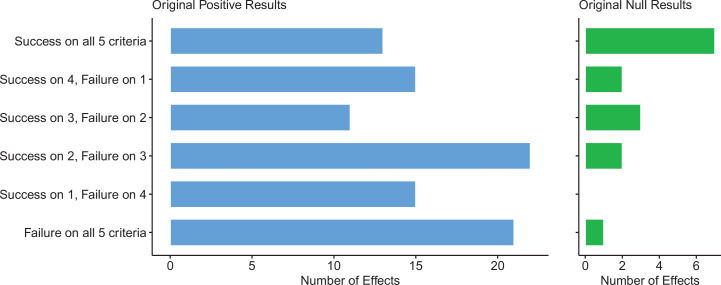
Replicability is an important feature of scientific research, but aspects of contemporary research culture, such as an emphasis on novelty, can make replicability seem less important than it should be. The Reproducibility Project: Cancer Biology was set up to provide evidence about the replicability of preclinical research in cancer biology by repeating selected experiments from high-impact papers. A total of 50 experiments from 23 papers were repeated, generating data about the replicability of a total of 158 effects. Most of the original effects were positive effects (136), with the rest being null effects (22). A majority of the original effect sizes were reported as numerical values (117), with the rest being reported as representative images (41). We employed seven methods to assess replicability, and some of these methods were not suitable for all the effects in our sample. One method compared effect sizes: for positive effects, the median effect size in the replications was 85% smaller than the median effect size in the original experiments, and 92% of replication effect sizes were smaller than the original. The other methods were binary - the replication was either a success or a failure - and five of these methods could be used to assess both positive and null effects when effect sizes were reported as numerical values. For positive effects, 40% of replications (39/97) succeeded according to three or more of these five methods, and for null effects 80% of replications (12/15) were successful on this basis; combining positive and null effects, the success rate was 46% (51/112). A successful replication does not definitively confirm an original finding or its theoretical interpretation. Equally, a failure to replicate does not disconfirm a finding, but it does suggest that additional investigation is needed to establish its reliability.

Keywords: Reproducibility Project: Cancer Biology; cancer biology; computational biology; credibility; human; meta-analysis; mouse; replication; reproducibility; reproducibility in cancer biology; systems biology; transparency.


Conflict of interest statement

TE, AD Employed by the Center for Open Science, a non-profit organization that has a mission to increase openness, integrity, and reproducibility of research, MM No competing interests declared, CS Was employed by the Center for Open Science, a non-profit organization that has a mission to increase openness, integrity, and reproducibility of research, NP Was employed by and holds shares in Science Exchange Inc, EI Employed by and holds shares in Science Exchange Inc, BN Employed by the nonprofit Center for Open Science that has a mission to increase openness, integrity, and reproducibility of research

Figures

Figure 1.
Figure 1.. p-value density plots for original and replication results.
p-alue density plots for original and replication results treating internal replications individually (top row), and aggregated by effects (second row), experiments (third row), and papers (fourth row). Left column presents all data for which p-values could be calculated for both original and replication results; the other two columns present data for when the original result was interpreted as positive (middle column) or as a null result (right column). Some original effects (n = 7) were interpreted as positive results with p-values > 0.05, and some original effects (n = 2) were interpreted as null results with p-values < 0.05. Replication p-values ignore whether the result was in the same or opposite direction as the original result (n = 7 effects had p-values < 0.05 in the opposite direction as the original effect).
Figure 1—figure supplement 1.
Figure 1—figure supplement 1.. p-value distributions for original and replication effects.
Cumulative distribution functions (CDF; left) and probability distribution functions (PDF; right) for p-values for the 112 effects for which the original and replications had an associated statistical significance test. The vertical dashed line indicates p = 0.05. The difference between the means of the two p-value distributions (0.064 for the original effects; 0.259 for the replications) was significant: paired t-test: t(111) = –6.14, p = 1.33 × 10⁻⁸; Wilcoxon rank sum test: W = 3358, p = 1.88 × 10⁻⁹. Quantities are 0.00034, 0.0048, 0.0198 for the original effects, and 0.0075, 0.0757, 0.528 for the replications.
Figure 2.
Figure 2.. Replication effect sizes compared with original effect sizes.
(A) Graph in which each circle represents an effect for which an SMD effect size could be computed for both the original effect and the replication (n = 110). Blue circles indicate effects for which p < 0.05 in the replication, and red circles indicate p > 0.05. Two effects for which the original effects size was >80 are not shown. The median effect size in the replications was 85% smaller than the median effect size in the original experiments, and 97% of replication effect sizes were smaller than original effect sizes (below the gray diagonal line). (B) An expanded view of panel A for effect sizes < 5 (gray outline in panel A). SMD: standardized mean difference.
Figure 2—figure supplement 1.
Figure 2—figure supplement 1.. Replication effect sizes compared with original effect sizes for all effects (treating internal replications individually).
(A) Graph in which each circle represents an effect for which an SMD effect size could be computed for both the original effect and the replication: all effects, including internal replications, are shown (n = 130). Blue circles indicate effects for which p < 0.05 in the replication, and red circles indicate p > 0.05. Two effects for which the original effects size was >80 are not shown. (B) An expanded view of panel A for effect sizes < 5 (gray outline in panel A). SMD: standardized mean difference.
Figure 2—figure supplement 2.
Figure 2—figure supplement 2.. Replication effect sizes compared with original effect sizes for experiments (combining effects).
(A) Graph in which each circle represents an experiment (n = 44). The SMD effect size for each experiment was determined by meta-analytically combining positive or null effects from each unique experiment with random-effect models. Blue circles indicate experiments for which p < 0.05 in the replication, and red circles indicate p > 0.05. One experiment for which two original effect sizes were >80 are not shown. (B) An expanded view of panel A for effect sizes < 5 (gray outline in panel A). SMD: standardized mean difference.
Figure 2—figure supplement 3.
Figure 2—figure supplement 3.. Replication effect sizes compared with original effect sizes for papers (combining experiments).
(A) Graph in which each circle represents a paper (n = 29). The SMD effect size for each paper was determined by meta-analytically combining positive or null results from each unique experiment with random-effect models. Blue circles indicate experiments for which p < 0.05 in the replication, and red circles indicate p > 0.05. One paper for which two original effect sizes were >80 are not shown. (B) An expanded view of panel A for effect sizes < 5 (gray outline in panel A). SMD: standardized mean difference.
Figure 3.
Figure 3.. Effect size density plots for original and replication results.
Effect size density plots for original and replication findings for all results treating internal replications individually (top row) and aggregated by effects (second row), experiments (third row), and papers (fourth row). Left column presents all data for which SMD effect sizes could be calculated for both original and replication results; the other two columns present data for when the original result was interpreted as positive (middle column) or as a null result (right column). Effect sizes > 80 (two for all outcomes and effects, and one for experiments and papers) are not shown.
Figure 3—figure supplement 1.
Figure 3—figure supplement 1.. Effect size distributions for original and replication effects.
Histogram (left) and cumulative distribution function (right) for SMD effect sizes for the 112 effects for which the original and replications had an associated statistical significance test. The difference between the means of the two effect size distributions (5.41 [SD = 11.7] for the original effects; 1.19 [SD = 2.85] for the replications) was significant: paired t-test: t(111) = 3.93, p = 1.48 × 10⁻⁴; Wilcoxon rank sum test: W = 9898, p = 7.68 × 10⁻¹⁴. Two effects for which the original effects size was >80 are not shown. SMD: standardized mean difference.
Figure 4.
Figure 4.. Correlations between five candidate moderators.
Point-biserial correlations among five candidate moderators for predicting replication success for the 97 original positive effects with replication pairs. The five moderators were: (i) animal experiments vs. non-animal (i.e., in vitro) experiments (animal expt); (ii) the use of contract research organizations to conduct replications (CRO lab); (iii) the use of academic research core facilities to conduct replications (core lab); (iv) whether the original authors shared materials with the replicating labs (materials shared); (v) the quality of methodological clarifications made by the original authors (clarifications quality); see Materials and methods for more details. Correlations are color-coded (blue = positive; red = negative; see color bar), with the size of the circle being proportional to the magnitude of the correlation. None of the five moderators showed a consistent, significant association with replication rate (see Table S7 in Supplementary file 1).
Figure 5.
Figure 5.. Replication effect sizes compared with original effect sizes for animal and non-animal experiments.
Graphs for animal experiments (n = 30 effects; left) and non-animal experiments (n = 70 effects; right) in which each circle represents an effect for which an SMD effect size could be computed for both the original effects and the replication. Blue circles indicate effects for which p < 0.05 in the replication, and red circles indicate p > 0.05. Animal experiments were less likely to replicate than non-animal experiments and this may be a consequence of animal experiments eliciting smaller effect sizes on average than non-animal experiments (see main text for further discussion). Twelve effects in the non-animal experiments for which the original effects size was >10 are not shown. SMD: standardized mean difference.
Figure 6.
Figure 6.. Assessing replications of positive and null effects across five criteria.
Five of the criteria we used to assess replications could be used for both positive (n = 97) and null effects (n = 15). The number of effects where the replication was successful on all five criteria is shown by the top bar of each panel, with the second bar showing the number of effects where the replications were successful on four criteria, and so on: positive effects are shown in the left panel (blue bars), and null effects are shown in the right panel (green bars). The five criteria were: (i) direction and statistical significance (p < 0.05); (ii) original effect size in replication 95% confidence interval; (iii) replication effect size in original 95% confidence interval; (iv) replication effect size in original 95% prediction interval; (v) meta-analysis combining original and replication effect sizes is statistically significant (p < 0.05). Standardized mean difference (SMD) effect sizes are reported.
Figure 7.
Figure 7.. Correlations between five criteria for replication success.
Point-biserial correlations among five criteria for evaluating replication success for the 112 original-replication pairs that could be evaluated on all five criteria: (i) same direction and statistical significance (Dir & Sig); (ii) original effect size in replication 95% confidence interval (Orig ES in rep CI); (iii) replication effect size in original 95% confidence interval (Rep ES in orig CI); (iv) replication effect size in 95% prediction interval (Rep ES in PI); (v) meta-analysis combining original and replication effect sizes gives significant effect (p < 0.05) (Meta sig). Correlations are color-coded (blue = positive; red = negative; see color bar), with the size of the circle being proportional to the magnitude of the correlation. The five criteria were all positively correlated with one another.

Comment in

References

    1. Amaral OB, Neves K, Wasilewska-Sampaio AP, Carneiro CF. The Brazilian Reproducibility Initiative. eLife. 2019;8:e41602. doi: 10.7554/eLife.41602. - DOI - PMC - PubMed
    1. Anderson CJ, Bahník Š, Barnett-Cowan M, Bosco FA, Chandler J, Chartier CR, Cheung F, Christopherson CD, Cordes A, Cremata EJ, Della Penna N, Estel V, Fedor A, Fitneva SA, Frank MC, Grange JA, Hartshorne JK, Hasselman F, Henninger F, van der Hulst M, Jonas KJ, Lai CK, Levitan CA, Miller JK, Moore KS, Meixner JM, Munafò MR, Neijenhuijs KI, Nilsonne G, Nosek BA, Plessow F, Prenoveau JM, Ricker AA, Schmidt K, Spies JR, Stieger S, Strohminger N, Sullivan GB, van Aert RCM, van Assen M, Vanpaemel W, Vianello M, Voracek M, Zuni K. Response to Comment on “Estimating the reproducibility of psychological science.”. Science. 2016;351:1037. doi: 10.1126/science.aad9163. - DOI - PubMed
    1. Andrews I, Kasy M. Identification of and Correction for Publication Bias. American Economic Review. 2019;109:2766–2794. doi: 10.1257/aer.20180310. - DOI
    1. Baker M. Is there a reproducibility crisis. Nature. 2016;533:353–366.
    1. Baker M. Animal registries aim to reduce bias. Nature. 2019;573:297–298. doi: 10.1038/d41586-019-02676-4. - DOI - PubMed

Publication types