. 2021 Dec 7:10:e73027.
doi: 10.7554/eLife.73027.

Highly synergistic combinations of nanobodies that target SARS-CoV-2 and are resistant to escape

Affiliations

Highly synergistic combinations of nanobodies that target SARS-CoV-2 and are resistant to escape

Fred D Mast et al. Elife. .

Abstract

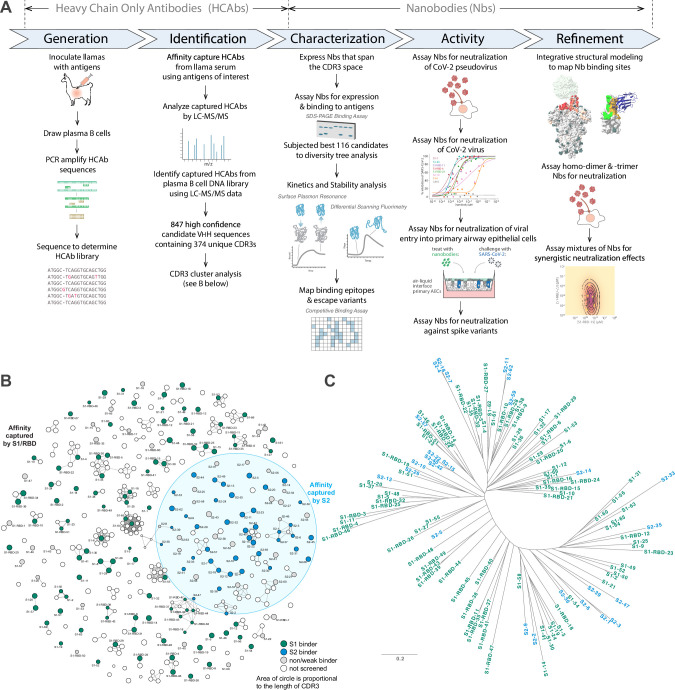
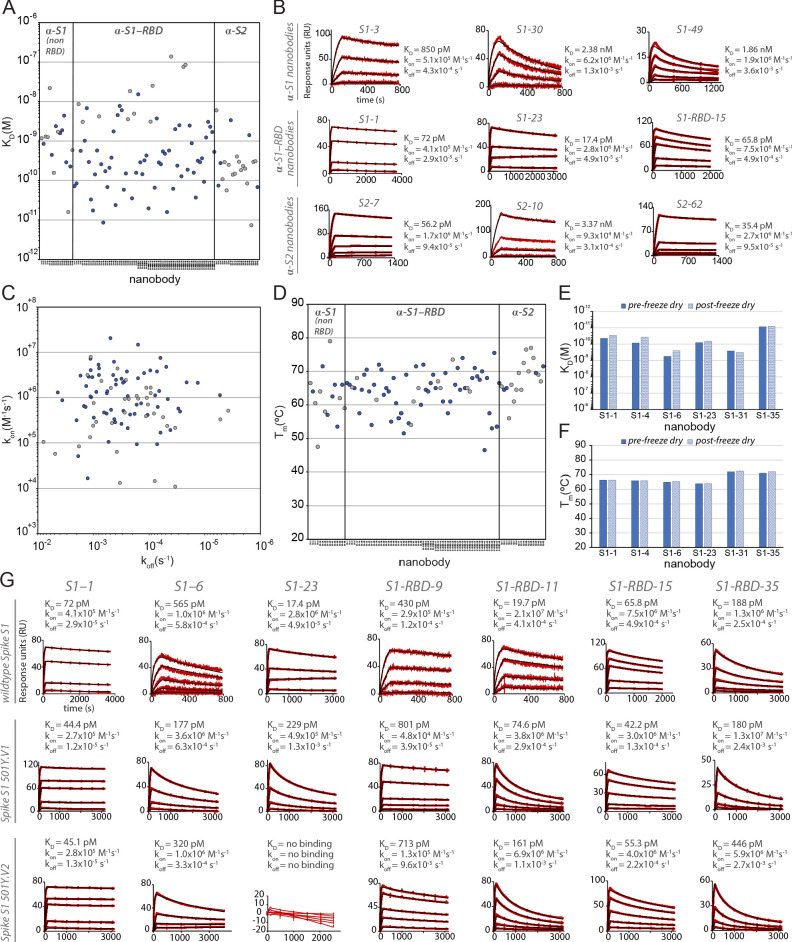
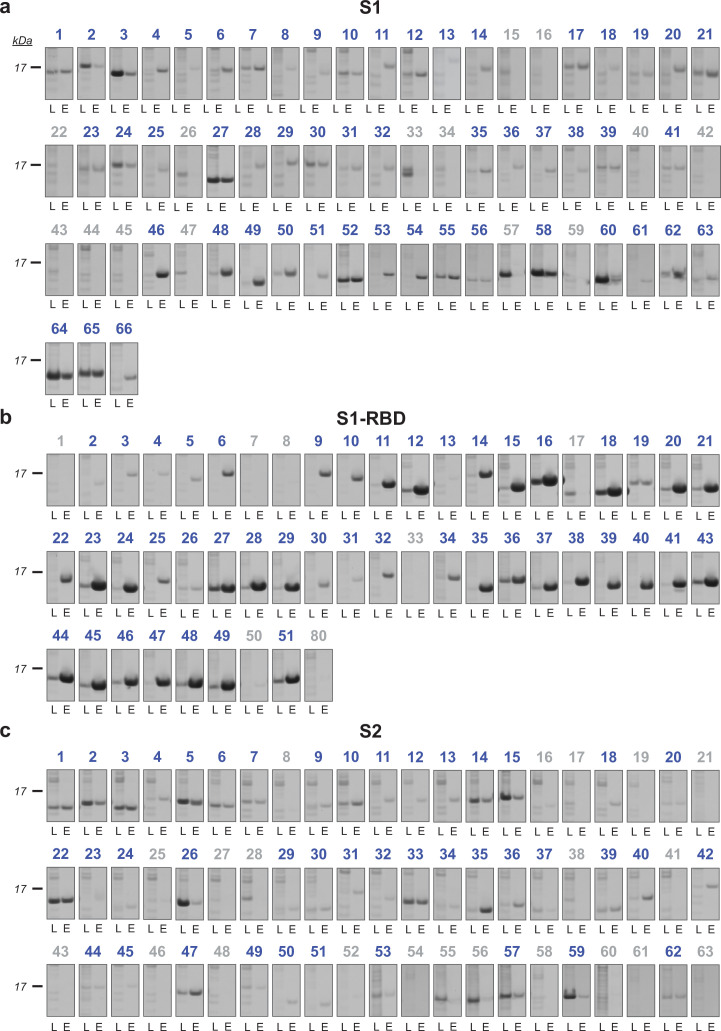
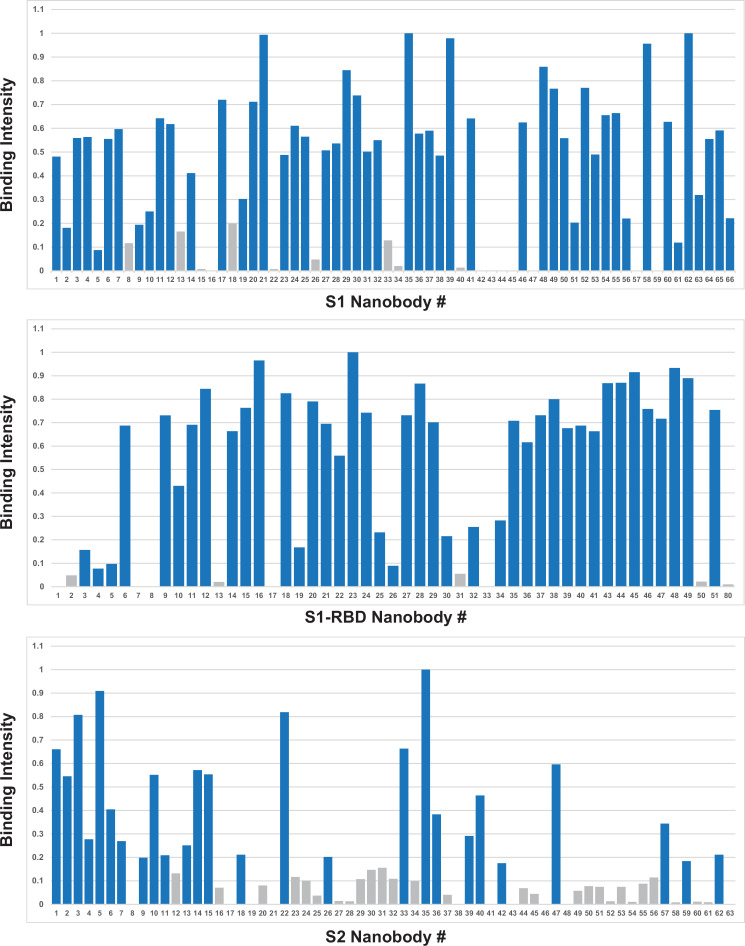
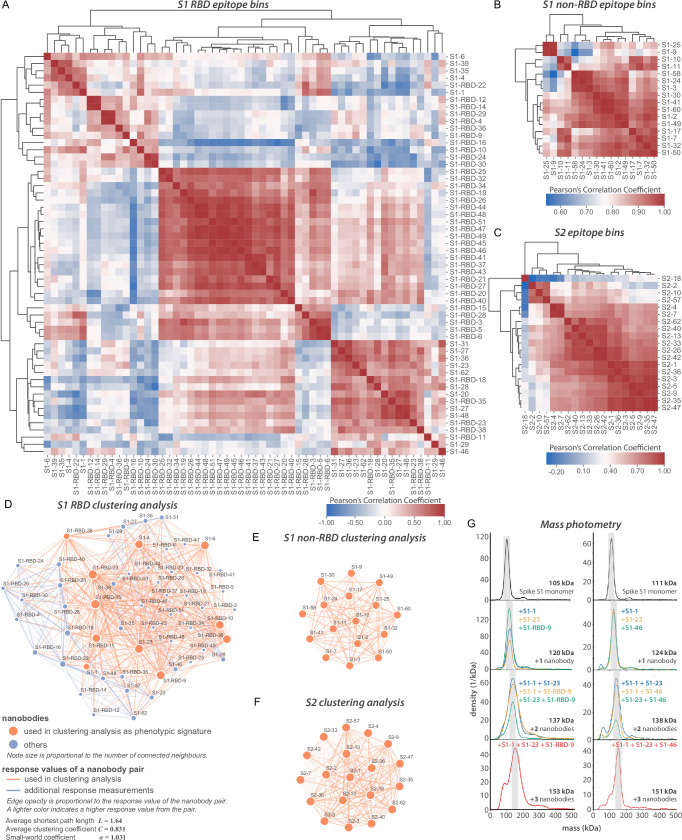
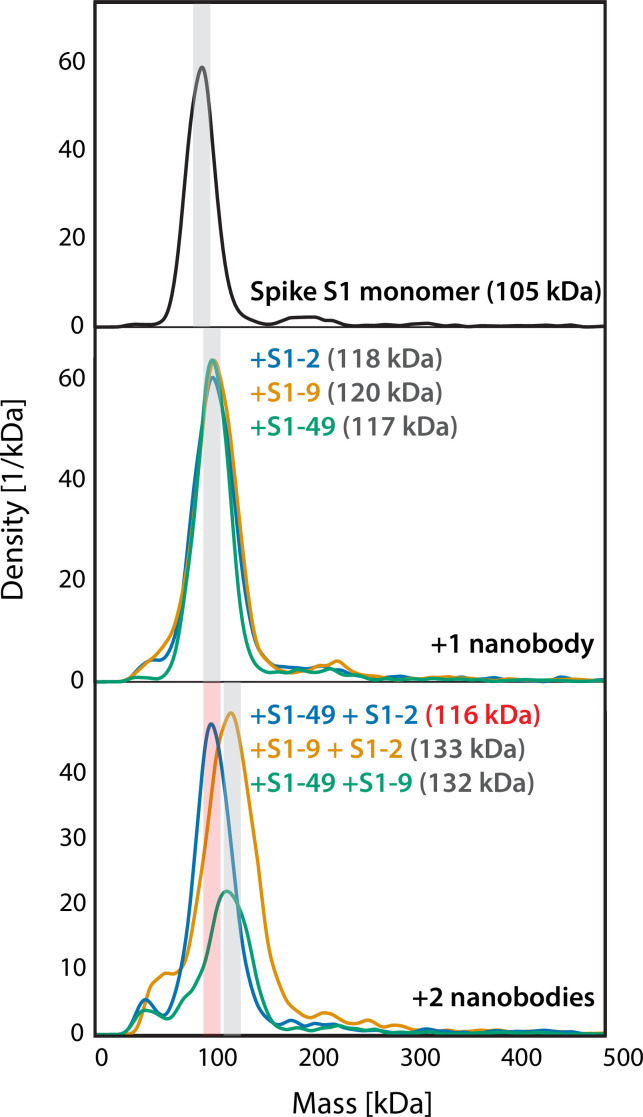
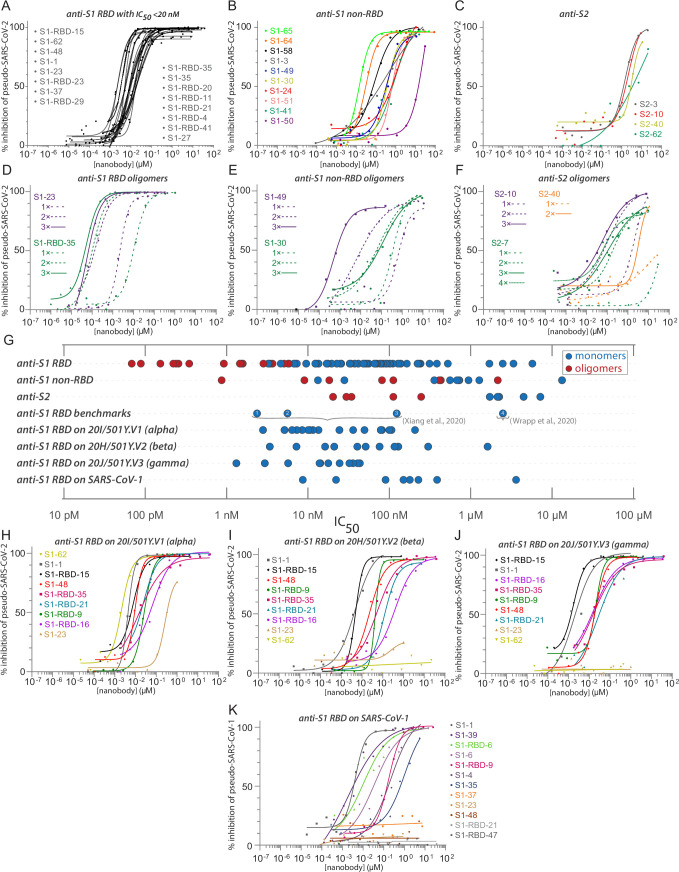
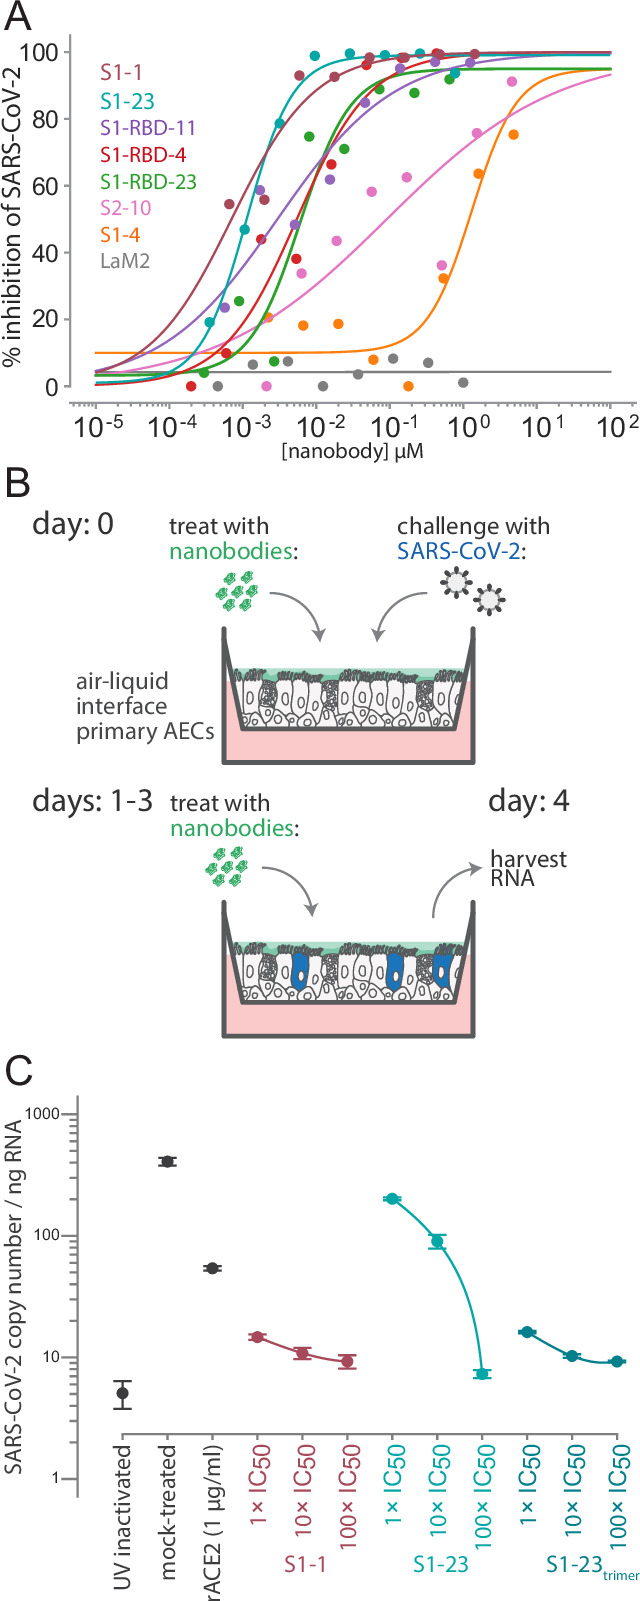
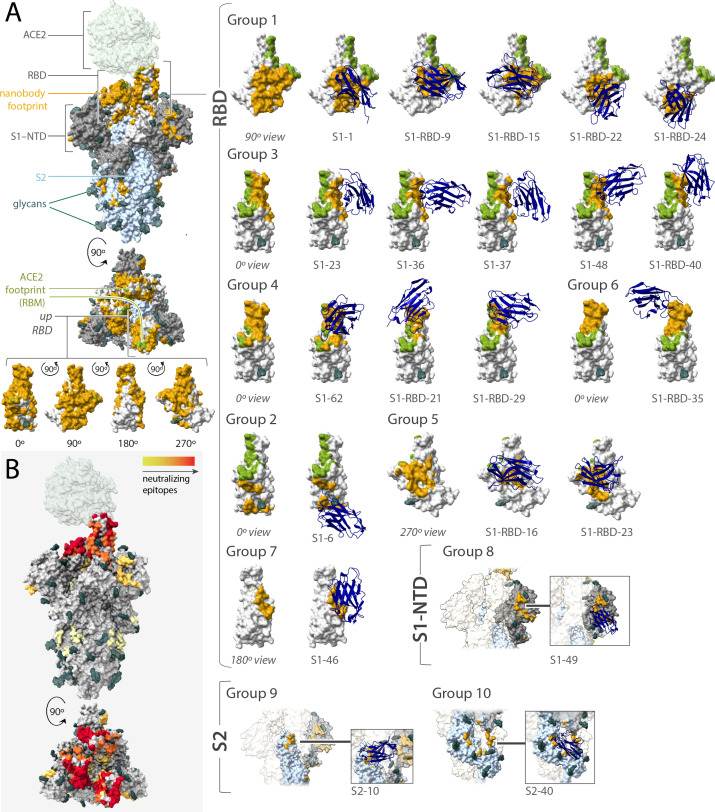
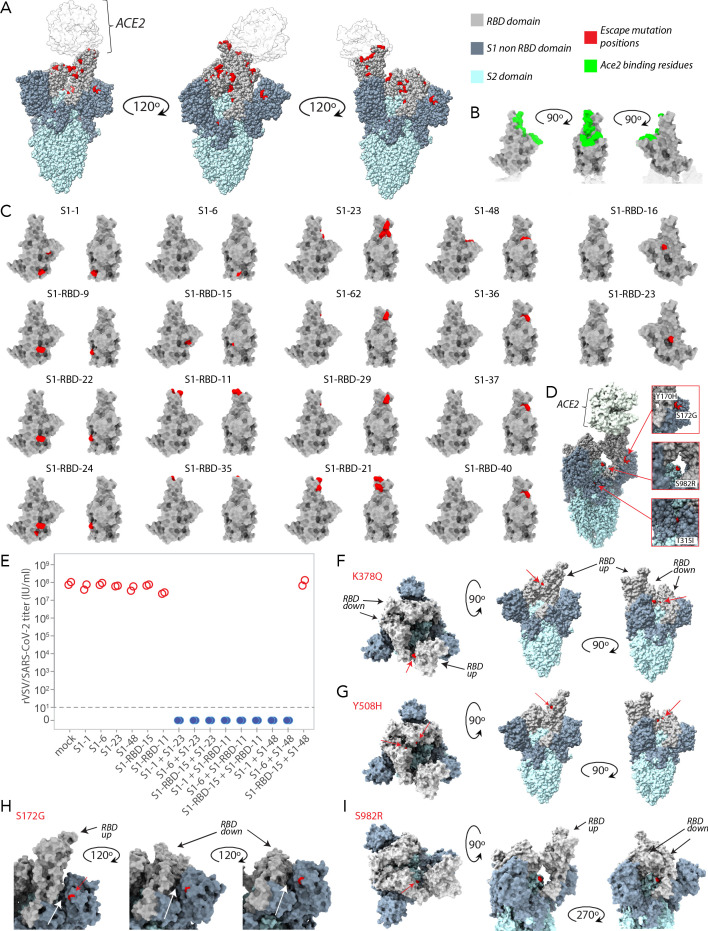
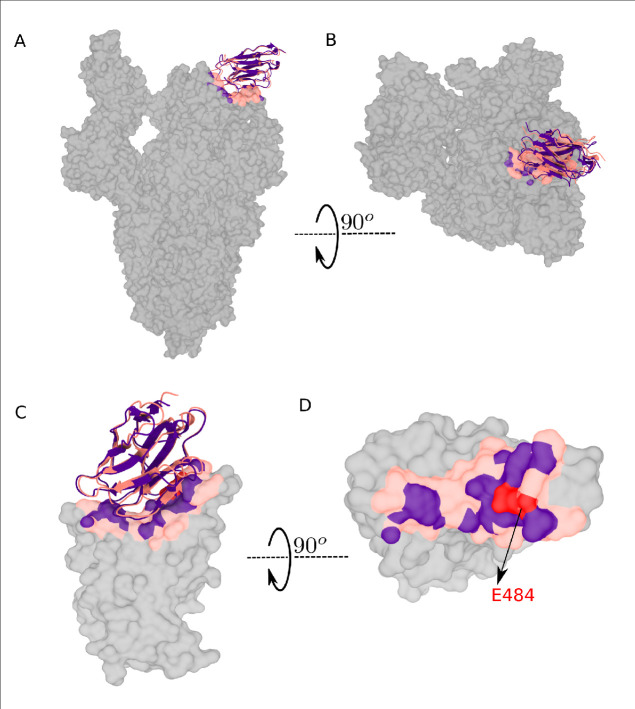
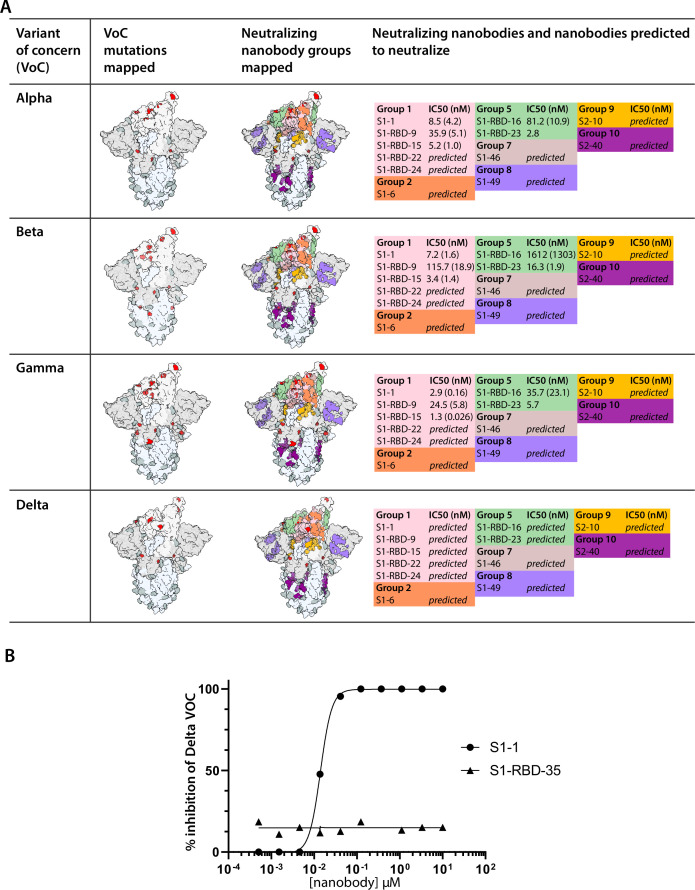
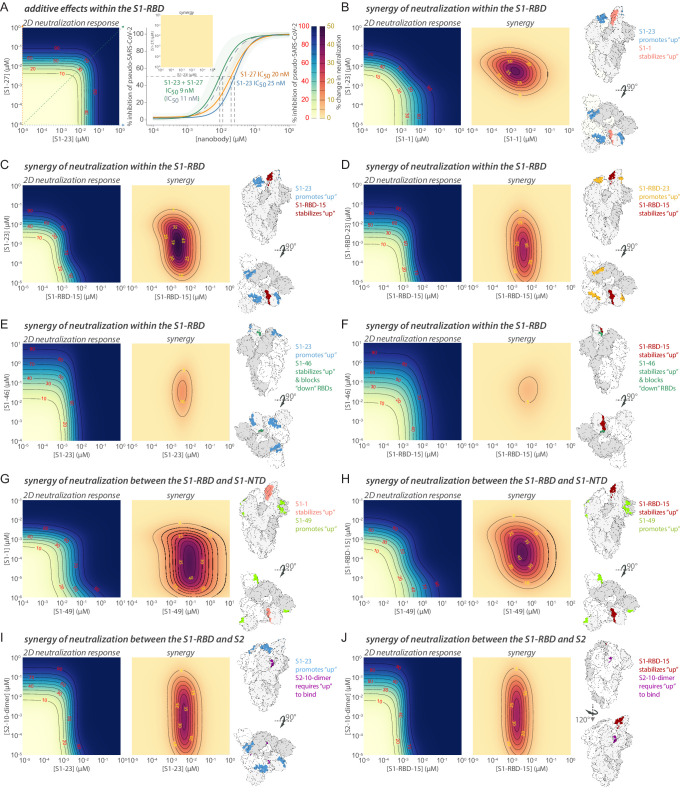
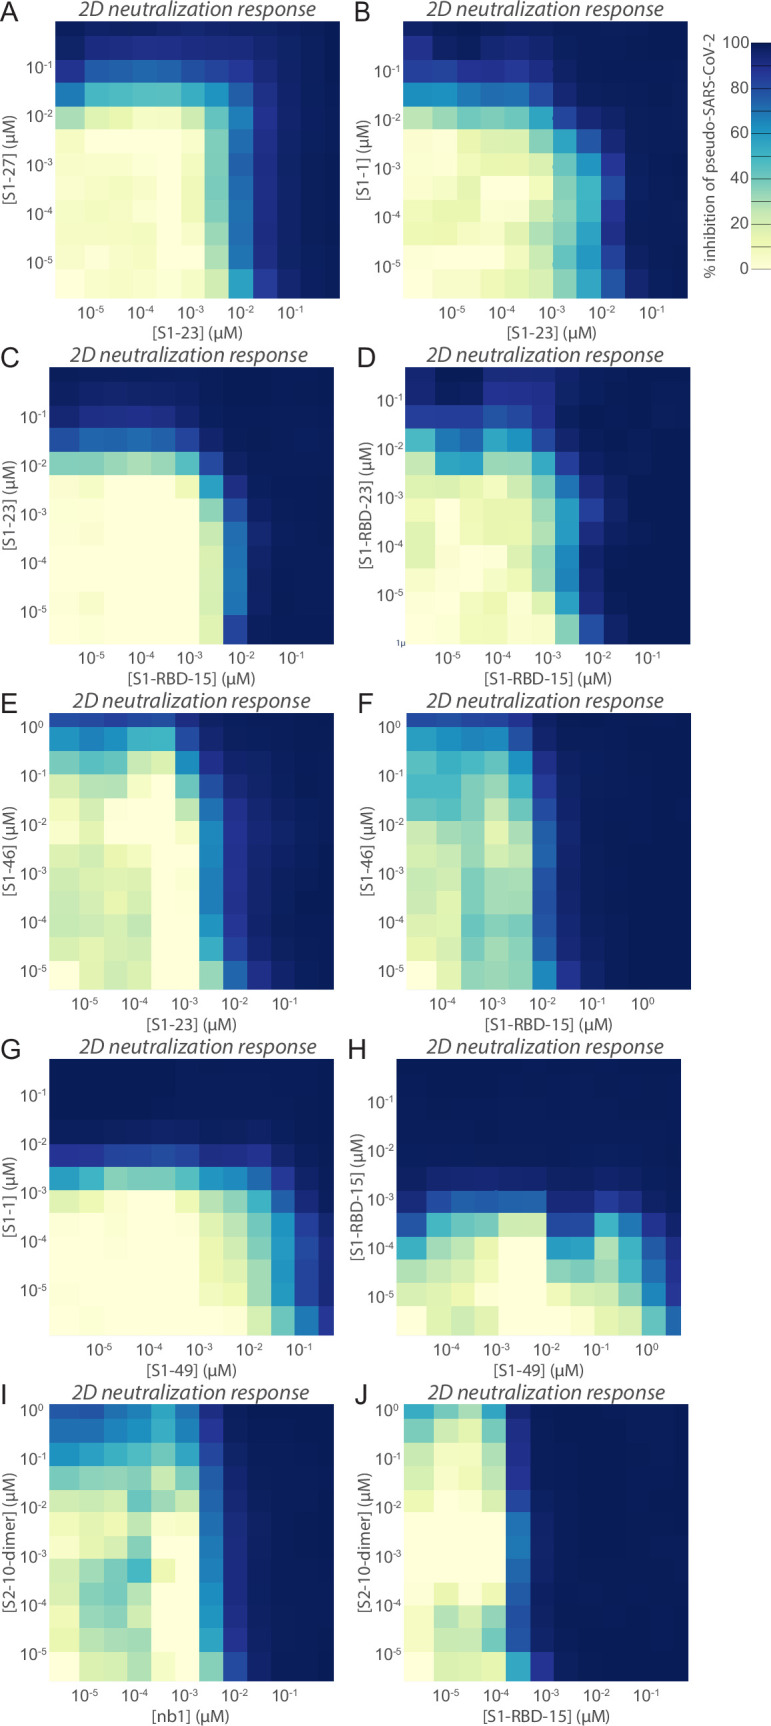
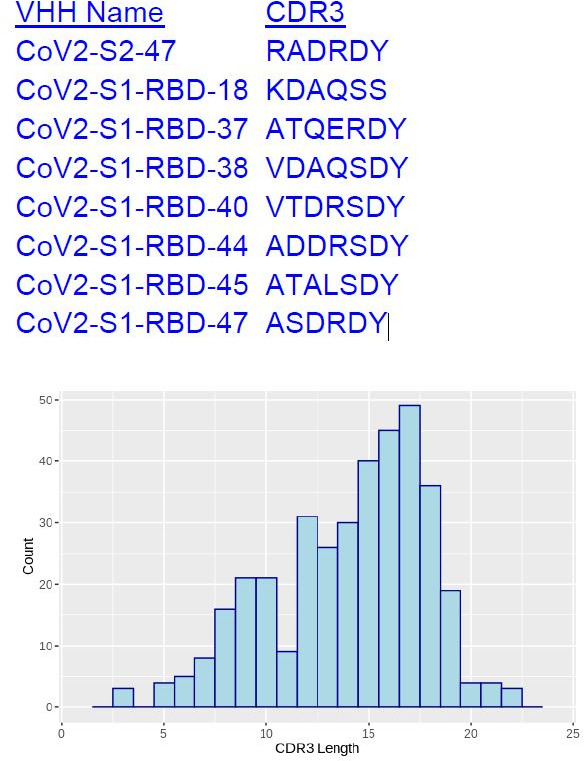
The emergence of SARS-CoV-2 variants threatens current vaccines and therapeutic antibodies and urgently demands powerful new therapeutics that can resist viral escape. We therefore generated a large nanobody repertoire to saturate the distinct and highly conserved available epitope space of SARS-CoV-2 spike, including the S1 receptor binding domain, N-terminal domain, and the S2 subunit, to identify new nanobody binding sites that may reflect novel mechanisms of viral neutralization. Structural mapping and functional assays show that indeed these highly stable monovalent nanobodies potently inhibit SARS-CoV-2 infection, display numerous neutralization mechanisms, are effective against emerging variants of concern, and are resistant to mutational escape. Rational combinations of these nanobodies that bind to distinct sites within and between spike subunits exhibit extraordinary synergy and suggest multiple tailored therapeutic and prophylactic strategies.

Keywords: SARS-CoV-2; human; infectious disease; microbiology; nanobodies; single-domain antibodies; spike glycoprotein; synergy; variants of concern.


Conflict of interest statement

FM, PF, NK, JW, EJ, JO, JA, BC, MR Inventor on a provisional patent describing the anti-spike nanobodies described in this manuscript, TS, KM, FS, MR, YW, LR, EV, ND, VV, SK, JJ, MS, PO, TH, DS, JD, DF, AS, PB No competing interests declared, LH Louis Herlands is affiliated with AbOde Therapeutics Inc. The author has no financial interests to declare

Figures

Figure 1.
Figure 1.. Approach.
(A) Schematic of our strategy for generating, identifying, and characterizing large, diverse repertoires of nanobodies that bind the spike protein of SARS-CoV-2. The highest quality nanobodies were assayed for their ability to neutralize SARS-CoV-2 pseudovirus, SARS-CoV-2 virus, and viral entry into primary human airway epithelial cells. We also measured the activities of homodimers/homotrimers and mixtures. (B) A network visualization of 374 high-confidence CDR3 sequences identified from the mass spectrometry workflow. Nodes (CDR3 sequences) were connected by edges defined by a Damerau–Levenshtein distance of no more than 3, forming 183 isolated components. A thicker edge indicates a smaller distance value, that is, a closer relation. (C) Dendrogram showing sequence relationships between the 116 selected nanobodies, demonstrating that the repertoire generally retains significant diversity in both anti-S1 (green) and anti-S2 (blue) nanobodies, albeit with a few closely related members. Scale, 0.2 substitutions per residue.
Figure 2.
Figure 2.. Biophysical characterization of anti-SARS-CoV-2 spike nanobodies.
(A) Each nanobody plotted against their affinity (KD) for their antigen separated into three groups based on their binding region on SARS-CoV-2 spike protein. The data points highlighted in blue correspond to nanobodies that neutralize. The majority of nanobodies have high affinity for their antigen with KDs below 1 nm. 10 nanobodies are not included in this plot as they were unable to be analyzed successfully using surface plasmon resonance (SPR). (B) SPR sensorgrams for each of the three targets on SARS-CoV-2 spike protein of our nanobody repertoire, showing three representatives for each binding region. (C) The association rate of each nanobody (kon) versus the corresponding dissociation rate (koff). The majority of our nanobodies have fast association rates (~10+5–10+7 M–1 s–1), with many surpassing the kon of high-performing monoclonal antibodies (~10+4–10+5 M–1 s–1). (D) Each nanobody plotted against their Tm as measured by differential scanning fluorimetry (DSF), revealing all but two nanobodies fall within a Tm range between 50 and 80°C, where the bulk of our nanobodies have a Tm ≥ 60°C. No data could be collected for two nanobodies, and 10 nanobodies exhibited two dominant peaks in the thermal shift assay and were not included in this plot (a full summary of this data can be seen in Tables 1–3). The KD (E) and Tm (F) of six nanobodies were assessed pre- and post-freeze-drying, revealing no significant change in affinity or Tm after freeze-drying. (G) SPR sensorgrams comparing the kinetic and affinity analysis of seven nanobodies against wild-type spike S1 (Wuhan strain), spike 20I/S1 501Y.V1 (alpha variant), and 20H/spike S1 501Y.V2 (beta variant).
Figure 2—figure supplement 1.
Figure 2—figure supplement 1.. Binding of nanobody candidates to immobilized antigen.
All nanobody candidates identified by (a) S1, (b) S1-RBD, or (c) S2 purification were expressed in bacterial periplasm, which was bound to the respective immobilized antigen protein. After washes, loaded input (L) and elution (E) samples were analyzed by Coomassie stained SDS-PAGE. Positive binders (blue) displayed a nanobody band in the elution, while negative candidates (gray) had none.
Figure 2—figure supplement 2.
Figure 2—figure supplement 2.. Quantified antigen binding of nanobody candidates.
All nanobody candidates were expressed in bacterial periplasm, which was bound to immobilized S1, S1-RBD, or S2 antigen protein. Bound nanobody was quantified by Coomassie staining after SDS-PAGE. Binding intensity against each antigen was normalized to the maximum observed binding among all nanobodies. Candidates with >20% maximum activity (blue) were selected for follow-up, while others (gray) were generally discarded.
Figure 3.
Figure 3.. Epitope characterization of nanobodies against SARS-CoV-2 spike.
(A) Major epitope bins are revealed by a clustered heat map of Pearson’s correlation coefficients computed from the response values of nanobodies binding to the spike RBD in pairwise cross-competition assays on a biolayer interferometer. Correlated values (red) indicate that the two nanobodies respond similarly when measured against a panel of 11 RBD nanobodies that bind to distinct regions of the RBD. A strong correlation score indicates binding to a similar/overlapping region on the RBD. Anticorrelated values (blue) indicate that a nanobody pair responds divergently when measured against nanobodies in the representative panel and indicate binding to distinct or non-overlapping regions on the RBD. (B) As in (A), but for 16 S1 non-RBD-binding nanobodies. (C) As in (A), but for 19 S2-binding nanobodies. (D) A network visualization of anti-S1-RBD nanobodies. Each node is a nanobody and each edge is a response value measured by biolayer interferometry from pairwise cross-competition assays. Orange nodes represent 11 nanobodies used as a representative panel for clustering analysis in (A). Blue nodes represent the other nanobodies in the dataset. The average shortest distance between any nanobody pair in the dataset is 1.64. An average clustering coefficient of 0.831 suggests that the measurements are well distributed across the dataset. The small world coefficient of 1.031 indicates that the network is more connected than to be expected from random, but the average path length is what you would expect from a random network, together indicating that the relationship between nanobody pairs not actually measured can be inferred from the similar/neighboring nanobodies. (E, F) As in (D) but for S1 non-RBD and S2 nanobodies, respectively. These are complete networks with every nanobody measured against the others in the dataset. (G) Mass photometry (MP) analysis of spike S1 monomer incubated with different anti-spike S1 nanobodies. Two examples of an increase in mass as spike S1 monomers (black line) are incubated with 1–3 nanobodies. The accumulation in mass upon addition of each different nanobody on spike S1 monomer is due to each nanobody binding to non-overlapping space on spike S1, an observation consistent with Octet binning data. As a control, using MP, each individual nanobody was shown to bind spike S1 monomers on its own (data not shown).
Figure 3—figure supplement 1.
Figure 3—figure supplement 1.. Mass photometry (MP) of non-RBD S1 nanobodies.
MP analysis of spike S1 monomer incubated with different non-RBD-binding anti-spike S1 nanobodies. There is either an accumulation in mass upon addition of each different nanobody on spike S1 monomer that is due to each nanobody binding to non-overlapping space on spike S1 or not, suggesting overlapping epitopes. These results, coupled with surface plasmon resonance (SPR) binning data, assisted the binning analysis for non-RBD anti-S1 nanobodies.
Figure 4.
Figure 4.. Diverse and potent nanobody-based neutralization of SARS-CoV-2.
Nanobodies targeting the S1-RBD, S1 non-RBD, and S2 portions of spike effectively neutralize lentivirus pseudotyped with various SARS-CoV spikes and their variants from infecting ACE2 expressing HEK293T cells. (A) Of the 116 nanobodies, monomers that neutralize SARS-CoV-2 pseudovirus with IC50 values 20 nM and lower are displayed. (B) Representative nanobodies targeting the non-RBD portions of S1 and (C) the S2 domain of SARS-CoV-2 neutralize SARS-CoV-2 pseudovirus. (D–F) Oligomerization of RBD, S1 non-RBD, and S2 nanobodies significantly increases neutralization potency. (G) Summary scatter plot of all nanobody IC50s across the major domains of SARS-CoV-2 spike and where tested, across SARS-CoV-2 variant 20H/501Y.V2 and SARS-CoV-1. Representative published nanobodies were also tested in our neutralization assays and show similar potency towards SARS-CoV-2 pseudovirus. From Xiang et al., 2020: (1) Nb-21 (IC50 2.4 nM); (2) Nb-34 (IC50 5.6 nM); and (3) Nb-93 (IC50 123 nM). From Wrapp, 2020a: (4) VHH-72 (IC50 2.5 μM). (H–K) Representative SARS-CoV-2 RBD targeting nanobodies cross-neutralize the 20I/501Y.V1/alpha variant with H69-, V70-, Y144- amino acid deletions and N501Y, A570D, D614G, P681H, T716I, S982A, and D1118H amino acid substitutions in spike (H); the 20H/501Y.V2/beta variant with L18F, D80A, K417N, E484K, and N501Y amino acid substitutions in spike; (I) 20J/501Y.V3/gamma variant with L18F, T20N, P26S, D138Y, R190S, K417T, E484K, N501Y, D614G, H655Y, T1027I, and V1176F amino acid substitutions in spike (J); and SARS-CoV-1 spike pseudotyped lentivirus (K). In all cases, n ≥ 2 biological replicates of each nanobody monomer/oligomer with a representative biological replicate with n = 4 technical replicates per dilution are displayed. See also Table 1, Table 2, Table 4, and Table 5.
Figure 4—figure supplement 1.
Figure 4—figure supplement 1.. Correlation between pseudovirus assays.
IC50s of the 25 nanobodies tested in both lentiviral and VSV-based pseudovirus assays with wild-type SARS-CoV-2 spike were plotted to compare the values obtained from each system, showing a strong correlation.
Figure 5.
Figure 5.. Authentic SARS-CoV-2 neutralization by anti-spike nanobodies.
(A) Nanobodies neutralize the authentic SARS-CoV-2 virus with similar kinetics as the SARS-CoV-2 pseudovirus. Neutralization curves are plotted from the results of a focus-forming reduction neutralization assay with the indicated nanobodies. Serial dilutions of each nanobody were incubated with SARS-CoV-2 (MOI 0.5) for 60 min and then overlaid on a monolayer of Vero E6 cells and incubated for 24 hr. LaM2, an anti-mCherry nanobody (Fridy et al., 2014a), was used as a non-neutralizing control. After 24 hr, cells were collected and stained with anti-spike antibodies and the ratio of infected to uninfected cells was quantified by flow cytometry. (B) A schematic of an air-liquid interface (ALI) culture of primary human airway epithelial cells (AECs) as a model for SARS-CoV-2 infection. Cells were incubated with nanobodies and then challenged with SARS-CoV-2 (MOI 0.5). After daily treatment with nanobodies for three more days, the cultures are harvested to isolate RNA and quantify the extent of infection. (C) Potent neutralization of authentic SARS-CoV-2 in AECs. The AECs were infected with the indicated concentrations of anti-SARS-CoV-2 spike nanobodies. The infected cultures were maintained for 5 days with a daily 1 hr incubation of nanobodies before being harvested for RNA isolation and determination of the SARS-CoV-2 copy number by qPCR. SARS-CoV-2 copy number was normalized to total RNA measured by spectrophotometry. Mock-treated samples exposed to infectious and UV-inactivated SARS-CoV-2 virions served as positive and negative controls. Recombinant soluble angiotensin converting enzyme 2 (rACE2) was used as a positive treatment control. The indicated nanobodies were used at 1, 10, and 100× their IC50 values determined in pseudovirus neutralization assays (Table 1 and Table 4).
Figure 6.
Figure 6.. Epitope coverage of the 21 structural models of anti-spike SARS-CoV-2 nanobodies and neutralization potential of each epitope.
(A) The structure of SARS-CoV-2 full spike (PDB ID: 6VYB) solved via cryo-EM with one RBD in the up position overlaid with the crystal structure of RBD bound to ACE2 (PDB ID: 6M0J). Key elements of spike are colored as follows: RBD (white), S1-NTD (gray), and S2 (light blue). All 21 modeled nanobody footprints are colored gold on full spike with the ACE2 footprint (RBM) colored green. Full coverage of the 18 anti-RBD modeled nanobody footprints on RBD is seen in four different orientations. All 21 nanobodies are categorized into 10 groups based on their footprint on spike where groups 1–7 are anti-RBD nanobodies; group 8 contains an anti-S1-NTD nanobody and groups 9 and 10 contain anti-S2 nanobodies. (B) Heatmap of neutralizing epitopes on the structure of SARS-CoV-2 full spike (PDB ID: 6VYB). Epitopes are colored from pale yellow (epitopes with weak neutralization against SARS-CoV-2) to dark red (strong neutralization against SARS-CoV-2).
Figure 6—figure supplement 1.
Figure 6—figure supplement 1.. Mapping of spike substitutions in rVSV/SARS-CoV-2/GFP escape mutants obtained in the presence of the corresponding nanobody.
(A) Mapped on to the structure of SARS-CoV-2 spike trimer in complex with one ACE2 molecule (PDB ID: 7KNB, used for all SARS-CoV-2 spike trimer representations) is the position of neutralization-resistant amino acid substitutions (in red), also known as ‘escape mutants’ that were generated in response to cultivation of rVSV/SARS-CoV-2/GFP in the presence of each nanobody, and were subsequently shown to confer resistance to the same nanobody. (B) Structure of the SARS-CoV-2 RBD (PDB ID: 6M0J) showing the positions of amino acid residues (in green) that form the ACE2 binding site, for reference. (C) Structure of the SARS-CoV-2 RBD (PDB ID: 6M0J) showing the positions (in red) of the location of substitutions that confer resistance for each nanobody tested in two orientations 90° apart. For structure pairs of S1-RBD-16 and S1-RBD-23 escape mutants, the rotation is 90° from the structure to the left in the pair. (D) The location of four key non-RBD escape mutants S172G, Y170H, T315I, and S982R resulting from assays performed with the anti-S1 non-RBDs S1-49, S1-3, S1-30, and anti-S2 (S2-10) nanobodies, respectively. (E) Infectious rVSV/SARS-CoV-2/GFP yield (IU/ml) following two passages in the presence of the indicated individual nanobodies or nanobody combinations, at 100 IC50 of the individual nanobodies, or 50 IC50 of each of the nanobodies in the combinations. Each data point represents an independent titer measurement. Red open circles represent virus escapes while blue circles represent nanobody combinations for which no escapes (titer = 0) were detected. The location of two escape mutants K378Q (F) and Y508H (G) mapped onto SARS-CoV-2 spike trimer for the two corresponding nanobodies S1-RBD-9 and S1-RBD-15, respectively, revealing an exposed putative nanobody binding site on RBD when in the ‘up’ position that is hidden when RBD is in the ‘down’ position. (H) A close-up of escape mutant S172G on each monomer of SARS-CoV-2 spike trimer revealing a larger crevice between the NTD of spike S1 and RBD when the RBD is in the ‘down’ position compared to the ‘up’ position. (I) Three orientations of SARS-CoV-2 spike trimer revealing the position in all three orientations of escape mutant S982R revealing the putative binding site for nanobody S2-10 is accessible regardless of whether the RBD is the ‘up’ or ‘down’ position.
Figure 6—figure supplement 2.
Figure 6—figure supplement 2.. Comparison between RBD-Nb21 interface modeled with Integrative Modeling Platform (IMP) (red) with cryo-EM structure (7N9B) of the co-complex (indigo, taken from Sun et al., 2021).
IMP modeling was done using the 6M0J.E structure of the RBD (residues 333–526), which was subsequently aligned with the corresponding region of the down RBD from 7N9B.A, to compare the modeled and experimental binary complexes. (A) and (B) show the binding modes and the epitopes on the whole spike while (C) and (D) focus on just the 333–526 region of the RBD. Based on the observation that the point mutation E484K/Q significantly inhibits Nb21 binding (Sun et al., 2021), we treat E484 as an effective escape mutant for Nb21 to benchmark our computational model developed in IMP. Both the epitope (defined as all RBD residues within 6 Å of any Nb21 residue) and the binding mode (i.e., relative orientation) of Nb21 agree between the IMP model and the cryo-EM structure to within 2.1 Å backbone RMSD.
Figure 6—figure supplement 3.
Figure 6—figure supplement 3.. Nanobody groups resistant or predicted to be resistant against SARS-CoV-2 variants of concern (VOC).
(A) Color-coded and mapped on the structure of SARS-CoV-2 spike trimer with one RBD in the ‘up’ conformation (PDB ID: 7BNN) are the footprints of eight nanobody groups determined, which are mapped relative to the mutations found on four key SARS-CoV-2 VOC. Summarized are the nanobodies that make up each group and where applicable their degree of neutralization. The nanobody footprints are taken from the integrative modeling of these nanobodies on SARS-CoV-2 spike trimer (see Figure 6). (B) Neutralization of authentic SARS-CoV-2 isolate WA-1 and an isolate of the delta variant of concern (B.1.617.2) in a plaque reduction neutralization test assay. Serial dilutions of S1-1 and S1-RBD-35 were incubated with each SARS-CoV-2 variant for 60 min and then overlaid on a monolayer of Vero E6 cells and incubated for 90 min. Following infection, the cell cultures incubated for 48 hr before the number of visualized plaques were counted to determine the half maximal inhibitory concentration of each nanobody.
Figure 7.
Figure 7.. Synergistic neutralization of spike with nanobody cocktails.
(A) An example of additive effects between two anti-SARS-CoV-2 spike nanobodies. S1-23 and S1-27 were prepared in a two-dimensional serial dilution matrix and then incubated with SARS-CoV-2 pseudovirus for 1 hr before adding the mixture to cells. After 56 hr, the expression of luciferase in each well was measured by addition of Steady-Glo reagent and read out on a spectrophotometer. The left panel shows a heatmap of pseudovirus neutralization by a two-dimensional serial dilution of combinations of S1-23 and S1-27. Lines and red numbers demarcate the % inhibition, that is, inhibitory concentration where X% of the virus is neutralized, e.g., IC50. Dark blue regions are concentrations that potently neutralize the pseudovirus, as per the heatmap legend. The right panel shows neutralization curves (with 90% confidence interval bands) and the calculated IC50 of each nanobody alone, or in a 1:1 combination was determined along with a calculated IC50 based on the theoretical additive mixture model of the pair (curve with dotted gray line). The inset shows a difference (synergy) map calculated as the difference between the parameterized 2D neutralization response and that expected in a null model of only additive effects. Here, no difference is observed. (B) S1-1 synergizes with S1-23 in neutralizing SARS-CoV-2 pseudovirus. The left panel shows the heatmap of pseudovirus neutralization observed by a two-dimensional serial dilution of combinations of S1-1 and S1-23. The middle panel shows a heatmap mapping the synergy of neutralization observed for this pair. The lines bounding the darker purple areas demarcate regions in the heatmap where the observed neutralization is greater than additive by the indicated percentages (yellow numbers), as per the heatmap legend. The right panel shows two representations of spike with the accessible S1-1 (salmon) and S1-23 (steel blue) epitopes (PDB ID: 6VYB). (C–J) Examples of synergy between nanobodies binding the S1-RBD, or between the S1-RBD and S1-NTD or S2 domains of spike. The layout is as found in (B), but comparing S1-RBD-15 with S1-23 (C), S1-RBD-15 with S1-RBD-23 (D), S1-23 with S1-46 (E), S1-RBD-15 with S1-46 (F), S1-49 with S1-1 (G), S1-49 with S1-RBD-15 (H), S1-23 with S2-10-dimer (I), and S1-RBD-15 with S2-10-dimer (J).
Figure 7—figure supplement 1.
Figure 7—figure supplement 1.. Heatmaps of nanobody synergy.
Neutralization of pseudovirus harboring the SARS-CoV-2 spike by pairs of nanobodies. The normalized % neutralization is visualized on a 2D grid of nanobody concentrations where each nanobody has been titrated in the background of the other tested nanobody. Nanobody concentrations are indicated on their respective axes for (A) S1-23 and S1-27, (B) S1-23 and S1-1, (C) S1-RBD-15 and S1-23, (D) S1-RBD-15 and S1-RBD-23, (E) S1-23 and S1-46, (F) S1-RBD-15 and S1-46, (G) S1-49 and S1-1, (H) S1-49 and S1-RBD-15, (I) S1-23 and S2-10-dimer, and (J) S1-RBD-15 and S2-10-dimer.
Author response image 1.

Update of

  • Nanobody Repertoires for Exposing Vulnerabilities of SARS-CoV-2.
    Mast FD, Fridy PC, Ketaren NE, Wang J, Jacobs EY, Olivier JP, Sanyal T, Molloy KR, Schmidt F, Rutkowska M, Weisblum Y, Rich LM, Vanderwall ER, Dambrauskas N, Vigdorovich V, Keegan S, Jiler JB, Stein ME, Olinares PDB, Hatziioannou T, Sather DN, Debley JS, Fenyö D, Sali A, Bieniasz PD, Aitchison JD, Chait BT, Rout MP. Mast FD, et al. bioRxiv [Preprint]. 2021 Apr 10:2021.04.08.438911. doi: 10.1101/2021.04.08.438911. bioRxiv. 2021. Update in: Elife. 2021 Dec 07;10:e73027. doi: 10.7554/eLife.73027. PMID: 33851164 Free PMC article. Updated. Preprint.

References

    1. Aida Y, Pabst MJ. Removal of endotoxin from protein solutions by phase separation using Triton X-114. Journal of Immunological Methods. 1990;132:191–195. doi: 10.1016/0022-1759(90)90029-u. - DOI - PubMed
    1. Andreano E, Nicastri E, Paciello I, Pileri P, Manganaro N, Piccini G, Manenti A, Pantano E, Kabanova A, Troisi M, Vacca F, Cardamone D, De Santi C, Torres JL, Ozorowski G, Benincasa L, Jang H, Di Genova C, Depau L, Brunetti J, Agrati C, Capobianchi MR, Castilletti C, Emiliozzi A, Fabbiani M, Montagnani F, Bracci L, Sautto G, Ross TM, Montomoli E, Temperton N, Ward AB, Sala C, Ippolito G, Rappuoli R. Extremely potent human monoclonal antibodies from COVID-19 convalescent patients. Cell. 2021;184:1821–1835. doi: 10.1016/j.cell.2021.02.035. - DOI - PMC - PubMed
    1. Bannas P, Hambach J, Koch-Nolte F. Nanobodies and nanobody-based human heavy chain antibodies as antitumor therapeutics. Frontiers in Immunology. 2017;8:1603. doi: 10.3389/fimmu.2017.01603. - DOI - PMC - PubMed
    1. Bard G. Spelling-Error Tolerant, Order-Independent Pass-Phrases via the Damerau–Levenshtein String-Edit Distance Metric. Darlinghurst, Australia: Australian Computer Society, Inc; 2007.
    1. Barnes CO, Jette CA, Abernathy ME, Dam K-MA, Esswein SR, Gristick HB, Malyutin AG, Sharaf NG, Huey-Tubman KE, Lee YE, Robbiani DF, Nussenzweig MC, West AP, Jr, Bjorkman PJ. SARS-CoV-2 neutralizing antibody structures inform therapeutic strategies. Nature. 2020;588:682–687. doi: 10.1038/s41586-020-2852-1. - DOI - PMC - PubMed

Publication types