. 2021 Dec 7:10:e67995.
doi: 10.7554/eLife.67995.

Challenges for assessing replicability in preclinical cancer biology

Affiliations

Challenges for assessing replicability in preclinical cancer biology

Timothy M Errington et al. Elife. .

Abstract

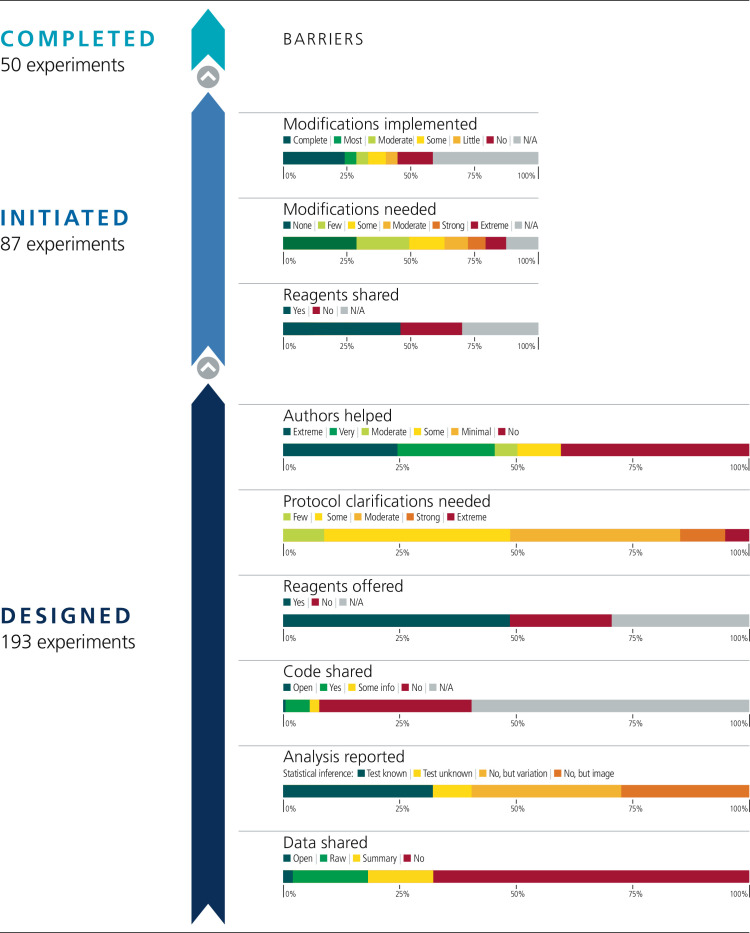
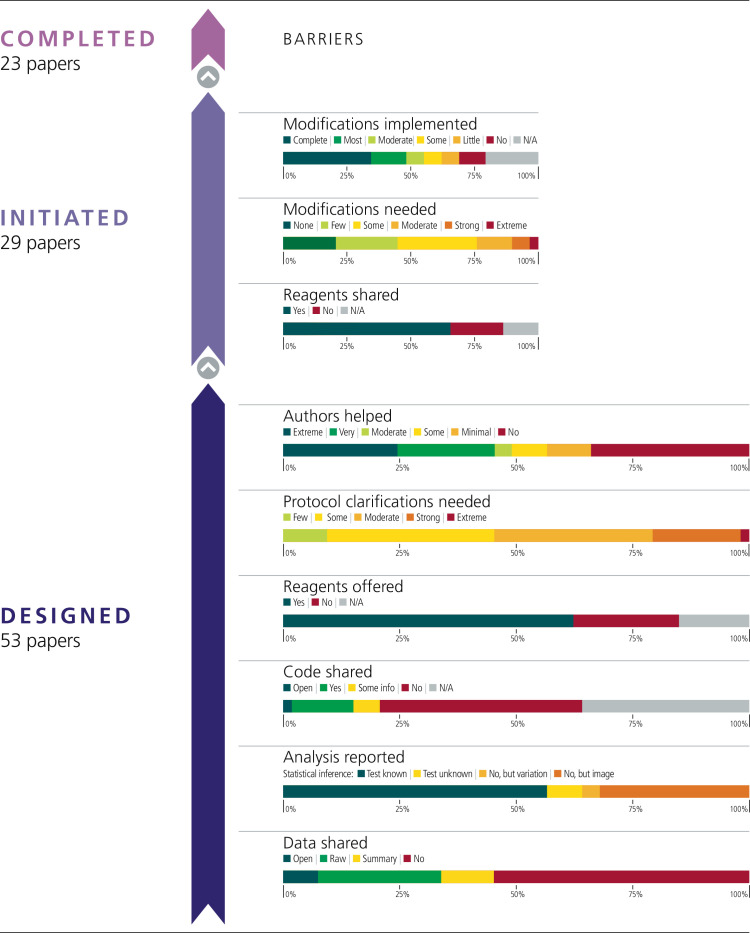
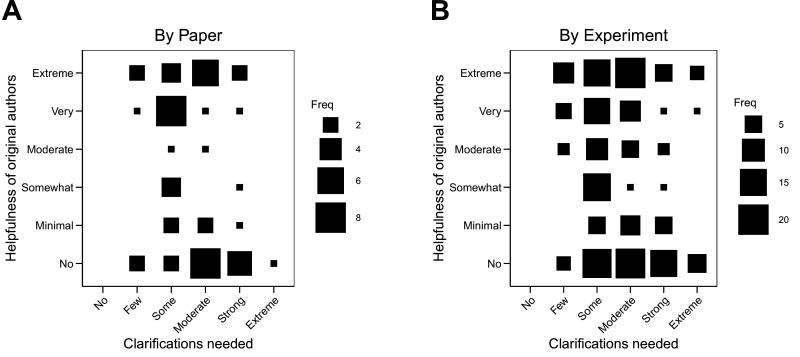
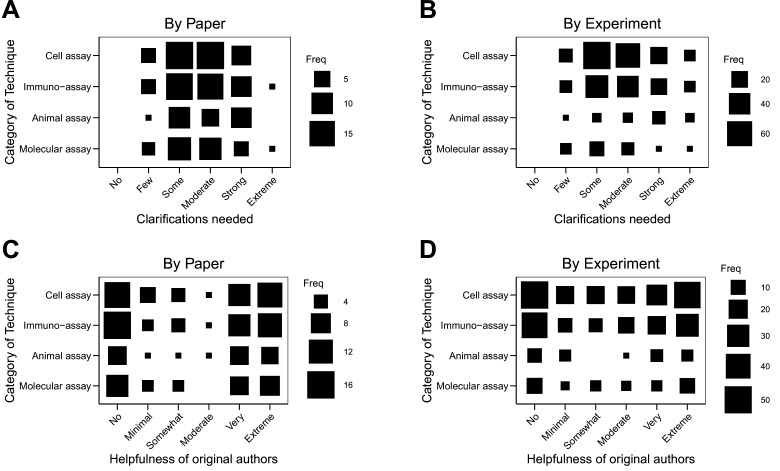
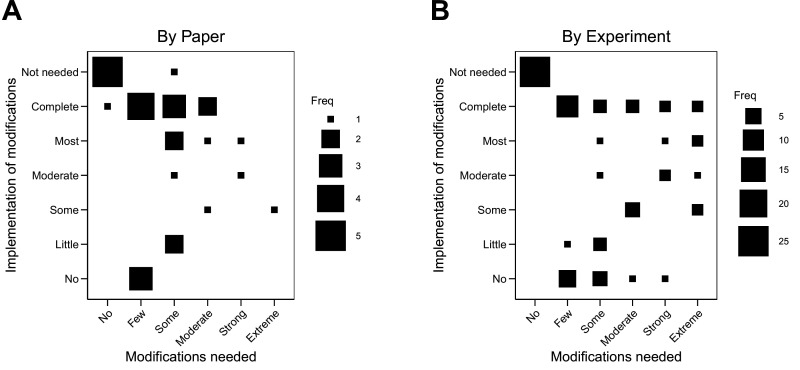
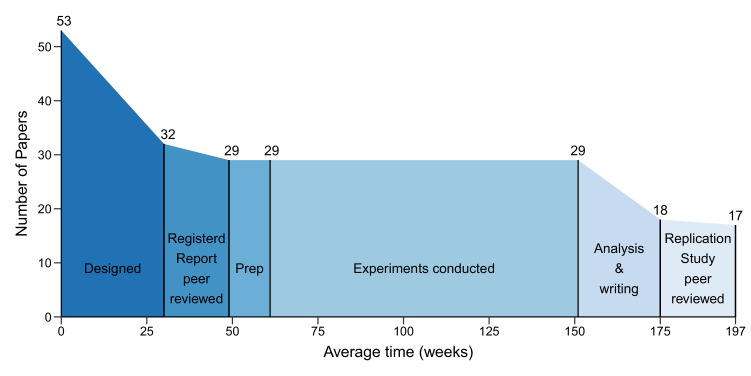
We conducted the Reproducibility Project: Cancer Biology to investigate the replicability of preclinical research in cancer biology. The initial aim of the project was to repeat 193 experiments from 53 high-impact papers, using an approach in which the experimental protocols and plans for data analysis had to be peer reviewed and accepted for publication before experimental work could begin. However, the various barriers and challenges we encountered while designing and conducting the experiments meant that we were only able to repeat 50 experiments from 23 papers. Here we report these barriers and challenges. First, many original papers failed to report key descriptive and inferential statistics: the data needed to compute effect sizes and conduct power analyses was publicly accessible for just 4 of 193 experiments. Moreover, despite contacting the authors of the original papers, we were unable to obtain these data for 68% of the experiments. Second, none of the 193 experiments were described in sufficient detail in the original paper to enable us to design protocols to repeat the experiments, so we had to seek clarifications from the original authors. While authors were extremely or very helpful for 41% of experiments, they were minimally helpful for 9% of experiments, and not at all helpful (or did not respond to us) for 32% of experiments. Third, once experimental work started, 67% of the peer-reviewed protocols required modifications to complete the research and just 41% of those modifications could be implemented. Cumulatively, these three factors limited the number of experiments that could be repeated. This experience draws attention to a basic and fundamental concern about replication - it is hard to assess whether reported findings are credible.

Keywords: Reproducibility Project: Cancer Biology; cancer biology; human; mouse; open data; open science; preregistration; replication; reproducibility.


Conflict of interest statement

TE, AD, BN Employed by the nonprofit Center for Open Science that has a mission to increase openness, integrity, and reproducibility of research, NP, EI Employed by and hold shares in Science Exchange Inc

Figures

Figure 1.
Figure 1.. Barriers to conducting replications – by experiment.
During the design phase of the project the 193 experiments selected for replication were coded according to six criteria: availability and sharing of data; reporting of statistical analysis (i.e., did the paper describe the tests used in statistical analysis?; if such tests were not used, did the paper report on biological variation (e.g., graph reporting error bars) or representative images?); availability and sharing of analytic code; did the original authors offer to share key reagents?; what level of protocol clarifications were needed from the original authors?; how helpful were the responses to those requests? The 29 Registered Reports published by the project included protocols for 87 experiments, and these experiments were coded according to three criteria: were reagents shared by the original authors?; did the replication authors have to make modifications to the protocol?; were these modifications implemented? A total of 50 experiments were completed.
Figure 1—figure supplement 1.
Figure 1—figure supplement 1.. Barriers to conducting replications – by paper.
This figure is similar to Figure 1, except that the results for the experiments have been combined to give results for the papers that contained the experiments. Experiments from 53 papers were coded during the design phase; experiments from 29 papers were initiated; and results from 23 papers were published. Two methods were used to convert the scores for experiments into scores for papers. For four criteria (protocol clarifications needed; authors helped; modifications needed; modifications implemented) the average of the scores from the experiments was assigned to the paper. For five criteria (data shared; analysis reported; code shared; reagents offered; reagents shared), scoring was conducted with a 'liberal' interpretation for sharing: for example, if data were shared for just one experiment in a paper, the paper was coded as data shared. See main text for further details.
Figure 2.
Figure 2.. Relationship between extent of clarification needed and helpfulness of authors.
Fluctuation plots showing the coded ratings for extent of clarifications needed from original authors and the degree to which authors were helpful in providing feedback and materials for designing the replication experiments. The size of the square shows the number (Freq) of papers/experiments for each combination of extent of clarification needed and helpfulness. (A) To characterize papers (N = 53), coded ratings were averaged across experiments for each paper. The average number of experiments per paper was 3.6 (SD = 1.9; range = 1–11). The Spearman rank-order correlation between extent of clarification needed and helpfulness was –0.24 (95% CI [–0.48, 0.03]) across papers. (B) For experiments (N = 193), the Spearman rank-order correlation between extent of clarification needed and helpfulness was –0.20 (95% CI [–0.33, –0.06]).
Figure 2—figure supplement 1.
Figure 2—figure supplement 1.. Techniques used in the original experiments.
A total of 820 experimental techniques were identified in the 193 experiments selected for replication at the start of the project. These techniques were coded into 48 sub-categories, which were grouped into four categories (cell assays; immunoassays; animal assays; molecular assays).
Figure 2—figure supplement 2.
Figure 2—figure supplement 2.. Relationship between extent of clarification needed or helpfulness with category of techniques.
Fluctuation plots showing the coded ratings for the category of techniques used in the original experiments and the extent of clarification needed from the original authors by paper (A) and by experiment (B). Fluctuation plots showing the category of techniques and the helpfulness of the original authors by paper (C) and by experiment (D). The size of the square shows the number (Freq) of papers/experiments for each combination. The average number of categories used in the 193 experiments was 2.2 (SD = 0.7; range = 1–4). To characterize papers (N = 53), coded ratings were averaged across the experiments for each paper; the average number of categories used per paper was 2.9 (SD = 0.7; range = 1–4).
Figure 3.
Figure 3.. Relationship between extent of modifications needed and implementation of modifications.
Fluctuation plots showing the coded ratings for extent of modifications needed in order to conduct the replication experiments, and the extent to which the replication authors were able to implement these modifications for experiments that were conducted. The size of the square shows the number (Freq) of papers/experiments for each combination. (A) To characterize papers (N = 29), coded ratings were averaged across the experiments conducted for each paper. The average number of experiments conducted per paper was 2.6 (SD = 1.3; range = 1–6), and the Spearman rank-order correlation between extent of modifications needed and implementation was –0.01 (95% CI [–0.42, 0.40]). (B) For the experiments that were started (N = 76), the Spearman rank-order correlation was 0.01 (95% CI [–0.27, 0.28]).
Figure 4.
Figure 4.. The different phases of the replication process.
Graph showing the number of papers entering each of the six phases of the replication process, and the mean duration of each phase in weeks. 53 papers entered the design phase, which started with the selection of papers for replication and ended with submission of a Registered Report (mean = 30 weeks; median = 31; IQR = 21–37). 32 papers entered the protocol peer reviewed phase, which ended with the acceptance of a Registered Report (mean = 19 weeks; median = 18; IQR = 15–24). 29 papers entered the preparation phase (Prep), which ended when experimental work began (mean = 12 weeks; median = 3; IQR = 0–11). The mean for the prep phase was much higher than the median (and outside the IQR) because this phase took less than a week for many studies, but much longer for a small number of studies. The same 29 papers entered the conducted phase, which ended when the final experimental data were delivered (mean = 90 weeks; median = 88; IQR = 44–127), and the analysis and writing phase started, which ended with the submission of a Replication Study (mean = 24 weeks; median = 23; IQR = 7–32). 18 papers entered the results peer review phase, which ended with the acceptance of a Replication Study (mean = 22 weeks; median = 18; IQR = 15–26). In the end, 17 Replication Studies were accepted for publication. The entire process had a mean length of 197 weeks and a median length of 181 weeks (IQR = 102–257).

Comment in

References

    1. Aird F, Kandela I, Mantis C, Reproducibility Project: Cancer Biology Replication Study: BET bromodomain inhibition as a therapeutic strategy to target c-Myc. eLife. 2017;6:e21253. doi: 10.7554/eLife.21253. - DOI - PMC - PubMed
    1. Allen C, Mehler DMA. Open science challenges, benefits and tips in early career and beyond. PLOS Biology. 2019;17:e3000246. doi: 10.1371/journal.pbio.3000246. - DOI - PMC - PubMed
    1. Anderson MS, Martinson BC, De Vries R. Normative dissonance in science: results from a national survey of U.S. scientists. Journal of Empirical Research on Human Research Ethics. 2007;2:3–14. doi: 10.1525/jer.2007.2.4.3. - DOI - PubMed
    1. Arthur JC, Perez-Chanona E, Mühlbauer M, Tomkovich S, Uronis JM, Fan TJ, Campbell BJ, Abujamel T, Dogan B, Rogers AB, Rhodes JM, Stintzi A, Simpson KW, Hansen JJ, Keku TO, Fodor AA, Jobin C. Intestinal inflammation targets cancer-inducing activity of the microbiota. Science. 2012;338:120–123. doi: 10.1126/science.1224820. - DOI - PMC - PubMed
    1. Baker D, Lidster K, Sottomayor A, Amor S. Two years later: journals are not yet enforcing the ARRIVE guidelines on reporting standards for pre-clinical animal studies. PLOS Biology. 2014;12:e1001756. doi: 10.1371/journal.pbio.1001756. - DOI - PMC - PubMed

Publication types