. 2022 Feb 15;43(5):359-375.
doi: 10.1002/jcc.26795. Epub 2021 Dec 7.

CHARMM-GUI Drude prepper for molecular dynamics simulation using the classical Drude polarizable force field

Affiliations

CHARMM-GUI Drude prepper for molecular dynamics simulation using the classical Drude polarizable force field

Abhishek A Kognole et al. J Comput Chem. .

Abstract

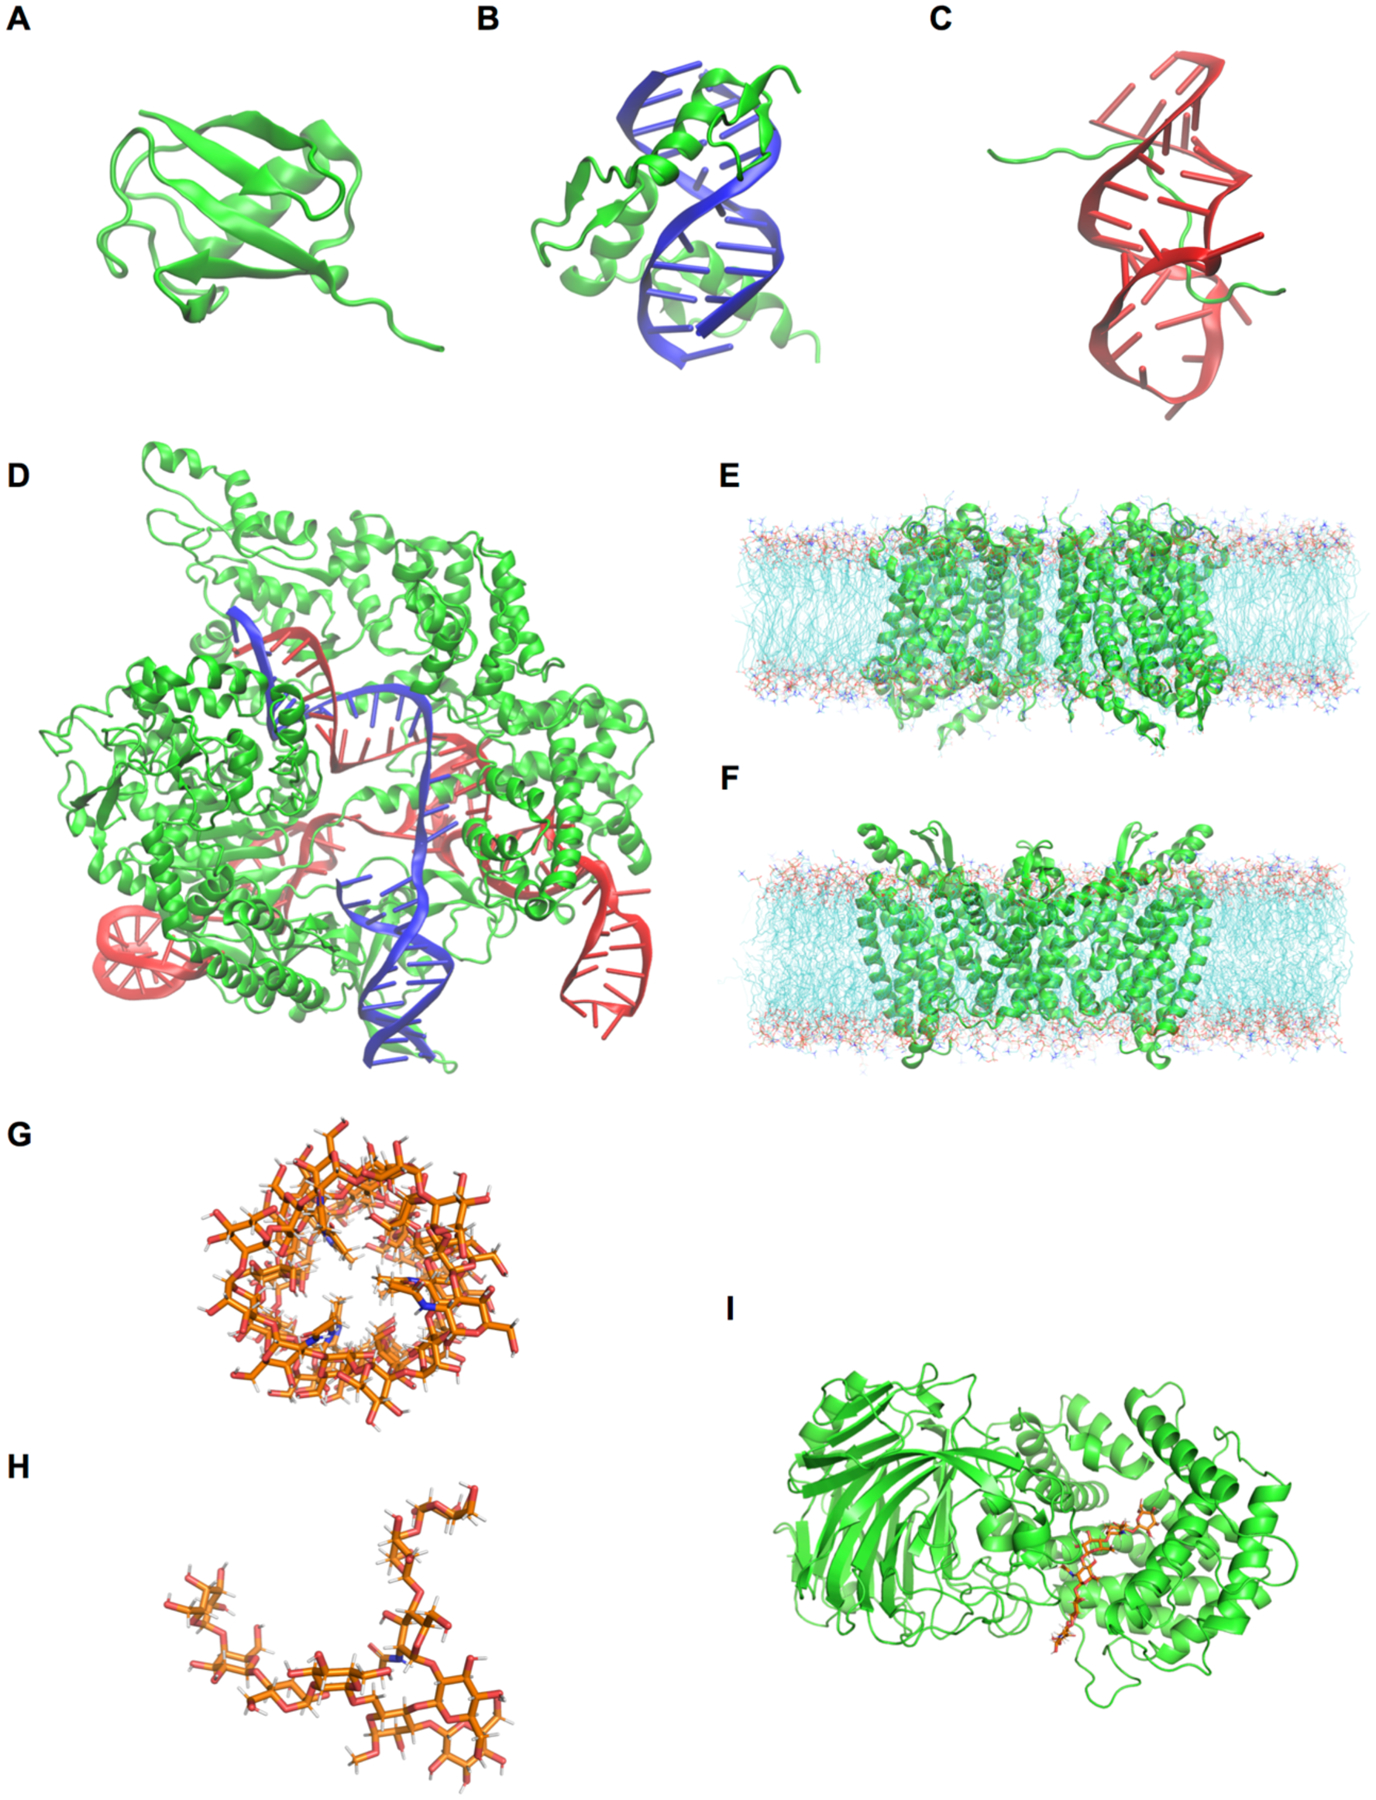
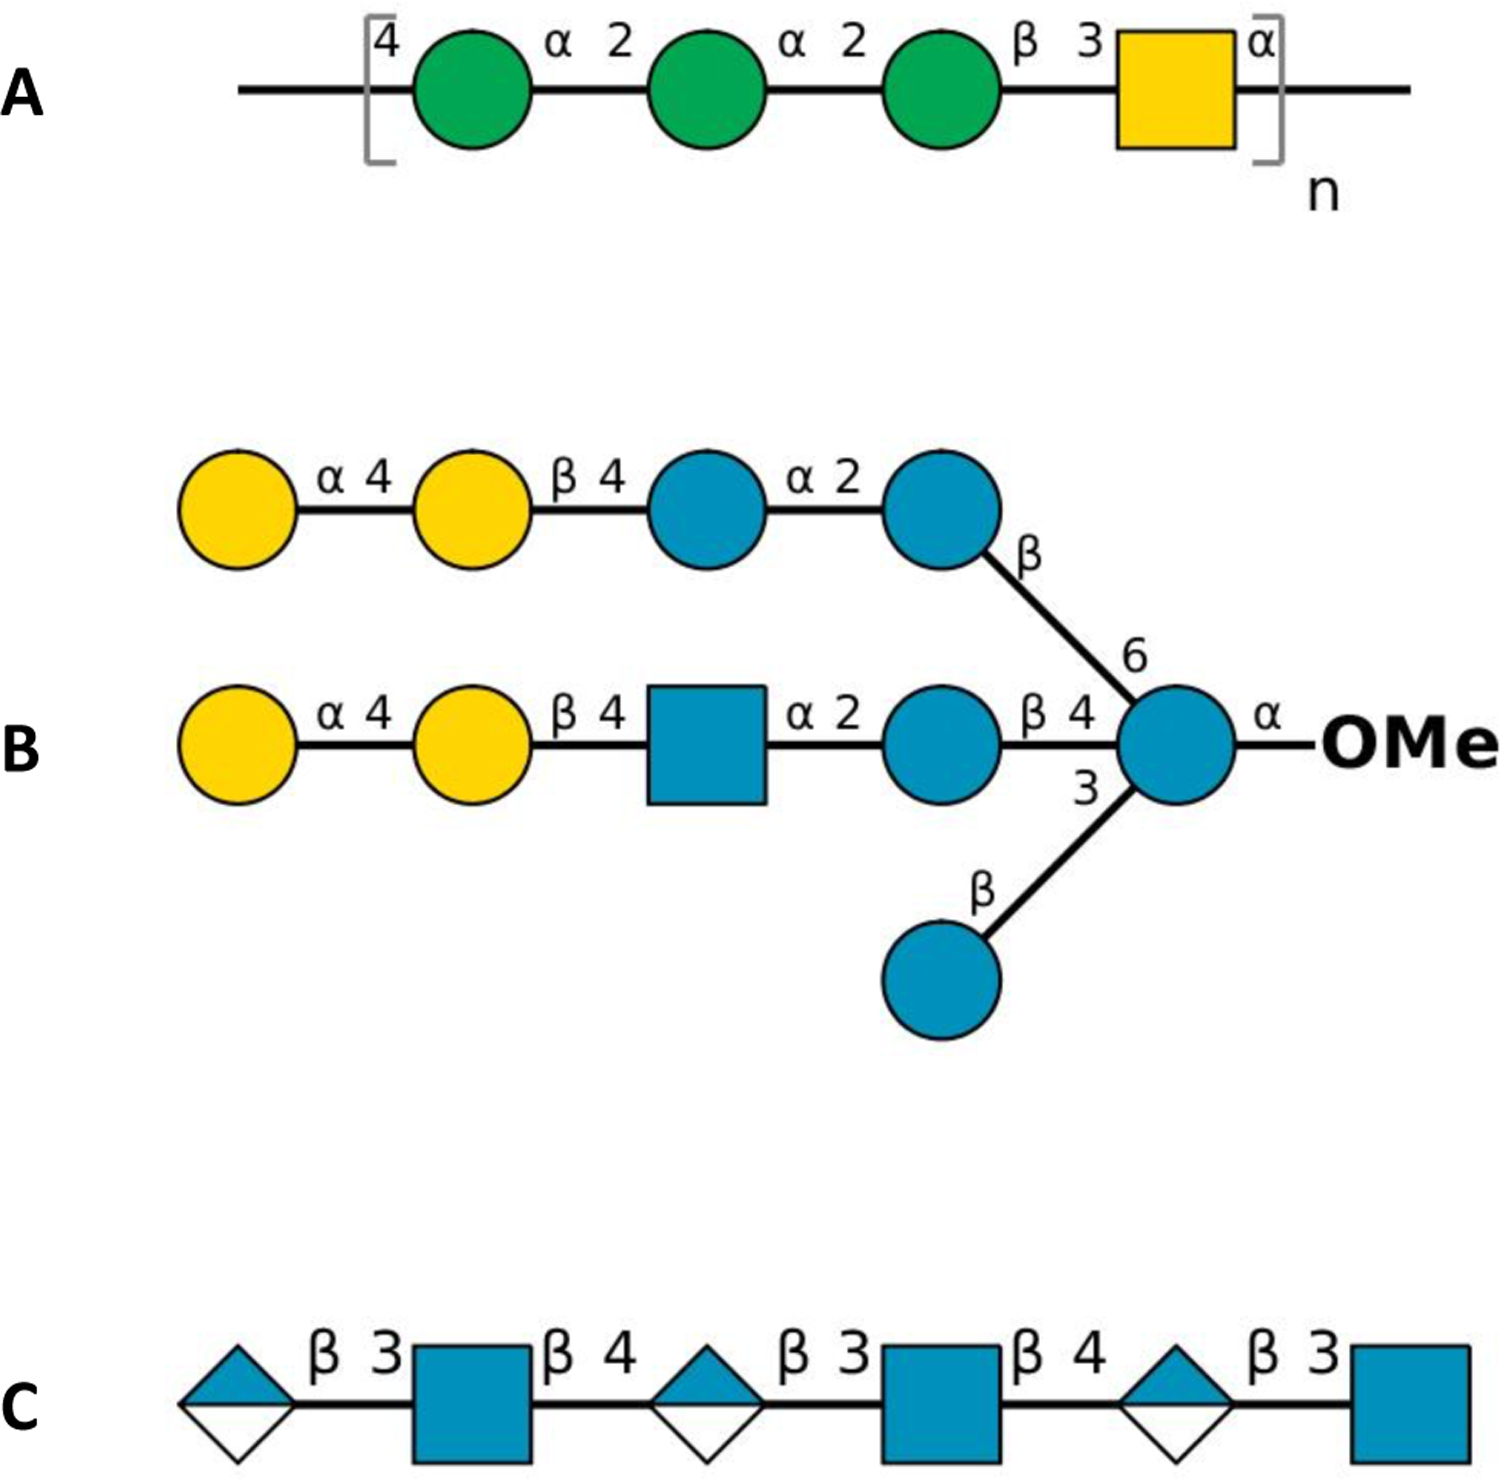
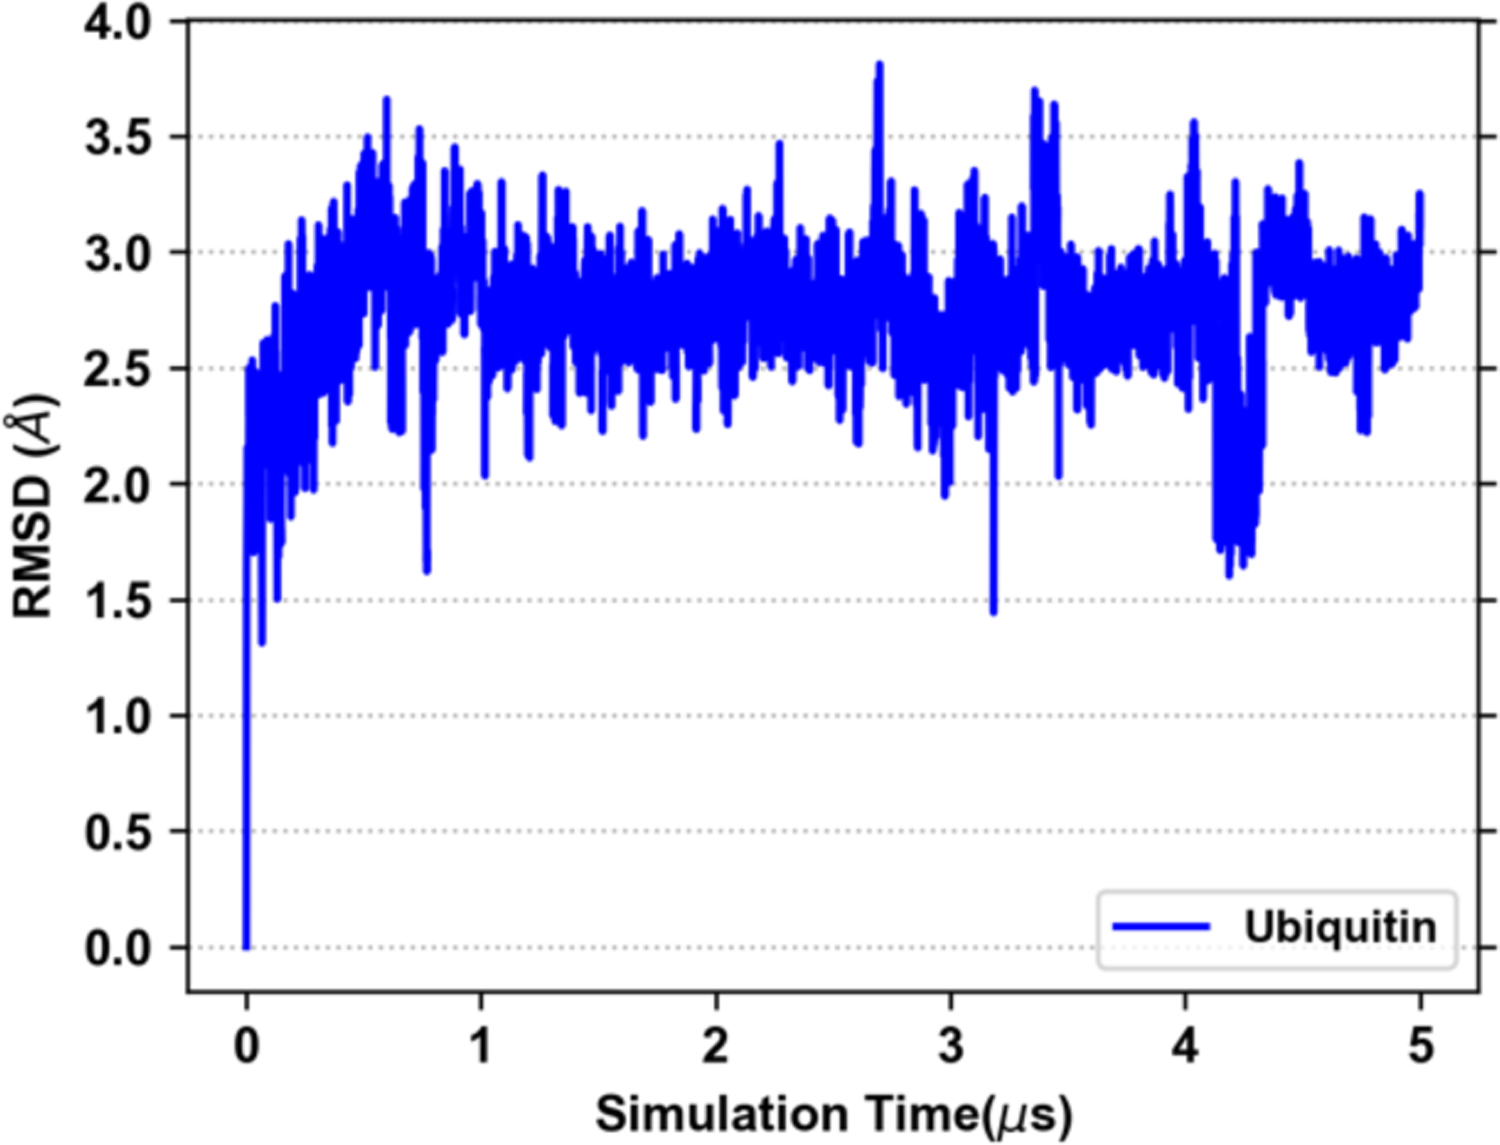
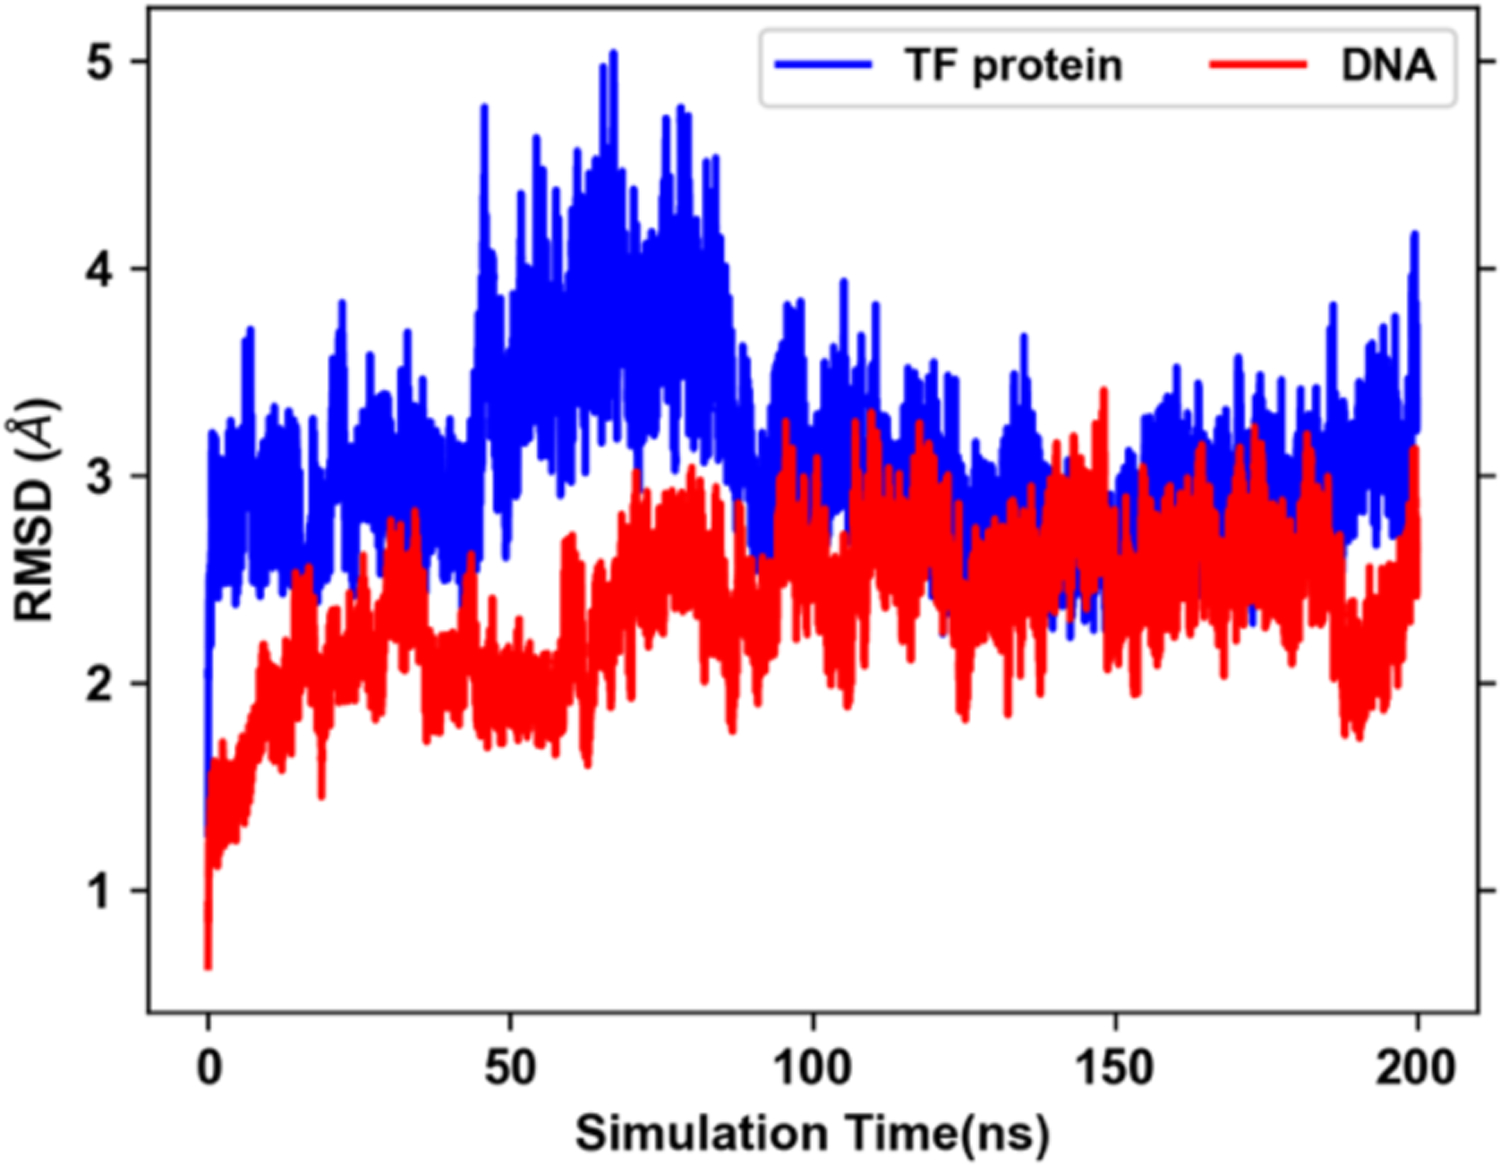
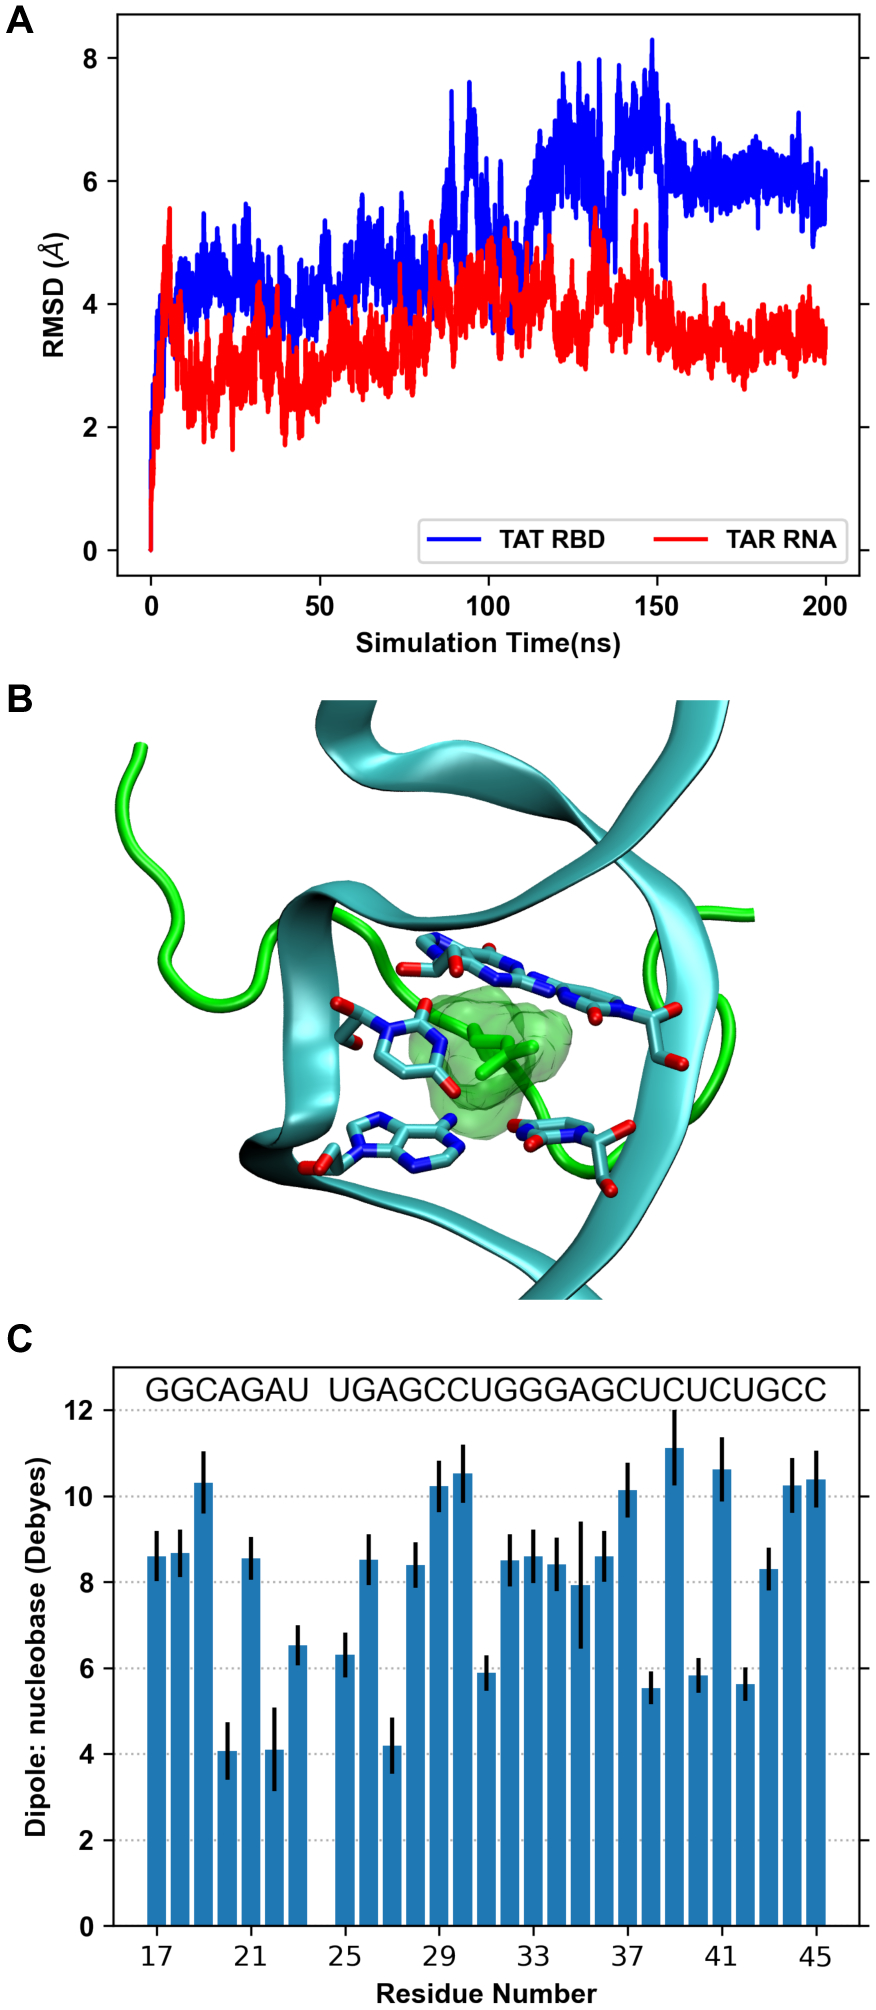
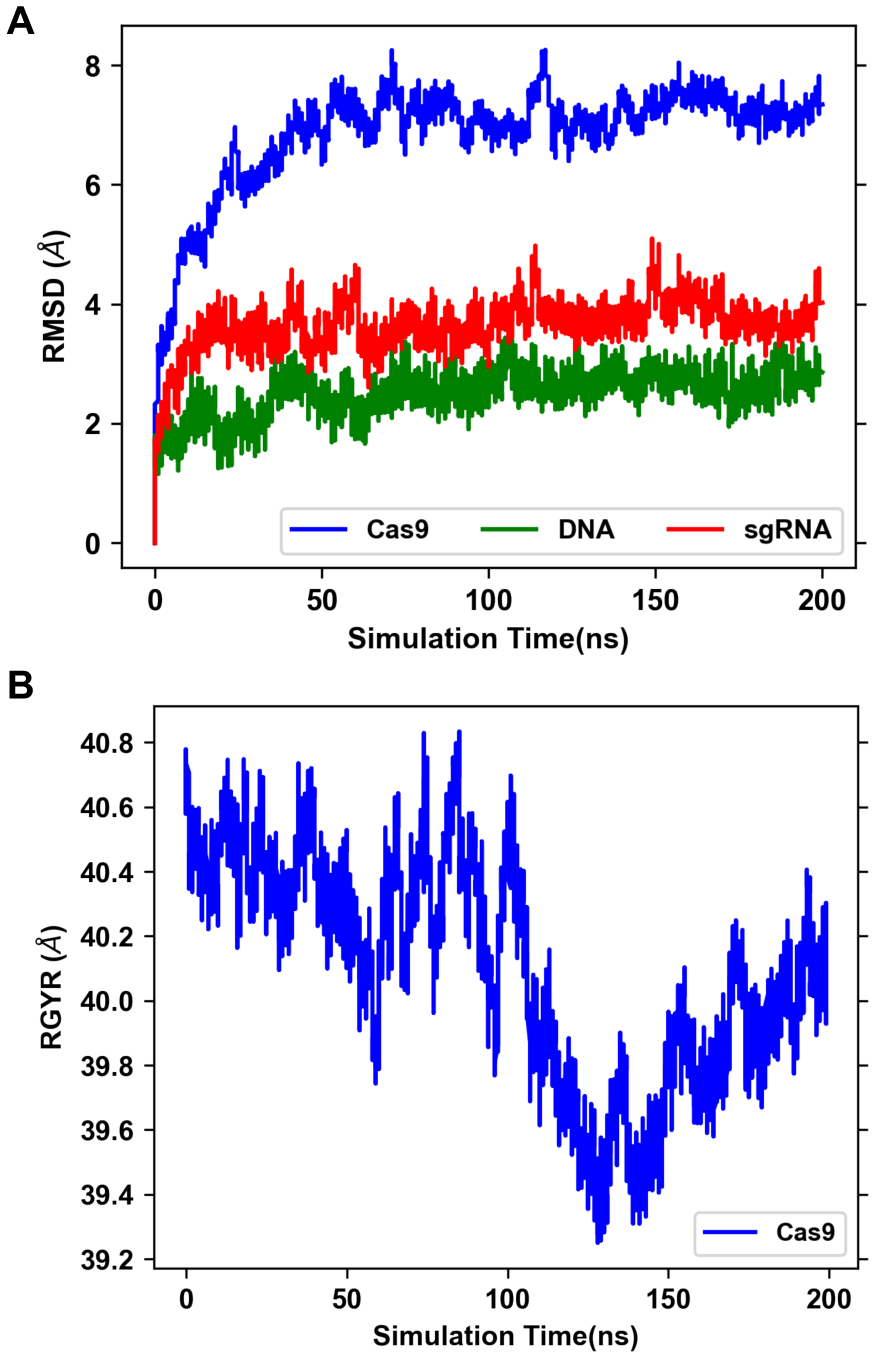
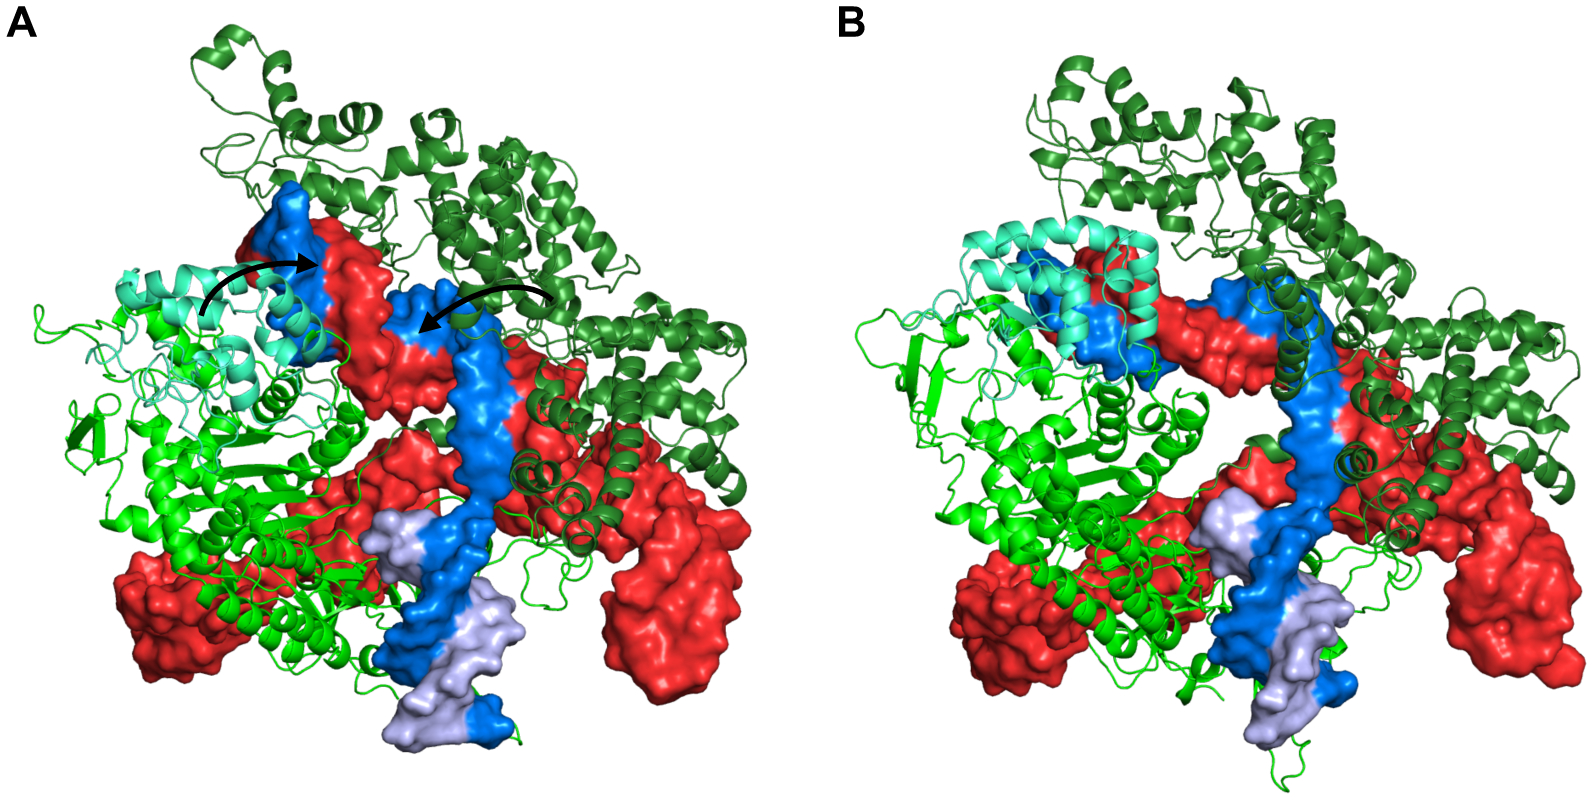
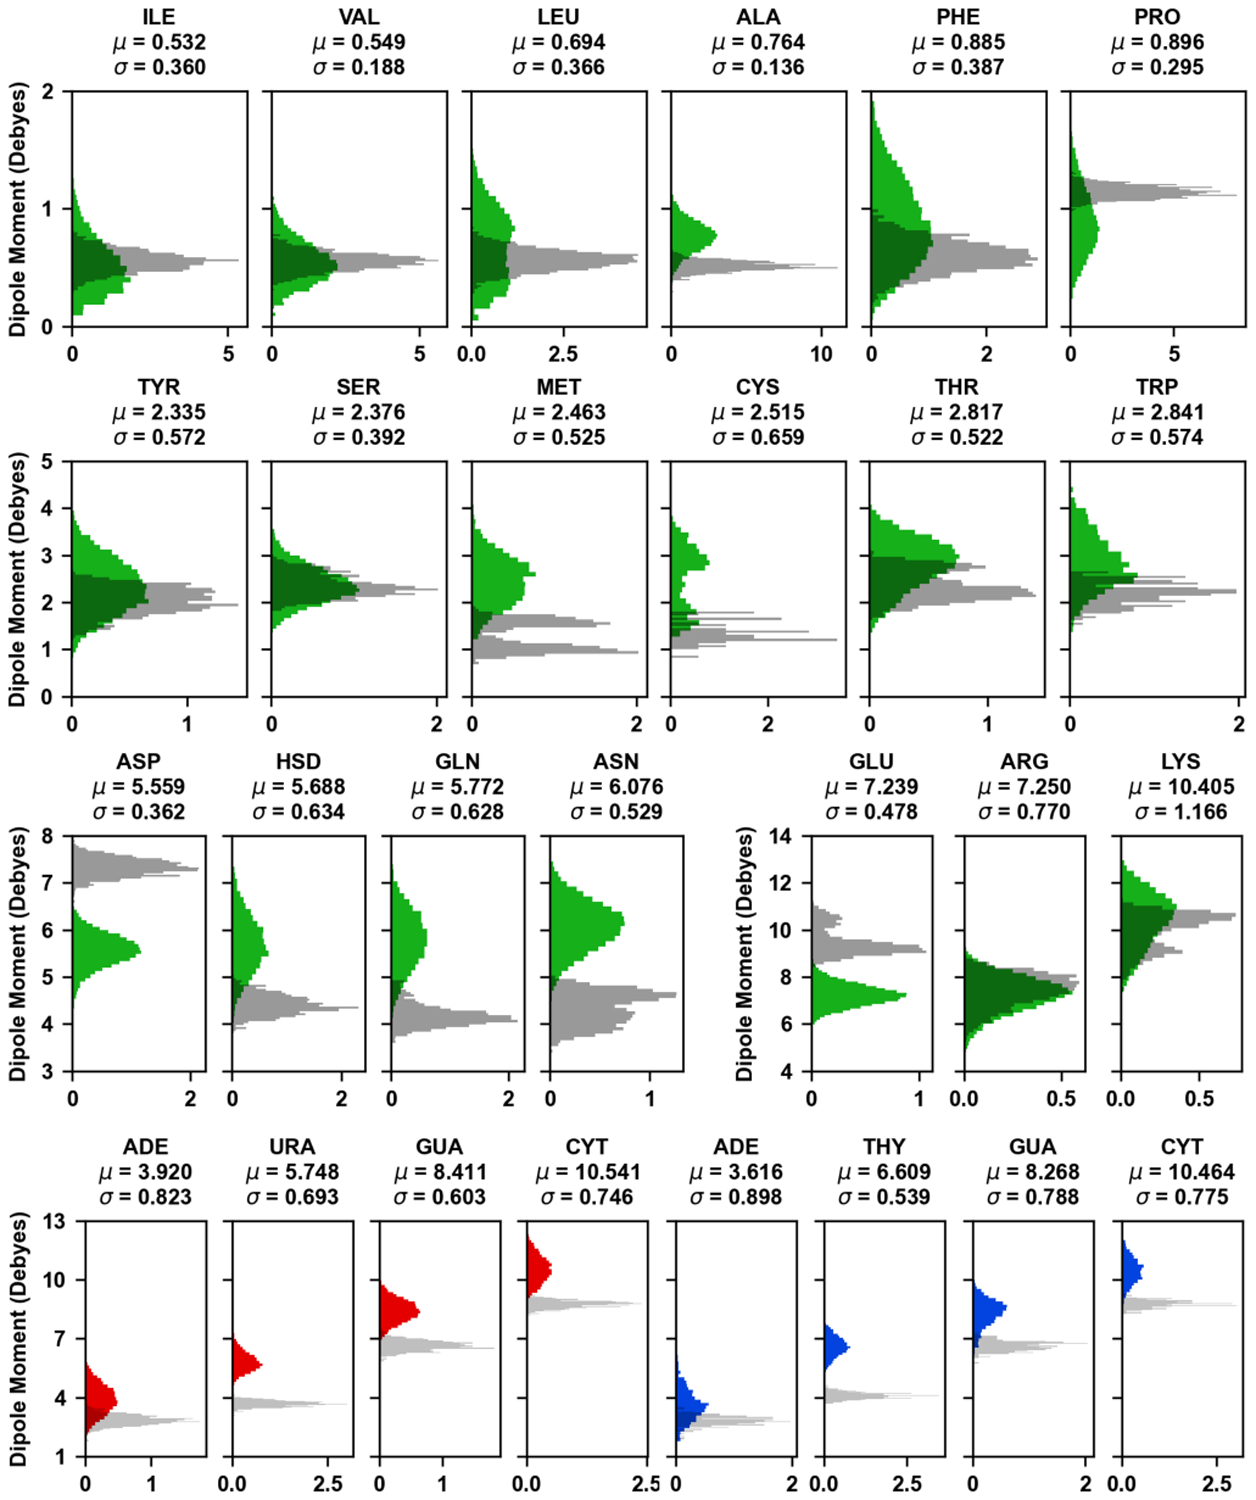
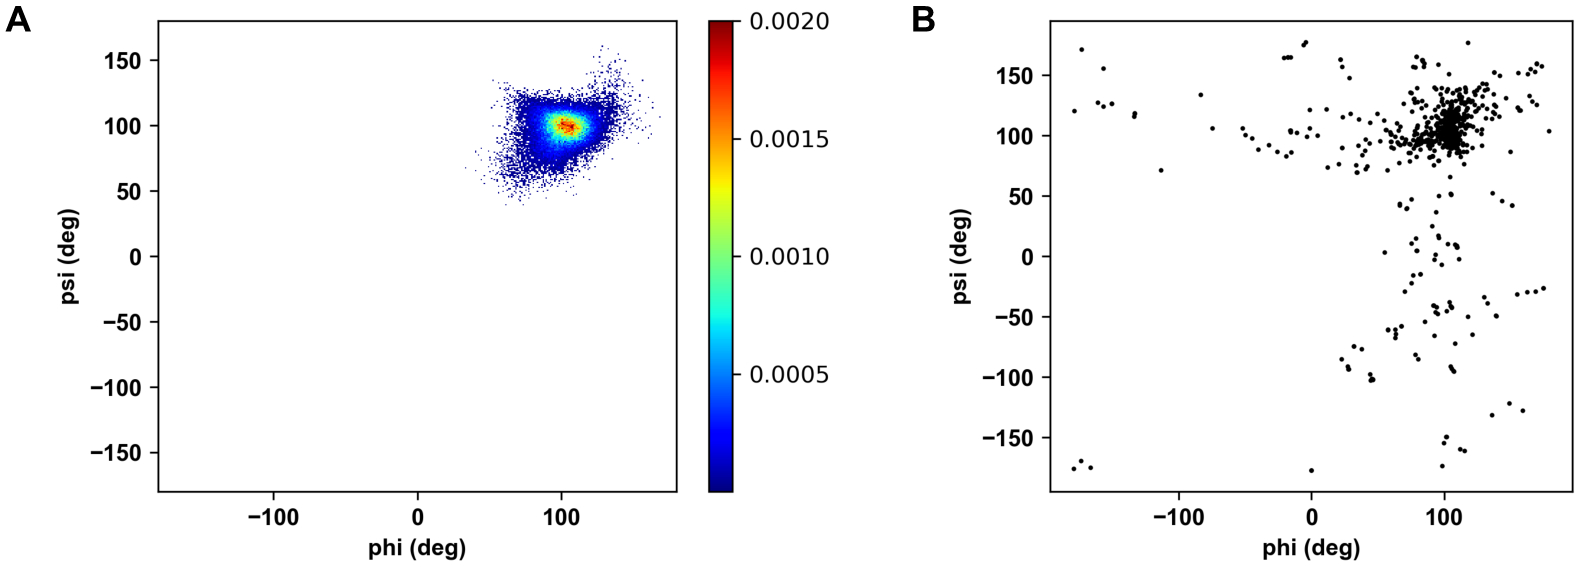
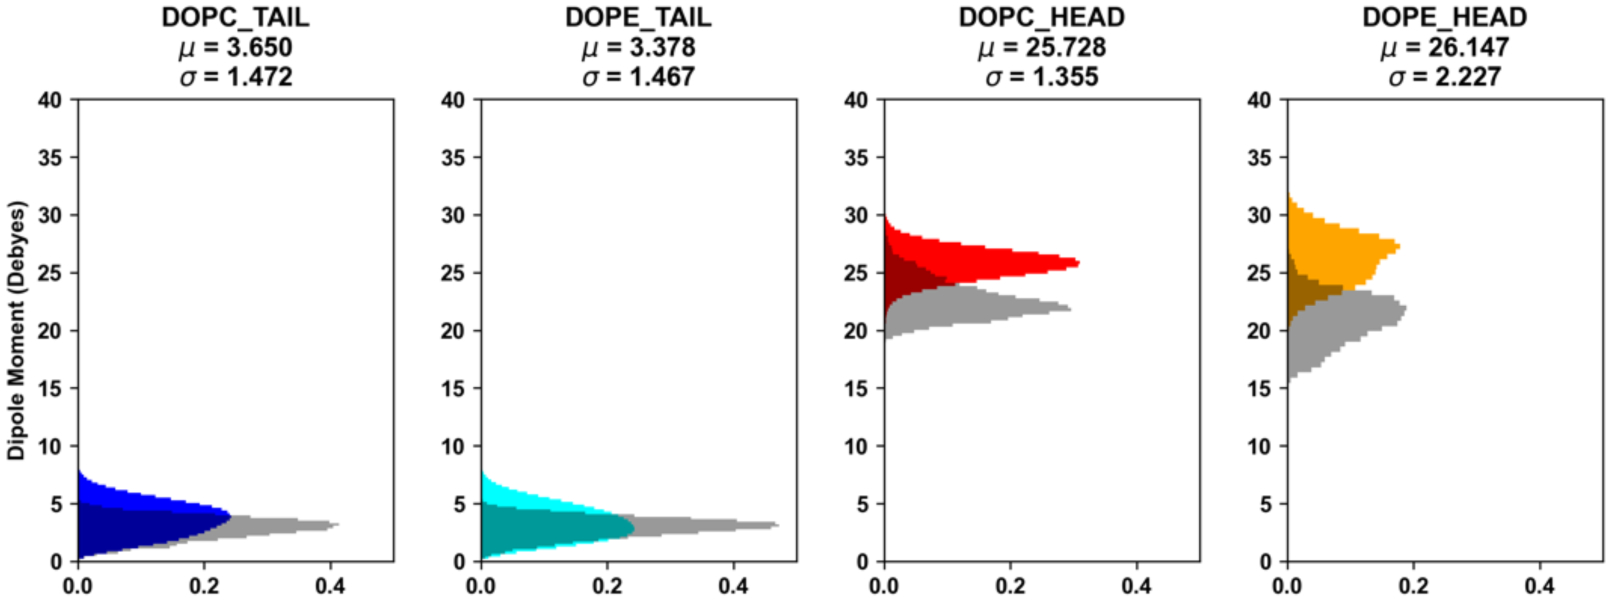
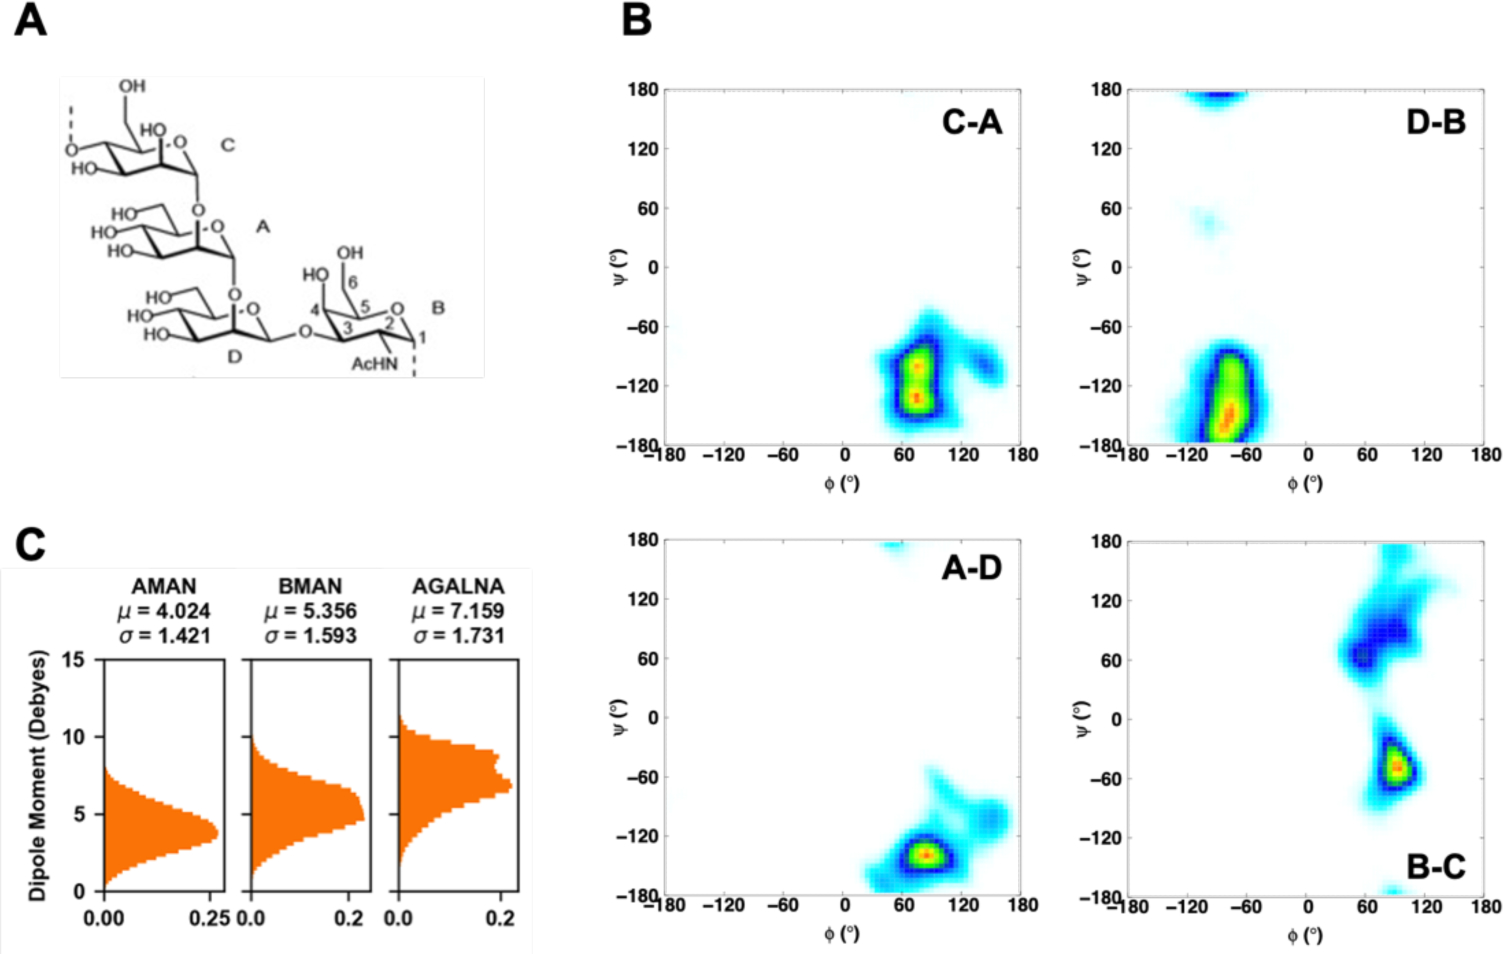
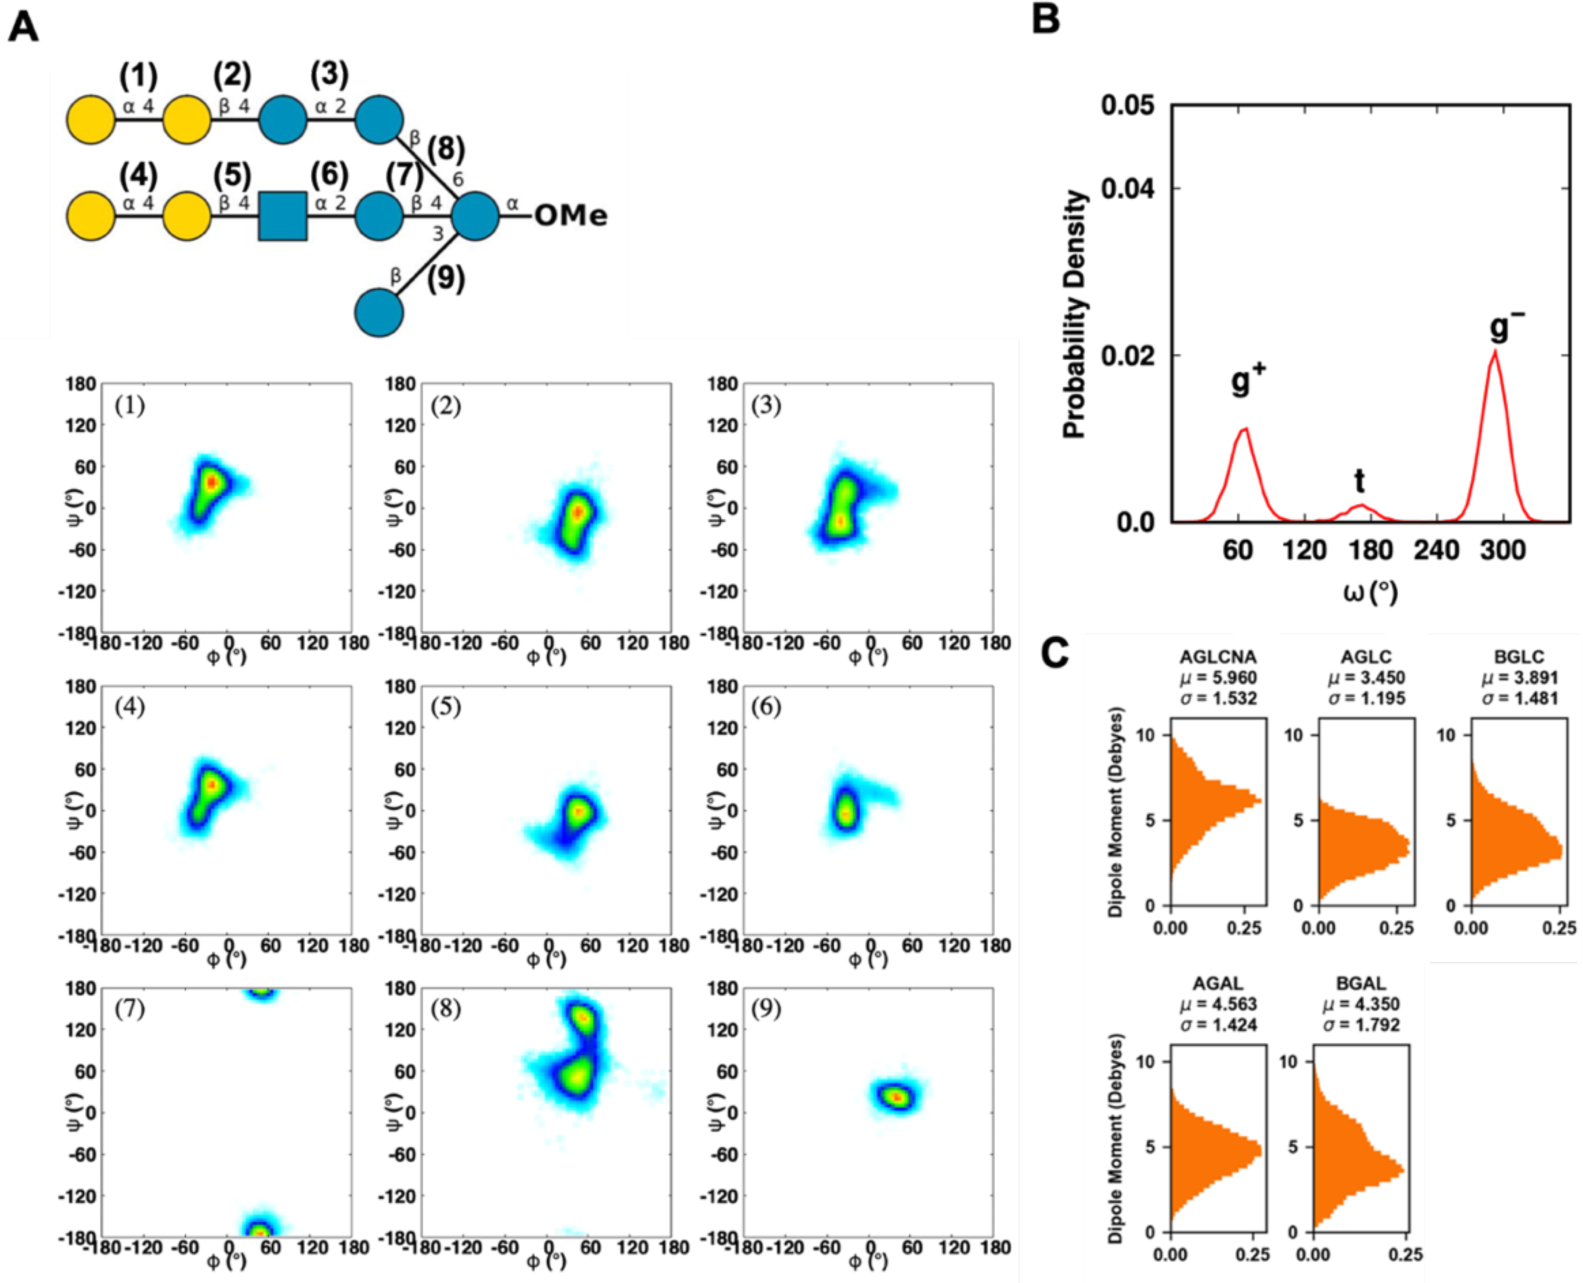
Explicit treatment of electronic polarizability in empirical force fields (FFs) represents an extension over a traditional additive or pairwise FF and provides a more realistic model of the variations in electronic structure in condensed phase, macromolecular simulations. To facilitate utilization of the polarizable FF based on the classical Drude oscillator model, Drude Prepper has been developed in CHARMM-GUI. Drude Prepper ingests additive CHARMM protein structures file (PSF) and pre-equilibrated coordinates in CHARMM, PDB, or NAMD format, from which the molecular components of the system are identified. These include all residues and patches connecting those residues along with water, ions, and other solute molecules. This information is then used to construct the Drude FF-based PSF using molecular generation capabilities in CHARMM, followed by minimization and equilibration. In addition, inputs are generated for molecular dynamics (MD) simulations using CHARMM, GROMACS, NAMD, and OpenMM. Validation of the Drude Prepper protocol and inputs is performed through conversion and MD simulations of various heterogeneous systems that include proteins, nucleic acids, lipids, polysaccharides, and atomic ions using the aforementioned simulation packages. Stable simulations are obtained in all studied systems, including 5 μs simulation of ubiquitin, verifying the integrity of the generated Drude PSFs. In addition, the ability of the Drude FF to model variations in electronic structure is shown through dipole moment analysis in selected systems. The capabilities and availability of Drude Prepper in CHARMM-GUI is anticipated to greatly facilitate the application of the Drude FF to a range of condensed phase, macromolecular systems.

Keywords: DNA; RNA; carbohydrate; dipole moment; membrane; protein; protein structure file.


Conflict of interest statement

Conflict of Interest: ADM Jr. is co-founder and CSO of SilcsBio LLC.

Figures

Figure 1.
Figure 1.
Molecular visualizations of the simulation systems in this study: (A) Ubiquitin, (B) TF-DNA, (C) HIV-1 TAR-TAT RBD, (D) Cas9-sgRNA-DNA. (E) LeuT in a bilayer, (F) MalT-maltose complex in a bilayer, (G) E. coli O176 O-antigen oligosaccharide, (H) M. catarrhalis serotype C oligosaccharide, and (I) HA lyase – HA substrate. Coloring scheme: green cartoon for protein, red cartoon for RNA, blue cartoon for DNA, cyan lines for lipids, and orange sticks for carbohydrates.
Figure 2.
Figure 2.
Symbol representation of carbohydrate sequences of (A) E. coli O176 O-antigen repeating unit (n = 10), (B) M. catarrhalis serotype C oligosaccharide, and (C) hyaluronan hexasaccharide in PDB ID 1LOH: blue circle for d-glucose (Glc), green circle for d-mannose (Man), yellow circle for d-galactose (Gal), blue square for N-acetyl-d-glucosamine (GlcNAc), yellow square for N-acetyl-d-galactosamine (GalNAc), and half-filled blue diamond for d-glucuronic acid (GlcA).
Figure 3.
Figure 3.
Backbone RMSD of ubiquitin from the 5 μs MD simulation performed using OpenMM.
Figure 4.
Figure 4.
RMSD of TF-protein and DNA heavy atoms after alignment of the DNA structure with respect to the initial structure.
Figure 5.
Figure 5.
(A) RMSD of HIV-1 TAR RNA and Tat RBD with respect to their initial structure. (B) Snapshot of HIV-1 TAR–TAT RBD complex at 200 ns, showing Arg52 sandwiched between two base-pairs. Protein is shown as green cartoon and RNA is shown as cyan cartoon. (C) Dipole moments of nucleobases of HIV-1 TAR RNA calculated as an average over the 200 ns sampled every 1 ns. The error bars represent one standard deviation.
Figure 6.
Figure 6.
(A) RMSD of different components of Cas9 complex following alignment of each component to its initial structure. (B) RGYR of Cas9 protein.
Figure 7.
Figure 7.
Conformations of Cas9-sgRNA-DNA complex at (A) 0 ns and (B) 200 ns. The protein is shown as green cartoon with the recognition lobe in forest green and the HNH domain in cyan. The polynucleotides are shown as surface with sgRNA in red, target DNA strand in marine blue, and non-target DNA strand in light blue. The arrows in (A) show the movement of the recognition lobe and HNH domain during the simulation that results in a conformation in (B).
Figure 8.
Figure 8.
Distributions of dipole moments of amino acid sidechains and nucleobases in the Cas9 complex. The colored histograms correspond to the Drude FF (Cas9 – green; sgRNA – red; DNA – blue) calculated based on 200 ns simulation, while the transparent gray histograms represent the additive FF calculated based on the 1 ns pre-equilibration trajectory. The histograms are normalized and the mean and standard deviation from Drude simulations is shown above each subplot. Comparison of Drude FF dipole moment distributions at 1 ns and 200 ns is presented in Figure S3.
Figure 9.
Figure 9.
Distributions of glycosidic torsion angles of maltose in (A) MalT-maltose complex simulation and from (B) all PDB maltose structures.
Figure 10.
Figure 10.
Distributions of dipole moments of membrane lipid head and tail groups over 200 ns simulations. The colored histograms correspond to the Drude FF (DOPC tail – blue; DOPE tail – cyan; DOPC head – red; DOPE head - orange), while the transparent gray histograms represent the additive FF calculated based on the 1 ns pre-equilibration trajectory. The histograms are normalized and the mean and standard deviation from Drude simulations is shown above each subplot.
Figure 11.
Figure 11.
(A) Schematic structure of the repeating units of the O-antigen polysaccharides from E. coli O176. (B) Glycosidic torsion angles ϕ and ψ distributions. ϕ = O5′−C1′−On−Cn, ψ = C1′−On−Cn−C (n−1), where n is the linkage position. The probability range is from white, 0, to blue, 0.1, to green, 0.3, to yellow, 0.7, and to red, 1. (C) Distributions of dipole moments of sugar monomers in the Drude FF.
Figure 12.
Figure 12.
(A) Two-dimensional distributions of ϕ/ψ glycosidic torsion angles of serotype C oligosaccharide of M. catarrhalis. The glycosidic torsion angle definitions are defined in Figure 11. The probability range is from white, 0, to blue, 0.1, to green, 0.3, to yellow, 0.7, and to red, 1. (B) The torsion angle ω is defined as O6-C6-C5-O5, where g+ denotes gauche-trans, g− denotes gauchegauche, and t denotes trans-gauche. (C) Distributions of dipole moments of sugar monomers.
Figure 13.
Figure 13.
(A) Backbone RMSD of hyaluronate lyase (purple) and hyaluronan substrate (green). (B) The number of hydrogen bonds between a hyaluronan substrate and its enzyme (C) A snapshot of complex structure at 30 ns (D) Hydrogen bonding frequencies between a hyaluronan substrate and its enzyme. The y-axis labels the interacting amino acid residues, and the x-axis labels the interacting atoms of the substrate. The color bar represents the frequency of hydrogen bonding observed in the simulation trajectory.

Similar articles

Cited by

References

    1. Renaud J-P; Chari A; Ciferri C; Liu W.-t.; Rémigy H-W; Stark H; Wiesmann C, Cryo-EM in drug discovery: achievements, limitations and prospects. Nature Reviews Drug Discovery 2018, 17 (7), 471–492. - PubMed
    1. Penfold J; Wagner NJ, Editorial overview: Recent applications of x-ray and neutron scattering techniques in colloid and interfacial science, characterised by increasing diversity and complexity. Current Opinion in Colloid & Interface Science 2019, 42.
    1. Loura LM; Prieto M, FRET in Membrane Biophysics: An Overview. Front Physiol 2011, 2, 82. - PMC - PubMed
    1. Sotomayor M; Schulten K, Single-molecule experiments in vitro and in silico. Science 2007, 316 (5828), 1144–8. - PubMed
    1. van der Kamp MW; Mulholland AJ, Combined quantum mechanics/molecular mechanics (QM/MM) methods in computational enzymology. Biochemistry 2013, 52 (16), 2708–28. - PubMed

Publication types

LinkOut - more resources