. 2022 Feb;113(2):609-621.
doi: 10.1111/cas.15225. Epub 2021 Dec 15.

Epidermal growth factor/epidermal growth factor receptor signaling blockage inhibits tumor cell-derived exosome uptake by oral squamous cell carcinoma through macropinocytosis

Affiliations

Epidermal growth factor/epidermal growth factor receptor signaling blockage inhibits tumor cell-derived exosome uptake by oral squamous cell carcinoma through macropinocytosis

Eri Sasabe et al. Cancer Sci. 2022 Feb.

Abstract

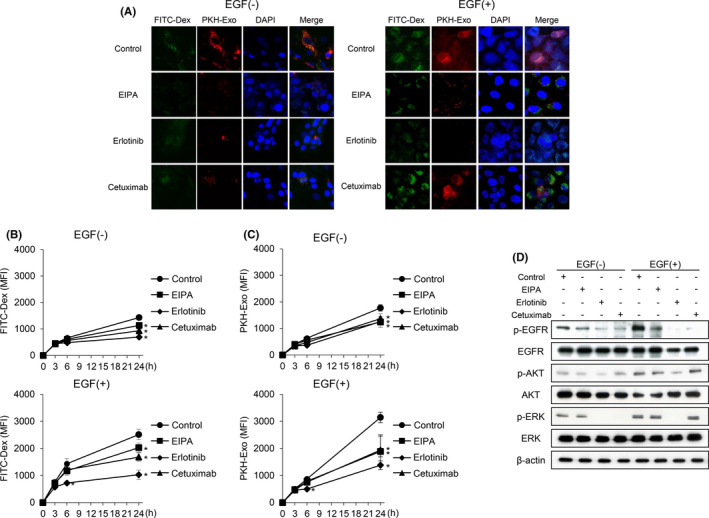
Various cell types secrete exosomes into their surrounding extracellular space, which consequently affect the function and activity of recipient cells. Numerous studies have showed that tumor cell-derived exosomes play important roles in tumor growth and progression. Although a variety of endocytic pathways are reportedly involved in the cellular uptake of exosomes, detailed mechanisms remain unknown. The present study demonstrated that treatment with recombinant epidermal growth factor (EGF) time- and dose-dependently promoted cellular uptake of oral squamous cell carcinoma (OSCC) cell-derived exosomes into OSCC cells themselves. Conversely, EGF receptor (EGFR) knockdown and treatment with EGFR inhibitors, including erlotinib and cetuximab, abrogated OSCC cell uptake of exosomes. The macropinocytosis inhibitor 5-(N-ethyl-N-isopropyl) amiloride (EIPA) blocked the effects of active EGF/EGFR signaling on uptake of OSCC cell-derived exosomes. These EGFR inhibitors also suppressed OSCC cell-derived exosome-induced proliferation, migration, invasion, stemness, and chemoresistance of OSCC cells. Taken together, the data presented herein suggest that EGFR inhibitors might inhibit the malignant potential of OSCC cells through direct inhibition of not only EGFR downstream signaling pathway but also cellular uptake of OSCC cell-derived exosomes through macropinocytosis.

Keywords: EGF; EGFR; exosome; macropinocytosis; oral squamous cell carcinoma.


Figures

FIGURE 1
FIGURE 1
Characterization and cellular internalization of HSC‐4‐derived exosomes. A, TCL and Exo lysates of HSC‐4 cells were analyzed by western blotting. B, HSC‐4 cells were incubated with or without PKH26‐labeled Exo (red) derived from HSC‐4 cells for 3 and 24 h and analyzed using confocal microscopy. Nuclei were stained with DAPI (blue) (400× magnification). C and D, Uptake of PKH67‐labeled HSC‐4‐derived exosomes was analyzed using flow cytometry at different Exo doses for 24 h (C) and at different time‐points in the presence of 100 µg/mL HSC‐4‐derived Exo (D). CD9, CD9 antigen; CD63, CD63 antigen; Exo, exosomes; MFI, mean fluorescence intensity; TCL, total cell lysate
FIGURE 2
FIGURE 2
Effects of HSC‐4‐derived exosomes on the malignant potential of HSC‐4 cells. HSC‐4 cells were incubated with or without HSC‐4‐derived Exo (1, 10, or 100 µg/mL) for 24 h. A, The viability was assessed using Cell Counting Kit‐8 assay. B, Wound healing assay to determine the migratory capacity of HSC‐4 cells treated with HSC‐4‐derived Exo. Magnification, 40×. C, Invasion assay to determine the invasive capacity of HSC‐4 cells treated with HSC‐4‐derived Exo. Magnification, 100×. D, Expression of CD44 of HSC‐4 cells was analyzed using flow cytometry. E, Sphere area and phase‐contrast photomicrographs of spheres formed from HSC‐4 cells growing in low‐adhesive 96‐well culture plates. F, TCL from HSC‐4 cells treated with HSC‐4‐derived Exo were analyzed using western blotting. * P < .05 vs cells in the absence of Exo. Exo, exosomes; MFI, mean fluorescence intensity
FIGURE 3
FIGURE 3
Effects of HSC‐4‐derived exosomes on the chemosensitivity of HSC‐4 cells. A, HSC‐4 cells were incubated with 100 µg/mL HSC‐4‐derived Exo for 24 h with or without 100 µmol/L of 5‐FU or 25 µmol/L of CDDP, after which cell proliferation was assessed using the Cell Counting Kit‐8 assay. B, The effect of HSC‐4‐derived Exo on colony formation in HSC‐4 cells. Colony numbers and representative images are shown. C, Apoptosis was evaluated using flow cytometry. D, The intracellular ROS levels were estimated by fluorometer after DCFH‐DA staining. E, TCL from HSC‐4 cells were analyzed using western blotting. F, HSC‐4 cells were incubated with 100 µg/mL HSC‐4‐derived Exo for 24 h with or without 100 µmol/L of 5‐FU, 25 µmol/L of CDDP, or 5 mM of NAC, after which cell proliferation was assessed using the Cell Counting Kit‐8 assay. G, Apoptosis was evaluated using from cytometry. * P < .05 vs cells in the absence of Exo. CDDP, cis‐diamminedichloroplatinum; Exo, exosomes; 5‐FU, 5‐fluorouracil; MFI, mean fluorescence intensity; NAC, N‐acetyl‐L‐cysteine; ROS, reactive oxygen species; SOD, superoxide dismutase; TRX, thioredoxin
FIGURE 4
FIGURE 4
Effects of epidermal growth factor (EGF)/epidermal growth factor receptor (EGFR) signaling on the cellular internalization of HSC‐4‐derived exosomes. A, HSC‐4 cells were transiently transfected with EGFR siRNA and cultured for 48 h. Next, cells were cultured with 25 μg/mL PKH26‐labeled Exo derived from HSC‐4 cells for the indicated times with or without 500 nmol/L of rhEGF and analyzed using flow cytometry. B, Total cell lysate (TCL) from control and EGFR‐siRNA transfected cells treated with 500 nmol/L of rhEGF for the indicated times were analyzed using western blotting. C, HSC‐4 cells were cultured with 25 μg/mL PKH67‐labeled Exo derived from HSC‐4 cells at different rhEGF concentrations for 24 h and analyzed using flow cytometry. D, TCL from control and EGFR‐siRNA transfected cells treated with different concentrations of rhEGF for 24 h were analyzed using western blotting. * P < .05 vs cells in the absence of rhEGF and P < .05 vs mock‐transfected cells
FIGURE 5
FIGURE 5
Effects of EIPA and EGFR inhibitors on the uptake of HSC‐4‐derived exosomes. A, HSC‐4 cells were treated with 0.5 mg/mL FITC‐dextran or 25 μg/mL PKH26‐labeled Exo derived from HSC‐4 cells with or without 500 nmol/L of rhEGF, 25 µmol/L of EIPA, 10 µmol/L of erlotinib, or 100 µg/mL of cetuximab for 24 h. After incubation, cellular uptake was analyzed using confocal microscopy. B and C, Internalization of FITC‐dextran (B) or PKH67‐labeled Exo (C) was analyzed using flow cytometry after treatment for 3, 6, and 24 h. * P < .05 vs cells in the absence of EIPA or EGFR inhibitors. D, TCL from control and rhEGF‐treated cells with or without EIPA or EGFR inhibitors for 24 h were analyzed using western blotting. Dex, dextran; EGFR, epidermal growth factor receptor; Exo, exosomes; MFI, mean fluorescence intensity
FIGURE 6
FIGURE 6
Effects of epidermal growth factor receptor (EGFR) inhibitors on HSC‐4‐derived exosome‐induced malignant potential of HSC‐4 cells. Control and 100 μg/mL of HSC‐4‐derived Exo‐treated HSC‐4 cells were incubated with or without 10 µmol/L of erlotinib or 100 µg/mL of cetuximab for 24 h. A, Viability was assessed using the Cell Counting Kit‐8 assay. B, A wound healing assay was performed to determine the migratory capacity of HSC‐4 cells. C, An invasion assay was performed to determine the invasive capacity of HSC‐4 cells. D, Expression of CD44 of HSC‐4 cells was analyzed using flow cytometry. E, Sphere area and phase‐contrast photomicrographs of spheres formed from HSC‐4 cells growing in low‐adhesive 96‐well culture plates. * P < .05 vs cells in the absence of EGFR inhibitors. Exo, exosomes
FIGURE 7
FIGURE 7
Effects of epidermal growth factor receptor (EGFR) inhibitors on HSC‐4‐derived exosome‐induced chemoresistance of HSC‐4 cells. A, Control and 100 μg/mL of HSC‐4‐derived Exo‐treated cells were incubated with 100 µmol/L of 5‐FU, 25 µmol/L of CDDP, 10 µmol/L of erlotinib, or 100 µg/mL of cetuximab for 24 h, after which cell proliferation was assessed using the Cell Counting Kit‐8 assay. B, The effect of EGFR inhibitors on colony formation in HSC‐4 cells. Colony numbers and representative images are shown. C, Apoptosis was evaluated using flow cytometry. * P < .05 vs cells in the absence of EGFR inhibitors. CDDP, cis‐diamminedichloroplatinum; Exo, exosomes; 5‐FU, 5‐fluorouracil

Similar articles

Cited by

References

    1. Bray F, Ferlay J, Soerjomataram I, Siegel RL, Torre LA, Jemal A. Global cancer statistics 2018: GLOBOCAN estimates of incidence and mortality worldwide for 36 cancers in 185 countries. CA Cancer J Clin. 2018;68:394‐424. - PubMed
    1. Okura M, Aikawa T, Sawai NY, Iida S, Kogo M. Decision analysis and treatment threshold in a management for the N0 neck of the oral cavity carcinoma. Oral Oncol. 2009;45:908‐911. - PubMed
    1. Mydlarz WK, Hennessey PT, Califano JA. Advances and perspectives in the molecular diagnosis of head and neck cancer. Expert Opin Med Diagn. 2010;4:53‐65. - PMC - PubMed
    1. da Silva SD, Ferlito A, Takes RP, et al. Advances and applications of oral cancer basic research. Oral Oncol. 2011;47:783‐791. - PubMed
    1. Mathivanan S, Ji H, Simpson RJ. Exosomes: extra‐cellular organelles important in intercellular communication. J Proteomics. 2010;73:1907‐1920. - PubMed

MeSH terms