. 2022 Feb 1;132(3):e151109.
doi: 10.1172/JCI151109.

Non-beta blocker enantiomers of propranolol and atenolol inhibit vasculogenesis in infantile hemangioma

Affiliations

Non-beta blocker enantiomers of propranolol and atenolol inhibit vasculogenesis in infantile hemangioma

Caroline T Seebauer et al. J Clin Invest. .

Abstract

Propranolol and atenolol, current therapies for problematic infantile hemangioma (IH), are composed of R(+) and S(-) enantiomers: the R(+) enantiomer is largely devoid of beta blocker activity. We investigated the effect of R(+) enantiomers of propranolol and atenolol on the formation of IH-like blood vessels from hemangioma stem cells (HemSCs) in a murine xenograft model. Both R(+) enantiomers inhibited HemSC vessel formation in vivo. In vitro, similar to R(+) propranolol, both atenolol and its R(+) enantiomer inhibited HemSC to endothelial cell differentiation. As our previous work implicated the transcription factor sex-determining region Y (SRY) box transcription factor 18 (SOX18) in propranolol-mediated inhibition of HemSC to endothelial differentiation, we tested in parallel a known SOX18 small-molecule inhibitor (Sm4) and show that this compound inhibited HemSC vessel formation in vivo with efficacy similar to that seen with the R(+) enantiomers. We next examined how R(+) propranolol alters SOX18 transcriptional activity. Using a suite of biochemical, biophysical, and quantitative molecular imaging assays, we show that R(+) propranolol directly interfered with SOX18 target gene trans-activation, disrupted SOX18-chromatin binding dynamics, and reduced SOX18 dimer formation. We propose that the R(+) enantiomers of widely used beta blockers could be repurposed to increase the efficiency of current IH treatment and lower adverse associated side effects.

Keywords: Angiogenesis; Drug therapy; Endothelial cells; Transcription; Vascular Biology.


Figures

Figure 1
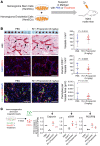
Figure 1. R(+) propranolol inhibits vessel formation in a murine model for IH.
(A) HemSCs were pretreated with PBS or 10 μM R(+) propranolol for 24 hours, suspended in Matrigel with PBS or 5 μM R(+) propranolol, and then injected into nude mice, with 2 implants/mouse (n = 8 mice). The mice were treated with 5 mg/kg R(+) propranolol or an equivalent volume of PBS twice a day as depicted in the schematic. Matrigel implants harvested after 7 days are shown in the top panel of the images. Scale bars: 10 mm. H&E staining indicated fewer blood vessels in the implants of R(+) propranolol–treated mice compared with implants in the control mice (middle panels). Scale bars: 100 μm. Anti–human CD31 staining (red) confirmed the reduced vessel density in R(+) propranolol–treated mice compared with vessel density in control mice (bottom panels). Nuclei were counterstained with DAPI (blue). Scale bars: 100 μm. Graphs show quantification of vessels/mm2 in the H&E-stained sections (left) and human CD31+ vessels/mm2 (right). (B) HemSCs were treated as described in A. Mice were treated with 12.5 mg/kg R(+) propranolol or the equivalent volume of PBS twice a day. Matrigel implants harvested after 7 days are displayed in the top panel of the images, with 2 implants/mouse (n = 8 mice). Scale bars: 10 mm. H&E staining (middle panels) and anti–human CD31 staining (red; bottom panels) showed a significant reduction in vessel density in the implants of R(+) propranolol–treated mice compared with control mice. Scale bars: 100 μm. P values were calculated using a 2-tailed, unpaired Student’s t test. Data show the mean ± SD. Data were collected for 2 implants in each of 4 mice, leading to an observation sample size of 8 per group.
Figure 2
Figure 2. R(+) propranolol does not affect HemSC to HemPericyte differentiation.
(A) HemSCs and HemECs (1:1) were suspended in Matrigel and injected into nude mice, with 2 implants/mouse (n = 8 mice). The mice were treated with 5 mg/kg R(+) propranolol or an equivalent volume of PBS twice a day. Matrigel implants harvested after 7 days are displayed in the top panel of the images. Scale bars: 10 mm. H&E staining showed similar vessel density in the implants of R(+) propranolol–treated mice compared with vessel density in the implants of control mice (middle panels). Scale bars: 100 μm. Anti–human CD31 staining (red) confirmed the similar number of blood vessels in R(+) propranolol–treated mice and control mice (bottom panels). Nuclei were counterstained with DAPI (blue). Scale bars: 100 μm. P values were calculated using a 2-tailed, unpaired Student’s t test. Data were collected for 2 implants in each of 4 mice, leading to an observation sample size of 8 per group. (B) Implant sections stained with UEA I (green) and anti-αSMA (red) showed similar pericyte coverage per vessel area in mice treated with PBS (n = 7 mice) or R(+) propranolol (n = 6 mice). Nuclei were counterstained with DAPI (blue). Scale bars: 100 μm. P values were calculated by 2-tailed, unpaired Student’s t test. Only implants showing vessel formation were used for further analysis [n = 7 PBS implants; n = 6 R(+) propranolol implants]. Graphs show quantification of vessels/mm2 in the H&E-stained sections (top), human CD31+ vessels/mm2 (middle), and pericytes/vessel area (bottom). (C) qPCR showed that treatment with propranolol or its R(+) enantiomers (10 μM) did not affect the expression of pericyte markers (calponin, PDGFRβ, and αSMA) in HemSCs cocultured with HemECs. Coculturing was conducted for 5 days: CD31+ cells were removed by magnetic beads before RNA extraction of the CD31 cells as shown in the schematic. DAPT (10 μM) served as a positive control. Data from 3 independent experiments were plotted. Statistical significance was determined by 1-way ANOVA with Dunnett’s multiple-comparison test. P values can be found in Supplemental Figure 2C. Data in all graphs show the mean ± SD.
Figure 3
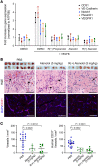
Figure 3. R(+) atenolol inhibits hemangioma endothelial differentiation in vitro and vessel formation in vivo.
(A) Atenolol and its purified R(+) enantiomer, both tested at 5 μM, inhibited endothelial differentiation of HemSCs isolated from 2 IH tumor specimens as effectively as did R(+) propranolol. R(+) propranolol served as a positive control for inhibition. The endothelial differentiation markers CD31 and VE-cadherin and the hemangioma endothelial markers NOTCH1, PlexinD1, and VEGFR1 under each treatment condition in 3 biological replicates, determined by qPCR, were standardized as previously described (76). The HemSC-to-endothelial differentiation assay was conducted 2 separate times with HemSC 167 and once with HemSC 165, providing 3 data points. Statistical significance was determined by 1-way ANOVA with Bonferroni’s post hoc test. P values are listed in Supplemental Figure 3. (B) HemSCs were pretreated with PBS, 10 μM atenolol, or 10 μM R(+) atenolol 24 hours before the experiment and were then suspended in Matrigel with PBS, 5 μM atenolol, or 5 μM R(+) atenolol and injected into nude mice, with 2 implants per mouse (see schematic in Figure 1A; n = 16 PBS-treated HemSCs, n = 8 atenolol-treated HemSCs, n = 8 R(+) atenolol–treated HemSCs). The mice were treated with 5 mg/kg atenolol, 5 mg/kg R(+) atenolol, or an equal volume of PBS twice a day. Matrigel implants harvested after 7 days are shown in the top panels of the images. Scale bars: 10 mm. Images also show H&E staining (middle panels) and anti–human CD31 staining (red, bottom panels), with nuclei counterstained with DAPI (blue). Scale bars: 100 μm. Data were collected for 2 implants in each of 4 mice, leading to an observation sample size of 8 per treatment group and 16 in the control group. (C) Quantification of vessel density based on H&E staining (middle panels) and anti–human CD31 staining (bottom panels) showed a significant reduction in vessel density in the implants of atenolol- and R(+) atenolol–treated mice versus implants of control mice. Statistical analysis was performed using 1-way ANOVA with Dunnett’s multiple-comparison test.
Figure 4
Figure 4. The orally active SOX18 inhibitor Sm4 suppresses vessel formation in a murine model for IH.
HemSCs were pretreated with 10% DMSO in PBS or 10 μM Sm4 for 24 hours, suspended in Matrigel with 10% DMSO in PBS or 5 μM Sm4 and injected into nude mice, with 2 implants per mouse (n = 12). The mice were treated with 25 mg/kg Sm4 or an equivalent volume of 10% DMSO in PBS once a day by oral gavage. Matrigel implants harvested after 7 days are shown in the top panels. Scale bars: 10 mm. H&E staining (middle panels) and anti–human CD31 staining (red; lower panels) showed a significant reduction in vessel density in the implants from Sm4-treated mice compared with those from control mice. Nuclei were counterstained with DAPI (blue). Scale bars: 100 μm. Graphs show quantification of vessels/mm2 in the H&E-stained sections (top) and human CD31+ vessels/mm2 (bottom). P values were calculated by 2-tailed, unpaired Students’ t test. Data show the mean ± SD. Data were collected for 2 implants in each of 6 mice, leading to an observation sample size of 12 per group.
Figure 5
Figure 5. R(+) enantiomers disrupt SOX18 activity.
(A) SOX18 activated the transcription of VCAM1 in COS-7 cells (luciferase reporter assay); R(+) propranolol (20 μM) inhibited SOX18-driven transcription. The means and SDs are as follows: VCAM1/SOX18, 3148 ± 688; VCAM1, 212 ± 24.8; VCAM1/SOX18 plus R(+) propranolol, 1934 ± 341. Statistical significance was determined by 1-way ANOVA with Tukey’s multiple-comparison test. (B) Expression of VCAM1 was increased by VEGF-B–induced endothelial differentiation of HemSCs from 2 IH tumor specimens. The SOX18 inhibitor Sm4, propranolol, and R(+) propranolol (each tested at 5 μM) reduced VCAM1 mRNA levels to those of undifferentiated HemSCs. mRNA transcript levels were determined by qPCR and standardized as described previously (76). Statistical significance was determined by 1-way ANOVA with Bonferroni’s post hoc test. P values are listed in the table in Supplemental Figure 5E. (C) Halo-tagged SOX18 chromatin binding dynamics and diffusion coefficients were measured by SMT in live HeLa cells in the absence or presence of R(+) propranolol. Trajectory density, diffusion coefficient frequency, and individual images show single-molecule tracks that are pseudocolored across the nucleus. Scale bars: 4 μm. **P < 0.005, by Welch’s t test on the basis of 4 technical replicates with 6 cells per replicate per condition (n ≥20 cells). (D) qPCR analysis of NOTCH1 in HemSCs isolated from 6 different IH specimens, differentiated for 8 days with VEGF-B and then treated for 2 hours with or without 20 μM R(+) propranolol. Three technical replicates were performed on the 6 biological replicates. ****P < 0.0001, by paired Student’s t test. (E and F) In the AlphaLISAScreen assay, racemic propranolol, racemic atenolol, and the respective R(+) enantiomers were tested at 20 μM for effects on SOX18:RBPJ (E) and SOX18:SOX18 (F) PPI. Statistical significance was determined by 1-way ANOVA followed by Dunnett’s post hoc test. P values can be found in the table in Supplemental Figure 5F. Data show the mean ± SEM. (G) A FFPE tissue section (5 μm) from a patient with IH (female, 5.5 months old, proliferating phase of IH, no propranolol treatment) was stained with anti-SOX18 (1:50, green), anti-RBPJ (1:50, red), and UEA I (1:50, white; to stain human ECs). DAPI (blue) was used to visualize nuclei. Yellow arrows point to double-positive cells (SOX18+RBPJ+). Scale bars: 50 μm.
Figure 6
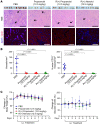
Figure 6. R(+) propranolol and R(+) atenolol inhibit IH vasculogenesis but not body weight or glucose levels.
(A) HemSCs were pretreated with PBS or 10 μM treatment drug 24 hours before the experiment, suspended in Matrigel with PBS or 5 μM treatment drug, and injected into nude mice, with 2 implants/mouse [n = 10 PBS-treated mice, n = 8 propranolol-treated mice, n = 8 R(+) propranolol–treated mice, n = 10 R(+) atenolol–treated mice]. The mice were treated with 12.5 mg/kg propranolol, 12.5 mg/kg R(+) propranolol, 12.5 mg/kg R(+) atenolol, or an equal volume of PBS twice a day. Matrigel implants harvested after 7 days are displayed in the top panels of th images. The PBS control implants in A are also shown in Figure 3A, because the 5 mg/kg atenolol group shown in Figure 3B was run at the same time as the groups in A. Scale bars: 10 mm. Images show H&E staining (middle panels) and anti–human CD31 staining (red; bottom panels), with nuclei counterstained with DAPI (blue). Scale bars: 100 μm. (B) Quantification of vessel density based on H&E staining (A, middle panels) and anti–human CD31 staining (A, bottom panels) showed that R(+) atenolol was as effective as R(+) propranolol and propranolol in inhibiting vessel formation. Statistical significance was determined by 1-way ANOVA with Dunnett’s multiple-comparison test. P values are listed in the table in Supplemental Figure 5E. (C) Body weight and glucose levels were measured daily. Neither propranolol, R(+) propranolol, or R(+) atenolol affected body weight or glucose levels of nude mice. Data show the mean ± SD in all graphs. Data were collected for 2 implants in each mouse, leading to an observation sample size of 8 in the propranolol and R(+) propranolol treatment groups and 10 in the atenolol and PBS control groups.

Comment in

Similar articles

Cited by

References

    1. Léauté-Labrèze C, et al. Infantile haemangioma. Lancet. 2017;390(10089):85–94. doi: 10.1016/S0140-6736(16)00645-0. - DOI - PubMed
    1. Goelz R, Poets CF. Incidence and treatment of infantile haemangioma in preterm infants. Arch Dis Child Fetal Neonatal Ed. 2015;100(1):F85–F91. doi: 10.1136/archdischild-2014-306197. - DOI - PubMed
    1. Munden A et al. Prospective study of infantile haemangiomas: incidence, clinical characteristics and association with placental anomalies. Br J Dermatol. 2014;170(4):907–913. doi: 10.1111/bjd.12804. - DOI - PMC - PubMed
    1. Darrow DH et al. Diagnosis and management of infantile hemangioma. Pediatrics. 2015;136(4):e1060-104. doi: 10.1542/peds.2015-2485. - DOI - PubMed
    1. Adams DM, Ricci KW. Infantile hemangiomas in the head and neck region. Otolaryngol Clin North Am. 2018;51(1):77–87. doi: 10.1016/j.otc.2017.09.009. - DOI - PubMed

Publication types