. 2022 Jan 11;7(1):e152012.
doi: 10.1172/jci.insight.152012.

Astrocytic 4R tau expression drives astrocyte reactivity and dysfunction

Affiliations

Astrocytic 4R tau expression drives astrocyte reactivity and dysfunction

Lubov A Ezerskiy et al. JCI Insight. .

Abstract

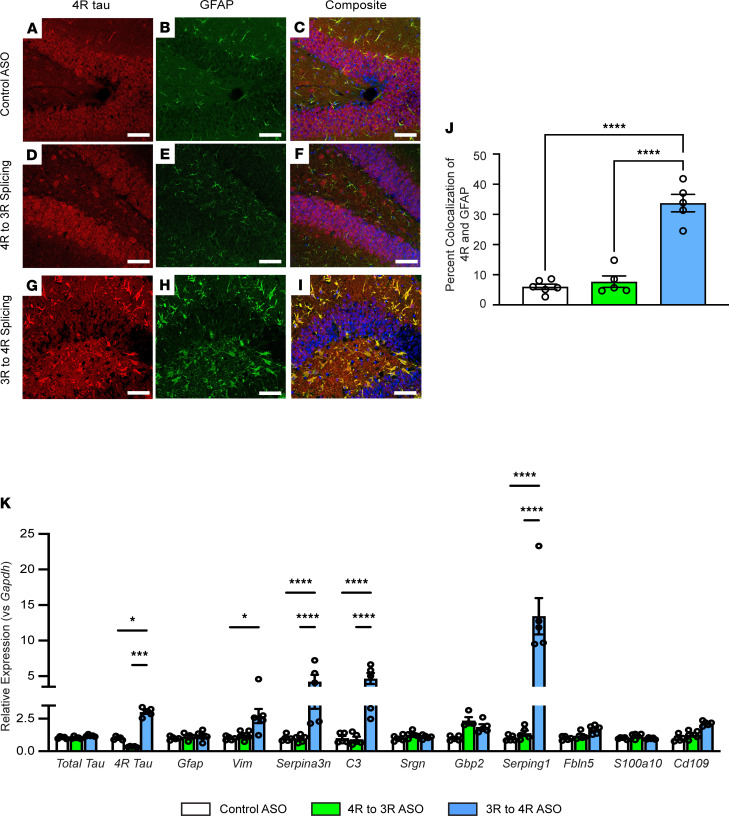
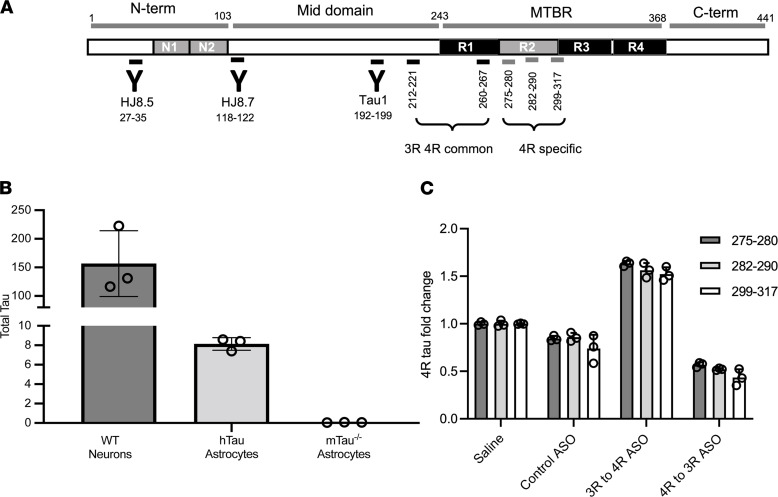
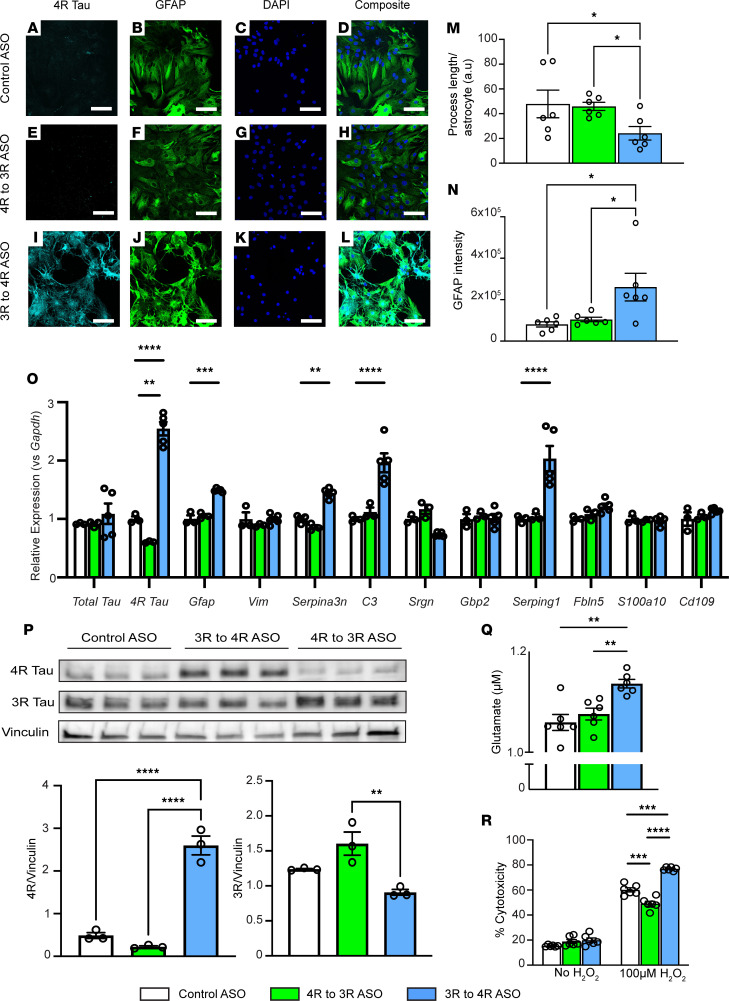
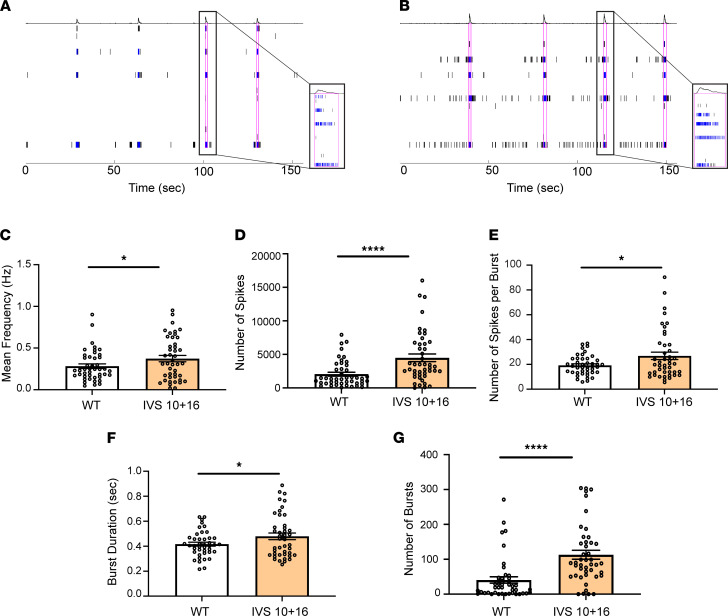
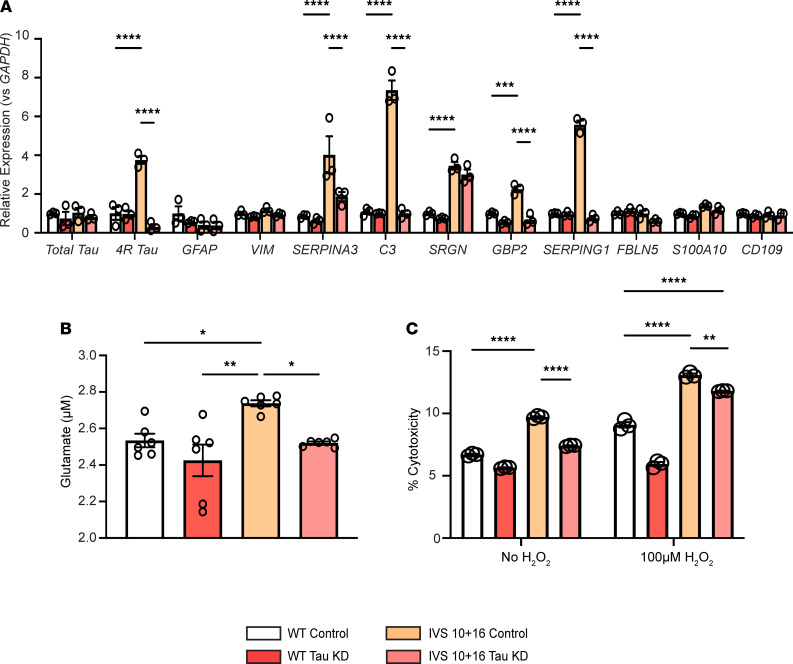
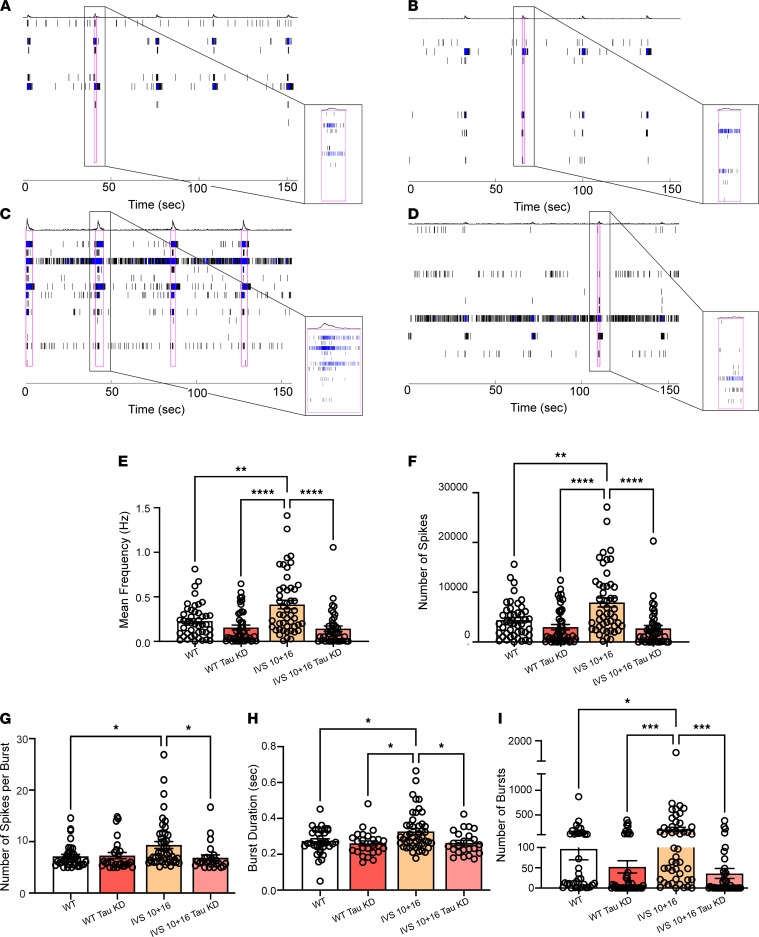
The protein tau and its isoforms are associated with several neurodegenerative diseases, many of which are characterized by greater deposition of the 4-repeat (4R) tau isoform; however, the role of 4R tau in disease pathogenesis remains unclear. We created antisense oligonucleotides (ASOs) that alter the ratio of 3R to 4R tau to investigate the role of specific tau isoforms in disease. Preferential expression of 4R tau in human tau-expressing (hTau-expressing) mice was previously shown to increase seizure severity and phosphorylated tau deposition without neuronal or synaptic loss. In this study, we observed strong colocalization of 4R tau within reactive astrocytes and increased expression of pan-reactive and neurotoxic genes following 3R to 4R tau splicing ASO treatment in hTau mice. Increasing 4R tau levels in primary astrocytes provoked a similar response, including a neurotoxic genetic profile and diminished homeostatic function, which was replicated in human induced pluripotent stem cell-derived (iPSC-derived) astrocytes harboring a mutation that exhibits greater 4R tau. Healthy neurons cultured with 4R tau-expressing human iPSC-derived astrocytes exhibited a higher firing frequency and hypersynchrony, which could be prevented by lowering tau expression. These findings support a potentially novel pathway by which astrocytic 4R tau mediates reactivity and dysfunction and suggest that astrocyte-targeted therapeutics against 4R tau may mitigate neurodegenerative disease progression.

Keywords: Neurodegeneration; Neurological disorders; Neuroscience; iPS cells.


Conflict of interest statement

Conflict of interest: Antisense oligonucleotides (ASOs) used here were provided by Ionis Pharmaceuticals. TMM is a consultant for Ionis Pharmaceuticals and has a licensing agreement with Ionis regarding use of tau ASOs in neurodegenerative syndrome. TMM is an inventor on patent/patent application PCT/US2013/031500, nationalized to US Issued Patent 10,273,474 (with corresponding national stage applications or issued patents in Australia, Canada, Europe, and Japan), and on continuation or divisional patent applications (US patent application number 16/298,607 and Australia Issued Patent 2016202220) regarding use of tau ASOs in neurodegenerative syndrome. TMM has a licensing agreement with C2N Diagnostics, is a consultant for Cytokinetics and Disarm Therapeutics, and has served on advisory boards for Biogen and UCB. FR is a paid employee of Ionis Pharmaceuticals. RJB has received honoraria from AC Immune, Janssen, Pfizer, and Roche as a speaker; from AC Immune, Amgen, Eisai, and Janssen as a consultant; and from Roche as an advisory board member. RJB has equity ownership interest in C2N Diagnostics and receives royalty income based on technology licensed by Washington University to C2N Diagnostics. RJB receives income from C2N Diagnostics for serving on the scientific advisory board. KH is an Eisai-sponsored visiting researcher at Washington University and has received a salary from Eisai.

Figures

Figure 1
Figure 1. 4R tau expression in astrocytes leads to a reactive phenotype in vivo.
(A, D, and G) 4R tau, (B, E, and H) glial fibrillary acidic protein (GFAP), and (C, F, and I) merged representative images of the dentate gyrus of the hippocampus, contralateral to ASO injection, in hTau mice treated with control ASO, 4R to 3R tau splicing ASO, or 3R to 4R tau splicing ASO. Scale bar: 50 μm. (J) Percentage of the total visual field that had 4R tau colocalized with GFAP. Data are shown as mean ± SEM; 2-way ANOVA with Tukey’s multiple comparisons; n = 5–6 mice per treatment, ****P < 0.0001. (K) Expression of select pan-reactive (Gfap, Vimentin, and Serpina3n), neurotoxic (C3, Srgn, Gbp2, Serping1, and Fbln5), and neuroprotective (S100a10 and Cd109) genes in hTau mouse brain lysates after control, 4R to 3R tau splicing, or 3R to 4R tau splicing ASO treatment measured by qRT-PCR. Data are normalized to Gapdh relative to control ASO levels and shown as mean ± SEM; 2-way ANOVA with Tukey’s multiple comparisons; n = 5–6 mice per treatment, *P < 0.05, ***P < 0.001, ****P < 0.0001.
Figure 2
Figure 2. Tau and isoform expressions at protein level measured by mass spectrometry.
(A) Schematics of tau protein, antibody epitopes, and peptides used for mass spectrometry analyses. MTBR, microtubule binding region. (B) hTau astrocytes have approximately 100-fold less tau expression as compared with WT neurons measured by 212-221 mid domain peptide (“Total tau”) that is common to all isoforms, n = 3 biological replicates/group. (C) Three 4R isoform-specific peptides — (a) 282-290, (b) 275-280, (c) 299-317 — that are in R2 region and 1 common peptide (260-267) that is in proximity were measured by quantitative mass spectrometry in ASO-treated hTau astrocytes. The ratio of each 4R-specific peptide to common peptide was calculated in astrocytes (282-290/260-267, 275-280/260-267, 299-317/260-267) and compared with the ratio of saline. 3R to 4R ASO increased 4R-specific peptides 1.53 ± 0.03 fold and 4R to 3R ASO decreased 4R-specific peptides 0.51 ± 0.04 fold compared with saline, n = 3 biological replicates/group.
Figure 3
Figure 3. Increased 4R tau in primary hTau astrocytes induces a neurotoxic genetic signature and leads to dysfunction.
(A, E, and I) 4R tau, (B, F, and J) GFAP, (C, G, and K) DAPI, and (D, H, and L) merged images from cultured hTau astrocytes treated with ASOs. Scale bar: 200 μm. (M) Average process length per astrocyte in hTau astrocytes treated with ASOs. Data are mean ± SEM, *P < 0.05 by 1-way ANOVA with multiple corrections, n = 6 biological replicates/treatment, 3 images per treatment. (N) GFAP intensity in hTau astrocytes treated with ASOs. Data are mean ± SEM, *P < 0.05 by 1-way ANOVA with multiple corrections, n = 6 biological replicates/treatment, 3 images per treatment. (O) Expression of select genes in cultured primary hTau astrocytes after ASO treatment measured by qRT-PCR. Data are normalized to Gapdh relative to control ASO levels and shown as mean ± SEM; 2-way ANOVA with Tukey’s multiple comparisons; n = 3–5 biological replicates/treatment, **P < 0.01, ***P < 0.001, ****P < 0.0001. (P) Western blots for 4R tau, 3R tau, and vinculin in hTau astrocytes treated with control ASO, 4R to 3R tau splicing, or 3R to 4R tau splicing ASO. Data are mean ± SEM; n = 3 biological replicates/treatment; 1-way ANOVA with Tukey’s multiple comparisons; **P < 0.01, ****P < 0.0001. (Q) Glutamate measured in cellular media after control, 3R to 4R tau splicing, or 4R to 3R tau splicing ASO treatment in hTau astrocytes. Data are mean ± SEM; n = 6 biological replicates/treatment; 1-way ANOVA with Tukey’s multiple comparisons; **P < 0.01. (R) Cytotoxicity (measured by LDH release) in control, 3R to 4R tau splicing, or 4R to 3R splicing ASO treated hTau astrocytes at baseline or following 100 μM H2O2 treatment. Data are mean ± SEM; n = 6 biological replicates/treatment; 2-way ANOVA with Tukey’s multiple comparisons; ***P < 0.001, ****P < 0.0001.
Figure 4
Figure 4. iAstrocytes exhibit a neurotoxic phenotype and disruption to homeostatic function.
(A) Relative levels of 3R and 4R mRNA tau in iAstrocytes. Data are mean ± SEM; n = 3 biological replicates/treatment. (B) Expression of select pan-reactive (GFAP, Vimentin, and SERPINA3), neurotoxic (C3, SRGN, GBP2, SERPING1, and FBLN5), and neuroprotective (S100a10 and CD109) genes in WT and IVS 10+16 MAPT mutation iAstrocytes measured by qRT-PCR. Data are normalized to GAPDH relative to isogenic levels and shown as mean ± SEM; 1-way ANOVA with Tukey’s multiple comparisons; n = 3 wells; **P < 0.01, ***P < 0.001. (C) Glutamate concentration measured in cellular media in iAstrocytes. Data are mean ± SEM; n = 3 biological replicates/group; unpaired, 2-tailed t test; ***P < 0.001. (D) Cytotoxicity (measured by LDH release) in iAstrocyte cultures at baseline and following 100 μM H2O2 treatment. Data are mean ± SEM; n = 3 biological replicates/group; 2-way ANOVA with Tukey’s multiple comparisons; *P < 0.05, **P < 0.01, ****P < 0.0001.
Figure 5
Figure 5. Homeostatic control of neuronal excitability is reduced in 4R tau–expressing iAstrocytes.
Representative raster plots of burst rates from neurons cocultured with (A) WT or (B) IVS 10+16 MAPT mutation iAstrocytes. The blue tick marks represent spikes that were part of a single electrode firing, while black tick marks represent multi-electrode firings. The magenta outlines indicate network bursts. (C) Mean frequency, (D) number of spikes, (E) number of spikes per burst, (F) burst duration, and (G) number of bursts were measured from neurons cocultured with WT or IVS 10+16 iAstrocytes. Data are mean ± SEM; n = 45 wells/group and 3 recordings; *P < 0.05, ****P < 0.0001 by unpaired, 2-tailed t test.
Figure 6
Figure 6. Lowering levels of total tau in iAstrocytes rescues neurotoxic phenotype and function.
(A) Expression of select pan-reactive (GFAP, Vimentin, and SERPINA3), neurotoxic (C3, SRGN, GBP2, SERPING1, and FBLN5), and neuroprotective (S100a10 and CD109) genes in WT or IVS 10+16 MAPT mutation iAstrocytes treated with control ASO or tau-knockdown (tau-KD) ASO measured by qRT-PCR. Data are normalized to GAPDH relative to WT levels and shown as mean ± SEM; n = 3 biological replicates/treatment; 2-way ANOVA with Tukey’s multiple comparisons; ***P < 0.001, ****P < 0.0001. (B) Glutamate concentration measured in cellular media in iAstrocytes treated with control ASO or tau-KD ASO. Data are mean ± SEM; n = 6 biological replicates/treatment; 1-way ANOVA; *P < 0.05, **P < 0.01. (C) Cytotoxicity (measured by LDH release) in iAstrocyte cultures treated with a control ASO or tau-KD ASO at baseline and following 100 μM H2O2 treatment. Data are mean ± SEM; n = 3 biological replicates/treatment; 2-way ANOVA with Tukey’s multiple comparisons; **P < 0.01, ***P < 0.001.
Figure 7
Figure 7. Homeostatic control of neuronal excitability is rescued following lowering of tau levels in 4R tau–expressing iAstrocytes.
Representative raster plots of burst rates from neurons cocultured with (A) WT, (B) WT tau-KD ASO-treated, (C) IVS 10+16 MAPT, and (D) IVS 10+16 MAPT tau-KD ASO-treated iAstrocytes. The blue tick marks represent spikes that were part of a single electrode firing, while black tick marks represent multi-electrode firings. The magenta outlines indicate network bursts. (E) Mean frequency, (F) number of spikes, (G) number of spikes per burst, (H) burst duration, and (I) number of bursts were measured from neurons cocultured with WT, WT tau-KD ASO-treated, IVS 10+16 MAPT, or IVS 10+16 MAPT tau-KD ASO-treated iAstrocytes. Data are mean ± SEM; n = 30–45 wells/group and 3 recordings; *P < 0.05, **P < 0.01, ***P < 0.001, ****P < 0.0001, by 1-way ANOVA with multiple corrections.
Figure 8
Figure 8. Increased 4R tau expression in iAstrocytes leads to neuronal death.
(AH) Representative images of microtubule associated protein 2 staining in iPSC cortical neurons cocultured with WT or IVS 10+16 iAstrocytes treated with either control or tau-KD ASO at baseline and after hydrogen peroxide treatment. Scale bar: 200 μm. (I) Quantification of the number of neurons in cocultures. Data are shown as mean ± SEM; n = 8 biological replicates per treatment and 10 images per replicate: *P < 0.05, ****P < 0.0001 by 2-way ANOVA with multiple corrections.

Similar articles

Cited by

References

    1. Wang Y, Mandelkow E. Tau in physiology and pathology. Nat Rev Neurosci. 2016;17(1):5–21. doi: 10.1038/nrg.2015.11. - DOI - PubMed
    1. Guo T, et al. Roles of tau protein in health and disease. Acta Neuropathol. 2017;133(5):665–704. doi: 10.1007/s00401-017-1707-9. - DOI - PMC - PubMed
    1. Allen M, et al. Divergent brain gene expression patterns associate with distinct cell-specific tau neuropathology traits in progressive supranuclear palsy. Acta Neuropathol. 2018;136(5):709–727. doi: 10.1007/s00401-018-1900-5. - DOI - PMC - PubMed
    1. Ballatore C, et al. Microtubule stabilizing agents as potential treatment for Alzheimer’s disease and related neurodegenerative tauopathies. J Med Chem. 2012;55(21):8979–8996. doi: 10.1021/jm301079z. - DOI - PMC - PubMed
    1. Piacentini R, et al. Reduced gliotransmitter release from astrocytes mediates tau-induced synaptic dysfunction in cultured hippocampal neurons. Glia. 2017;65(8):1302–1316. doi: 10.1002/glia.23163. - DOI - PMC - PubMed

Publication types