

Cerebrospinal fluid CD4+ T cell infection in humans and macaques during acute HIV-1 and SHIV infection
- PMID: 34874976
- PMCID: PMC8683024
- DOI: 10.1371/journal.ppat.1010105
Cerebrospinal fluid CD4+ T cell infection in humans and macaques during acute HIV-1 and SHIV infection
Abstract
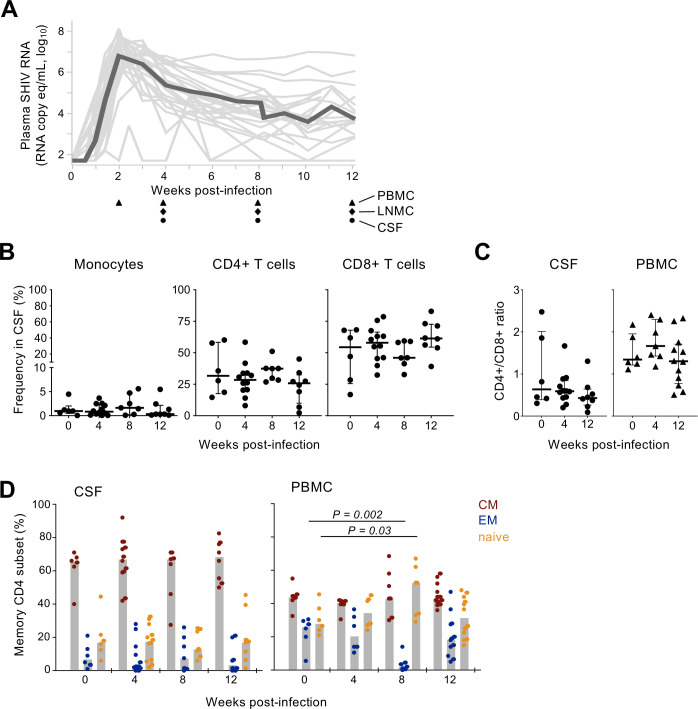
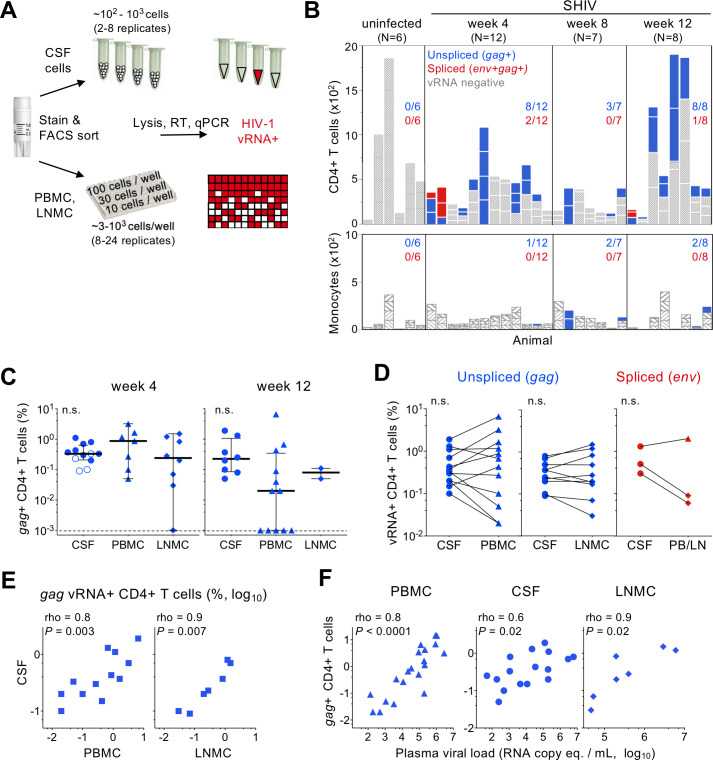
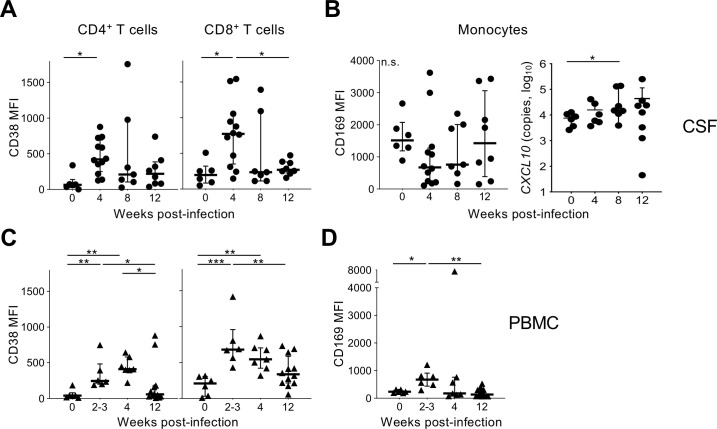
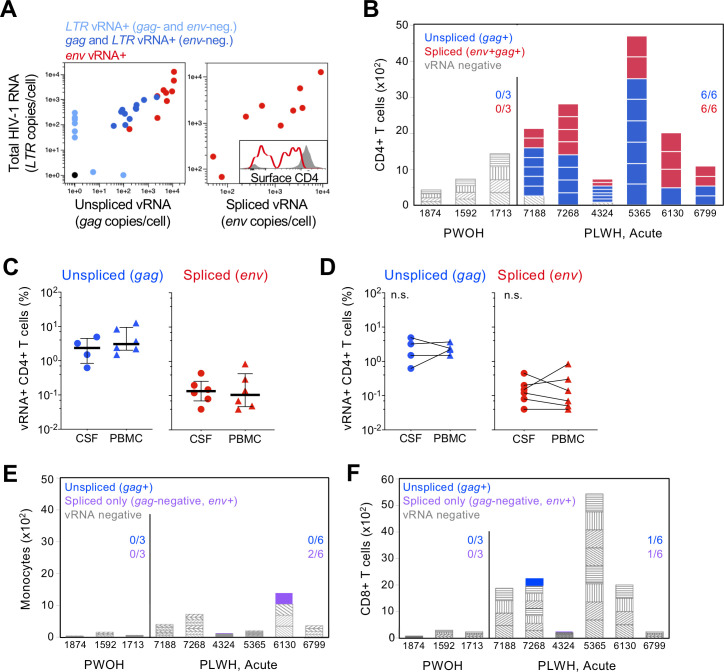
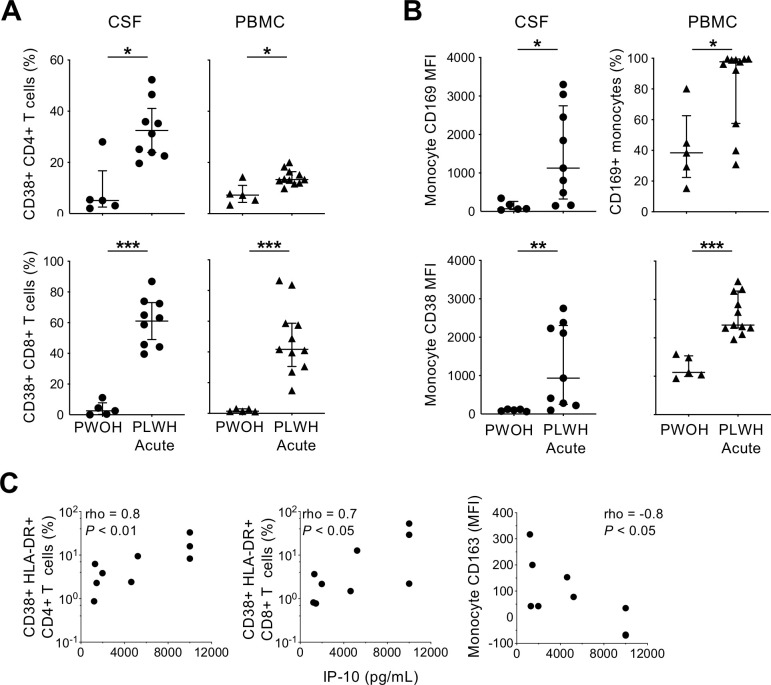
HIV-1 replication within the central nervous system (CNS) impairs neurocognitive function and has the potential to establish persistent, compartmentalized viral reservoirs. The origins of HIV-1 detected in the CNS compartment are unknown, including whether cells within the cerebrospinal fluid (CSF) produce virus. We measured viral RNA+ cells in CSF from acutely infected macaques longitudinally and people living with early stages of acute HIV-1. Active viral transcription (spliced viral RNA) was present in CSF CD4+ T cells as early as four weeks post-SHIV infection, and among all acute HIV-1 specimens (N = 6; Fiebig III/IV). Replication-inactive CD4+ T cell infection, indicated by unspliced viral RNA in the absence of spliced viral RNA, was even more prevalent, present in CSF of >50% macaques and human CSF at ~10-fold higher frequency than productive infection. Infection levels were similar between CSF and peripheral blood (and lymph nodes in macaques), indicating comparable T cell infection across these compartments. In addition, surface markers of activation were increased on CSF T cells and monocytes and correlated with CSF soluble markers of inflammation. These studies provide direct evidence of HIV-1 replication in CD4+ T cells and broad immune activation in peripheral blood and the CNS during acute infection, likely contributing to early neuroinflammation and reservoir seeding. Thus, early initiation of antiretroviral therapy may not be able to prevent establishment of CNS viral reservoirs and sources of long-term inflammation, important targets for HIV-1 cure and therapeutic strategies.
Conflict of interest statement
The authors have declared that no competing interests exist.
Figures
Similar articles
-
Central Nervous System Inflammation and Infection during Early, Nonaccelerated Simian-Human Immunodeficiency Virus Infection in Rhesus Macaques.J Virol. 2018 May 14;92(11):e00222-18. doi: 10.1128/JVI.00222-18. Print 2018 Jun 1. J Virol. 2018. PMID: 29563297 Free PMC article.
-
Simian-Human Immunodeficiency Virus SHIV.C.CH505 Persistence in ART-Suppressed Infant Macaques Is Characterized by Elevated SHIV RNA in the Gut and a High Abundance of Intact SHIV DNA in Naive CD4+ T Cells.J Virol. 2020 Dec 22;95(2):e01669-20. doi: 10.1128/JVI.01669-20. Print 2020 Dec 22. J Virol. 2020. PMID: 33087463 Free PMC article.
-
Brain Macrophages in Simian Immunodeficiency Virus-Infected, Antiretroviral-Suppressed Macaques: a Functional Latent Reservoir.mBio. 2017 Aug 15;8(4):e01186-17. doi: 10.1128/mBio.01186-17. mBio. 2017. PMID: 28811349 Free PMC article.
-
Brain macrophages harbor latent, infectious simian immunodeficiency virus.AIDS. 2019 Dec 1;33 Suppl 2(Suppl 2):S181-S188. doi: 10.1097/QAD.0000000000002269. AIDS. 2019. PMID: 31789817 Free PMC article. Review.
-
What can characterization of cerebrospinal fluid escape populations teach us about viral reservoirs in the central nervous system?AIDS. 2019 Dec 1;33 Suppl 2:S171-S179. doi: 10.1097/QAD.0000000000002253. AIDS. 2019. PMID: 31790378 Review.
Cited by
-
Neuropathogenesis of acute HIV: mechanisms, biomarkers, and therapeutic approaches.Curr Opin HIV AIDS. 2025 May 1;20(3):199-208. doi: 10.1097/COH.0000000000000923. Epub 2025 Mar 26. Curr Opin HIV AIDS. 2025. PMID: 40110851 Free PMC article. Review.
-
Biotypes of Central Nervous System Complications in People With Human Immunodeficiency Virus: Virology, Immunology, and Neuropathology.J Infect Dis. 2023 Mar 17;227(Suppl 1):S3-S15. doi: 10.1093/infdis/jiac370. J Infect Dis. 2023. PMID: 36930640 Free PMC article.
-
Central Nervous System Effects of Early HIV Infection and Consequences of Antiretroviral Therapy Initiation during Acute HIV.Viruses. 2024 Jul 5;16(7):1082. doi: 10.3390/v16071082. Viruses. 2024. PMID: 39066244 Free PMC article. Review.
-
CD4 downregulation precedes Env expression and protects HIV-1-infected cells from ADCC mediated by non-neutralizing antibodies.mBio. 2024 Nov 13;15(11):e0182724. doi: 10.1128/mbio.01827-24. Epub 2024 Oct 7. mBio. 2024. PMID: 39373535 Free PMC article.
-
Non-Human Primate Models of HIV Brain Infection and Cognitive Disorders.Viruses. 2022 Sep 9;14(9):1997. doi: 10.3390/v14091997. Viruses. 2022. PMID: 36146803 Free PMC article. Review.
References
-
- Evering TH, Applebaum A, La Mar M, Garmon D, Dorfman D, Markowitz M. Rates of non-confounded HIV-associated neurocognitive disorders in men initiating combination antiretroviral therapy during primary infection. AIDS. 2016;30(2):203–10. Epub 2015/12/20. doi: 10.1097/QAD.0000000000000892 ; PubMed Central PMCID: PMC4685724. - DOI - PMC - PubMed
Publication types
MeSH terms
Substances
Grants and funding
LinkOut - more resources
Full Text Sources
Medical
Research Materials
