. 2022 Jan 7;39(1):msab339.
doi: 10.1093/molbev/msab339.

Population Histories and Genomic Diversity of South American Natives

Affiliations

Population Histories and Genomic Diversity of South American Natives

Marcos Araújo Castro E Silva et al. Mol Biol Evol. .

Abstract

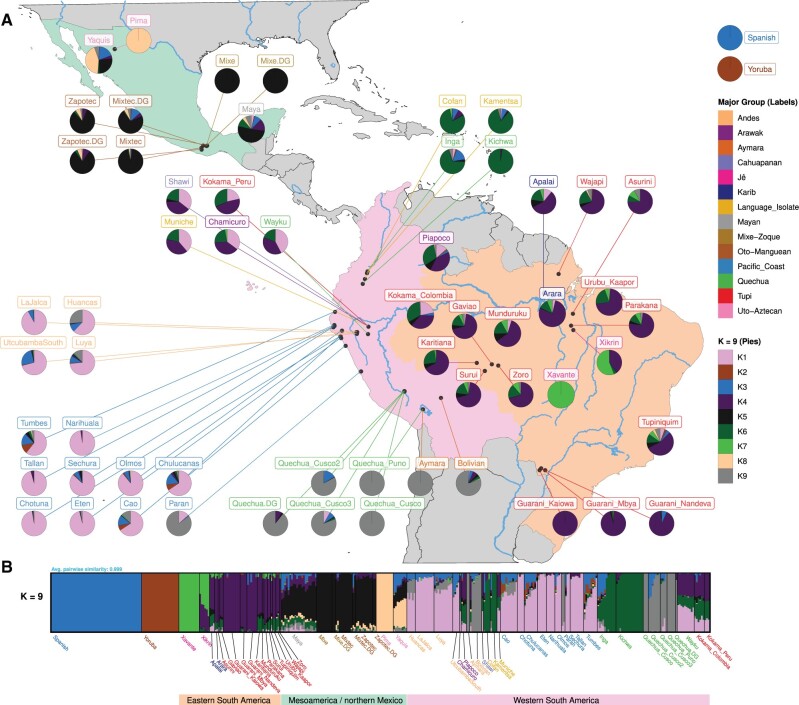
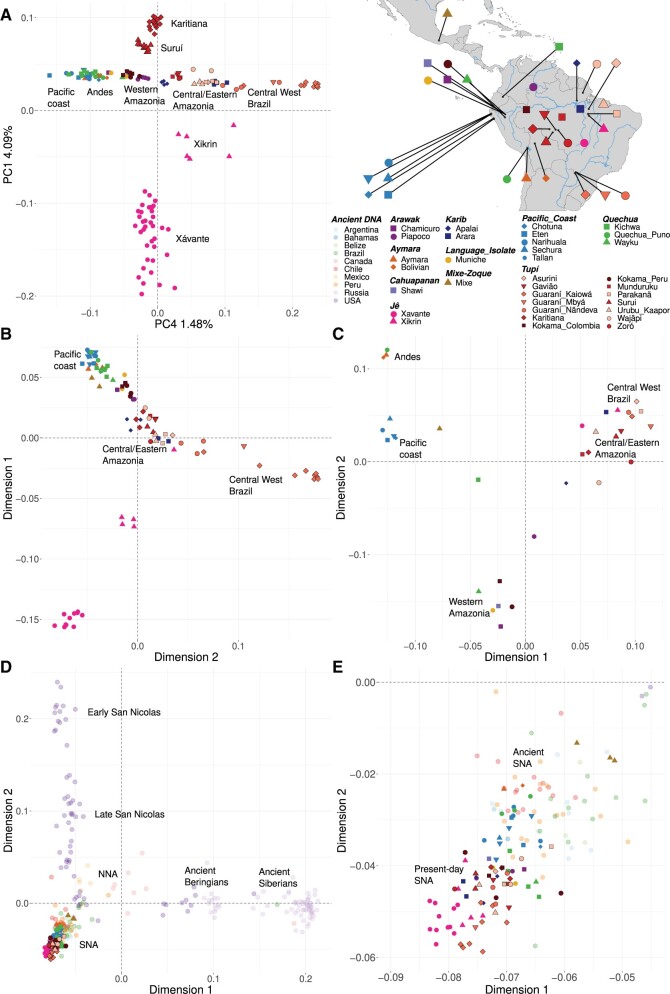
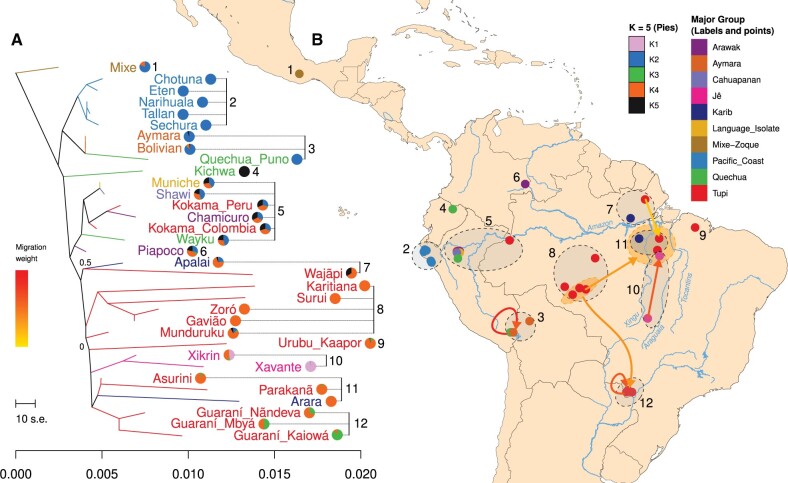
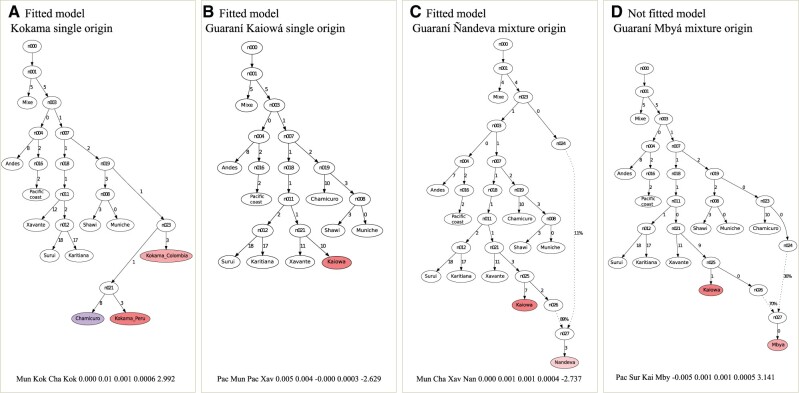
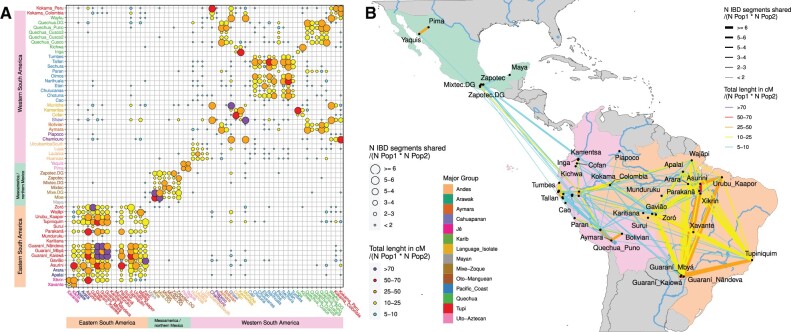
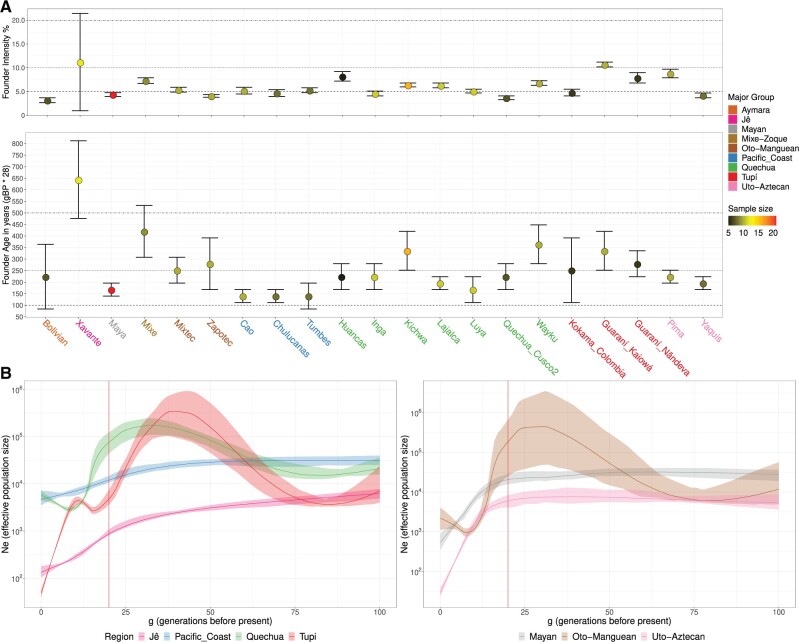
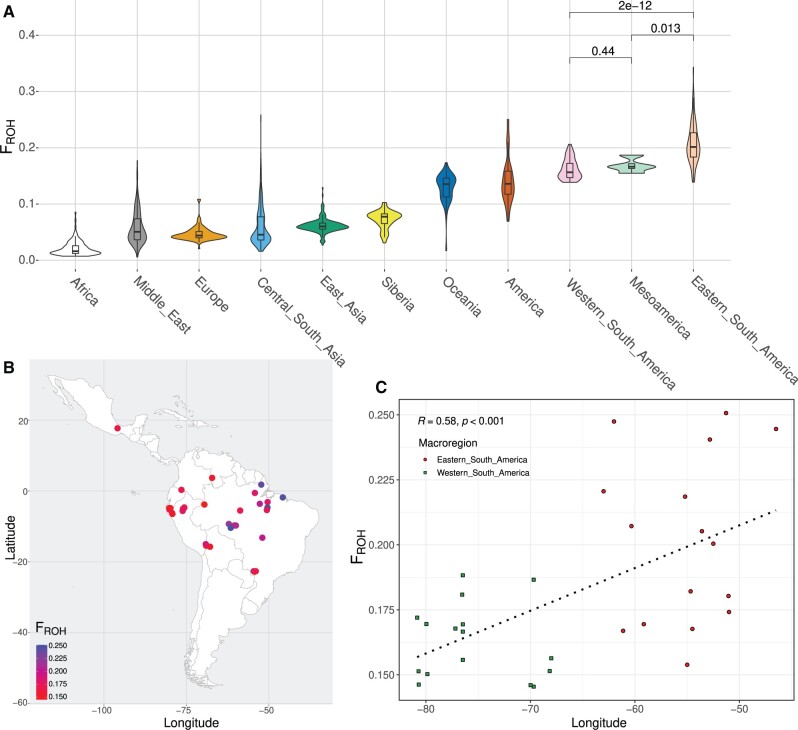
South America is home to one of the most culturally diverse present-day native populations. However, the dispersion pattern, genetic substructure, and demographic complexity within South America are still poorly understood. Based on genome-wide data of 58 native populations, we provide a comprehensive scenario of South American indigenous groups considering the genomic, environmental, and linguistic data. Clear patterns of genetic structure were inferred among the South American natives, presenting at least four primary genetic clusters in the Amazonian and savanna regions and three clusters in the Andes and Pacific coast. We detected a cline of genetic variation along a west-east axis, contradicting a hard Andes-Amazon divide. This longitudinal genetic variation seemed to have been shaped by both serial population bottlenecks and isolation by distance. Results indicated that present-day South American substructures recapitulate ancient macroregional ancestries and western Amazonia groups show genetic evidence of cultural exchanges that led to language replacement in precontact times. Finally, demographic inferences pointed to a higher resilience of the western South American groups regarding population collapses caused by the European invasion and indicated precontact population reductions and demic expansions in South America.

Keywords: Andes-Amazonia divide; genetics; native Americans; settlement of South America.


Figures

Fig. 1.
Fig. 1.
Genetic structure of the Native Americans. An unsupervised admixture analysis with the number of putative ancestry components (K) ranging from 2 to 10 was applied to the LD-pruned set of unrelated Native Americans and the results with K = 9 are shown here, which is the highest K where a consensus was obtained. The complete set of analyses, from K = 2 to K = 10, is shown in supplementary figures S5 and S6, Supplementary Material online. (A) A partial map of the American continent with mean putative ancestry component estimates per group plotted in their approximate sampling locations. (B) Bar plot of the individual ancestry component estimates created using PONG (Behr et al. 2016). In (A) and (B), the name tags and the putative ancestry components are color coded as indicated by the legends on the right (major group affiliations as in table 1). Finally, the three main continental regions are indicated by color shade in (A) and colored bar at the bottom in (B): Mesoamerica and northern Mexico in light green, western South America in pink, and eastern South American in beige.
Fig. 2.
Fig. 2.
Global patterns of ancestry and genetic affinity among present-day and ancient Native Americans. (A) A PCA was applied to the LD-pruned subset of unadmixed and unrelated Native Americans and here we show PC1 and PC4 because it captures the longitudinal cline. The complete set of analyses is shown in supplementary figure S9, Supplementary Material online. Using the same data set, we estimated genetic distances as 1 − outgroup F3 (Mbuti; Y, Z), where Y and Z are any indigenous group or individual. MDS was then applied to the matrices of pairwise genetic distances. (B) MDS of the population-wise genetic distances matrix. (C) MDS of the individual-based genetic distances matrix. The complete set of F3 statistics is presented in supplementary data set S5A and B, Supplementary Material online. Finally, ancient DNA samples from across the whole American continent and Siberia were included in the analysis, and the pairwise genetic distances were calculated as 1 − outgroup F3 (Mbuti; Y, Z), where Y and Z are any present-day and ancient individuals. (D) MDS of the complete data set. (E) Southern Native Americans (SNA) in more detail. The complete set of statistics is presented in supplementary data set S5C, Supplementary Material online. The legend at the top right shows the symbol and color used for each present-day group (major group affiliations as in table 1) or the country of origin of each aDNA sample, and the map indicates the approximate location of each group.
Fig. 3.
Fig. 3.
Population diversification patterns reflect the geographic distribution. Using the LD-pruned subset of unadmixed and unrelated Native Americans, (A) a maximum likelihood (ML) tree was estimated based on pairwise population covariance using Treemix (Pickrell and Pritchard 2012), and gene flow events were progressively modeled between the branches of the ML tree with the poorest fit. The model likelihood reaches a plateau at six gene flow events; therefore, we additionally present these gene flow events (exclusively in B). Using the same data set, we also performed an unsupervised admixture analysis and we present the results with K = 5 as pie charts at the right side of each group in the ML tree. The complete set of analyses is shown in supplementary figures S7 and S8, Supplementary Material online. (B) Group geographic locations are indicated as points on a map, which along with group labels on the ML tree (A) are color coded to indicate affiliation to the major groups (table 1). Finally, we also cross-reference the groups on the ML tree (A) to their geographic locations on the map (B), as well as gene flow events (color-coded arrows), inferred in the model with six gene flows (likelihood plateau; supplementary fig. S10, Supplementary Material online), indicating their direction (arrowheads) and intensity (color coded).
Fig. 4.
Fig. 4.
Evidence of Pre-Columbian cultural exchange and admixture between South American natives. We leveraged the unadmixed and unrelated subset of Native American groups to model the possible ancestral contributions to the Kokama and Guaraní ethnolinguistic groups. (A) Best fitted model for the Kokama group (from Peru and Colombia)—single origin. (B) Best fitted model for the Guaraní Kaiowá group—single origin. (C) Best fitted model for Guaraní Nãndeva group—mixed origin. (D) Best fitted model for Guaraní Mbyá group—mixed origin.
Fig. 5.
Fig. 5.
Network of Pre-Columbian IBD sharing among present-day Native American groups. The IBD genomic segments were identified based on the phased data subset of unrelated Native Americans, then these segments were filtered to select only those inferred to be in genomic regions of Native American local ancestry. Segments shorter than 2 cM were removed and pairwise connections with less than 5 cM shared on average were also not considered. Here, we present the results obtained using IBD segments with at most 8.4 cM of length, which approximately correspond to those that originated in the Pre-Columbian period (before 1500 CE). The average number of IBD segments (color) and the average length of IBD in cM (size), are shown as a matrix (A) and as a network on a map (B). The classification of populations into major groups (table 1) is also color coded, as indicated in the legend at the center (axes labels in A). The three main continental regions are indicated by a set of colored bars at the left and the bottom of A, matching the same colors used in the map regions in (B). The intrapopulation IBD is shown in the diagonal in (A). Some group labels are shown in (B) for reference. For the patterns of IBD sharing in the colonial and recent periods, see supplementary figure S10, Supplementary Material online. The complete set of IBD segments inferred are presented in supplementary data set S4, Supplementary Material online.
Fig. 6.
Fig. 6.
The postcontact population collapse and Native American effective population size (Ne) histories. (A) We applied the ASCEND (Tournebize et al. 2020) method to every Native American group with more than 5 unrelated samples (and also to some clusters of groups to reach the minimum sample size of 5, see supplementary fig. S15, Supplementary Material online), and we also selected the groups with an estimated FA lower than 1000 BP. In A, the top panels depict the FI, and the bottom panels show the mean estimate of the FA for each indigenous group. For each group, the estimated FI and FA are shown along with their associated 95% confidence interval. The sample size is color coded on the points and the affiliations with major groups are indicated in the group label IDs at the x-axis, both indicated in the legend. In the top panels, the y-axis indicates the FI percentage and in the bottom panel, the y-axis shows the estimated FA calculated as: “x” generation before present (gBP) * 28 years per generation = “y” years before present (BP). (B) The IBD genomic segments were identified with the phased data set of Native American groups, followed by a selection of the segments inferred to be in genomic regions of Native American ancestry. The complete set of IBD segments was separated into subsets of major groups (table 1) from South America (B left) and Mesoamerica/Northern Mexico (B right), and then each set was used to infer the Ne history of each specific major group. The ancestry-specific Ne values are coded in the y-axis (log scale) and indicated by a line for each generation before the present (gBP) depicted in the x-axis. The shaded areas show a 95% bootstrap confidence interval for each major group. The vertical red line indicates 20 gBP (approximately 1500 CE) and therefore the time of the first contact with Europeans. Here, we show the results of IBDNe using the parameter filtersamples = “false,” alternatively the results produced with the parameter filtersamples = “true” are shown in supplementary figure S16, Supplementary Material online.
Fig. 7.
Fig. 7.
Distribution of inbreeding coefficient from ROH in Native Americans. (A) The distribution of FROH was obtained averaging the individual estimates from a combined set of the unadmixed Native Americans along with HGDP and SGDP databases (Africa, Middle East, Europe, Central South Asia, East Asia, Siberia, and America). The P values were obtained from a nonparametric Wilcoxon rank-sum test. (B) Population average estimates of FROH were plotted according to the corresponding geographic location. (C) Correlation of FROH values according to the longitude of each population. The dotted line was estimated by linear regression. The Spearman correlation coefficient and its corresponding P-value are also presented.

References

    1. Adhikari K, Chacón-Duque JC, Mendoza-Revilla J, Fuentes-Guajardo M, Ruiz-Linares A.. 2017. The genetic diversity of the Americas. Annu Rev Genomics Hum Genet. 18:277–296. - PubMed
    1. Alexander DH, Novembre J, Lange K.. 2009. Fast model-based estimation of ancestry in unrelated individuals. Genome Res. 19(9):1655–1664. - PMC - PubMed
    1. Baharian S, Barakatt M, Gignoux CR, Shringarpure S, Errington J, Blot WJ, Bustamante CD, Kenny EE, Williams SM, Aldrich MC, et al. 2016. The great migration and African-American genomic diversity. PLoS Genet. 12(5):e1006059. - PMC - PubMed
    1. Barbieri C, Barquera R, Arias L, Sandoval JR, Acosta O, Zurita C, Aguilar-Campos A, Tito-Álvarez AM, Serrano-Osuna R, Gray RD, et al. 2019. The current genomic landscape of Western South America: Andes, Amazonia, and Pacific Coast. Mol Biol Evol. 36(12):2698–2713. - PMC - PubMed
    1. Behr AA, Liu KZ, Liu-Fang G, Nakka P, Ramachandran S.. 2016. pong: fast analysis and visualization of latent clusters in population genetic data. Bioinformatics 32(18):2817–2823. - PMC - PubMed

Publication types