. 2021 Dec 22;184(26):6281-6298.e23.
doi: 10.1016/j.cell.2021.11.018. Epub 2021 Dec 6.

Stem-like intestinal Th17 cells give rise to pathogenic effector T cells during autoimmunity

Affiliations

Stem-like intestinal Th17 cells give rise to pathogenic effector T cells during autoimmunity

Alexandra Schnell et al. Cell. .

Abstract

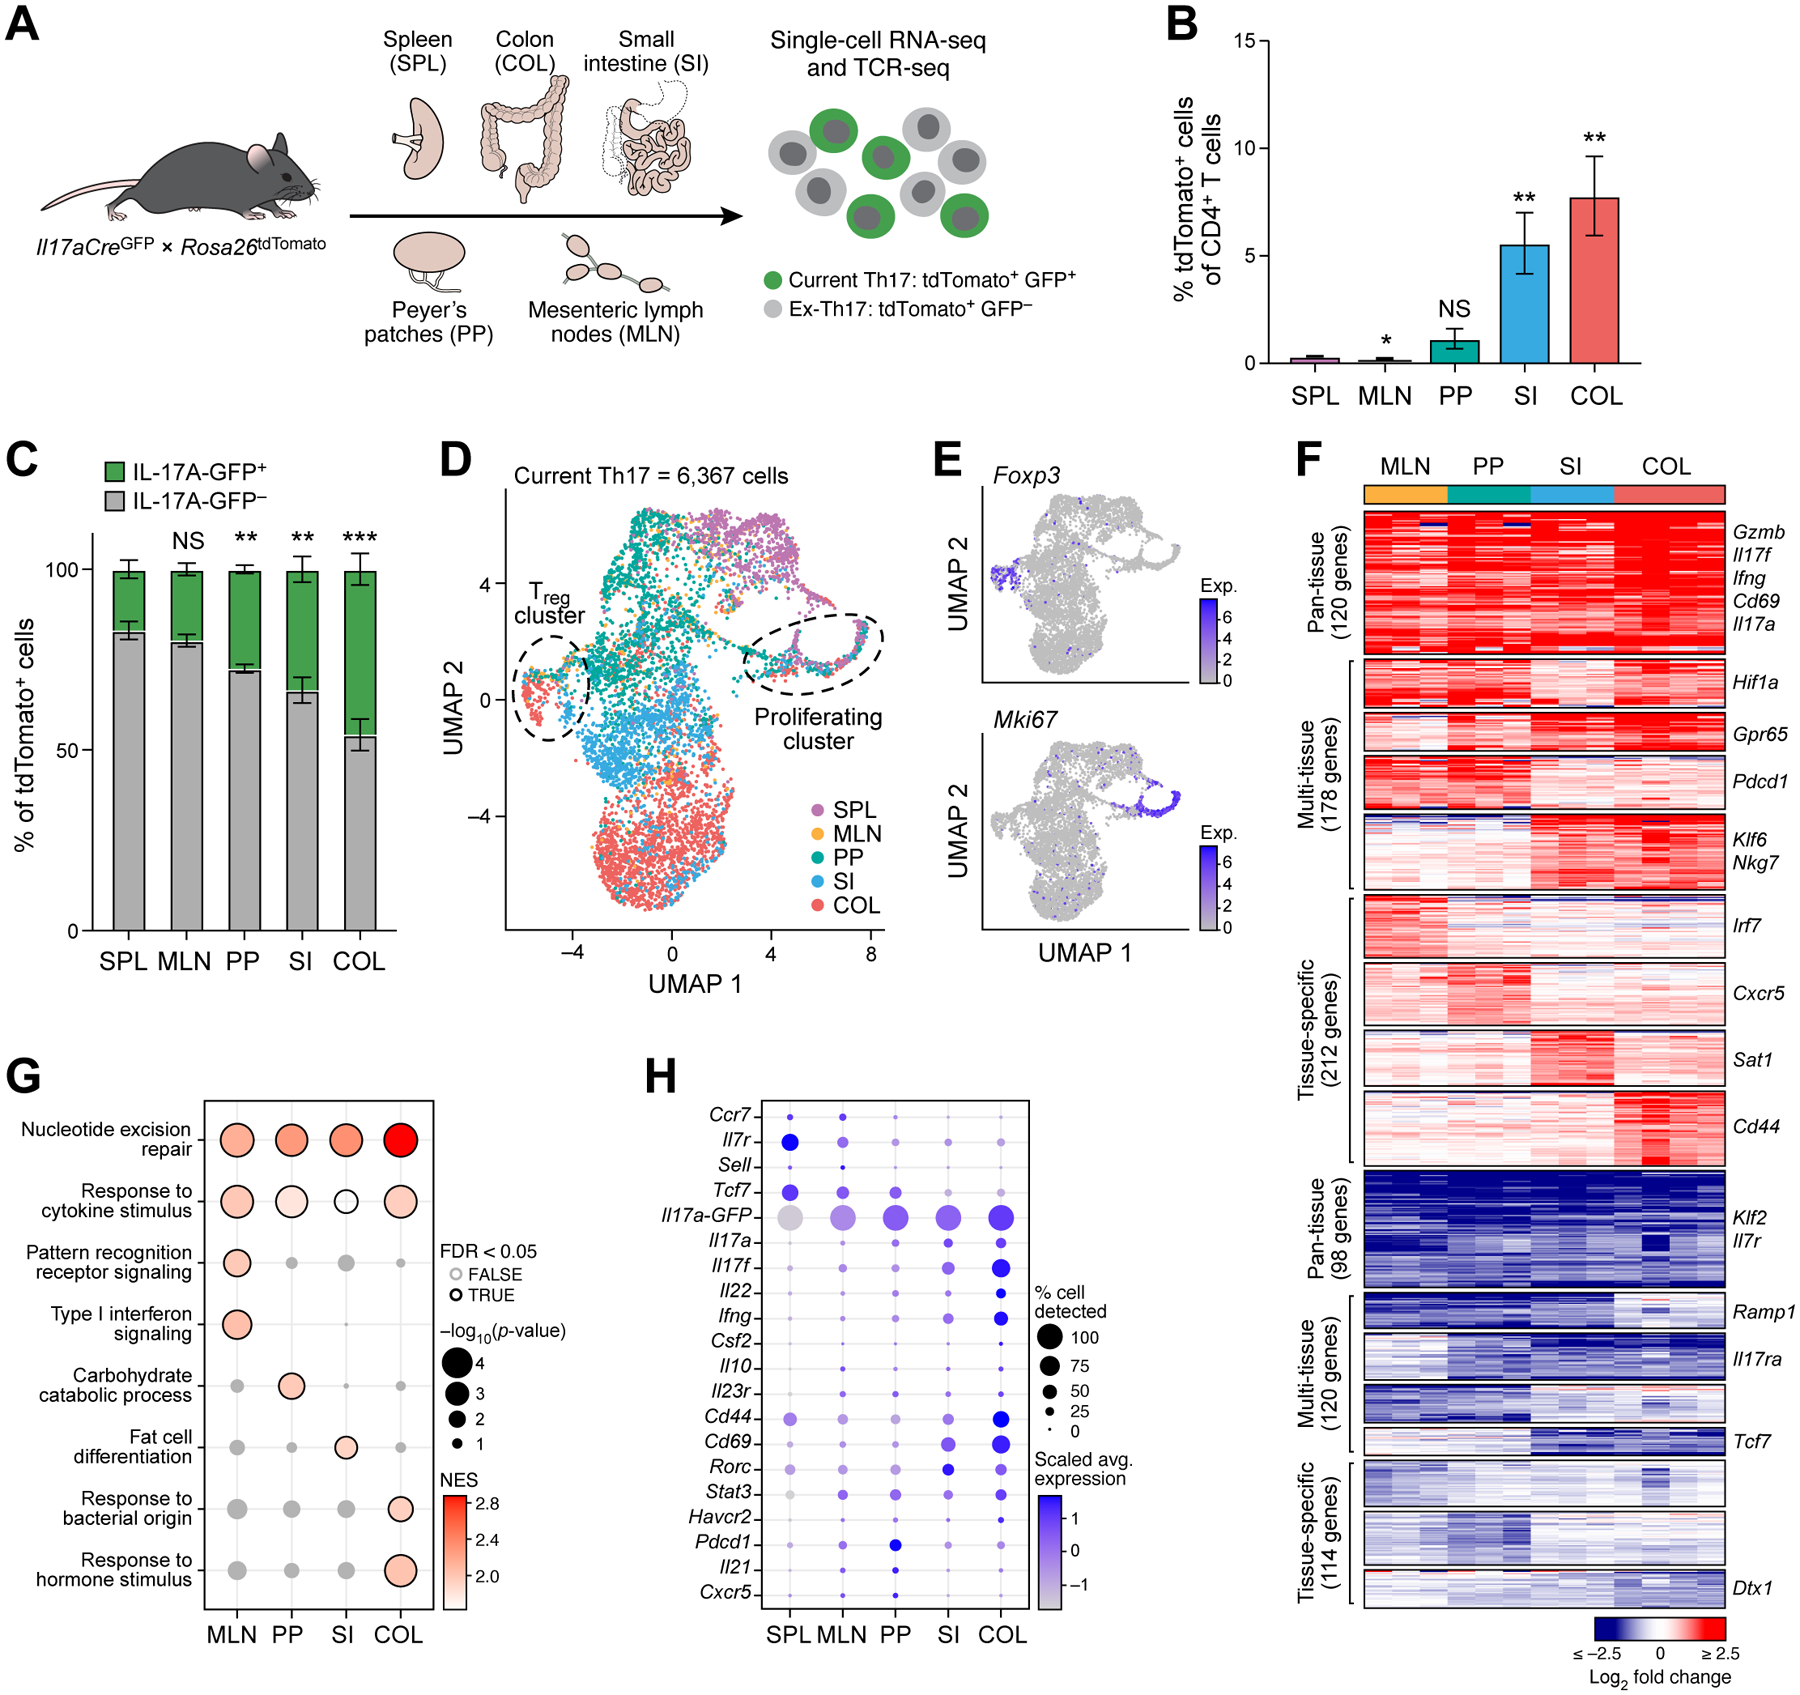
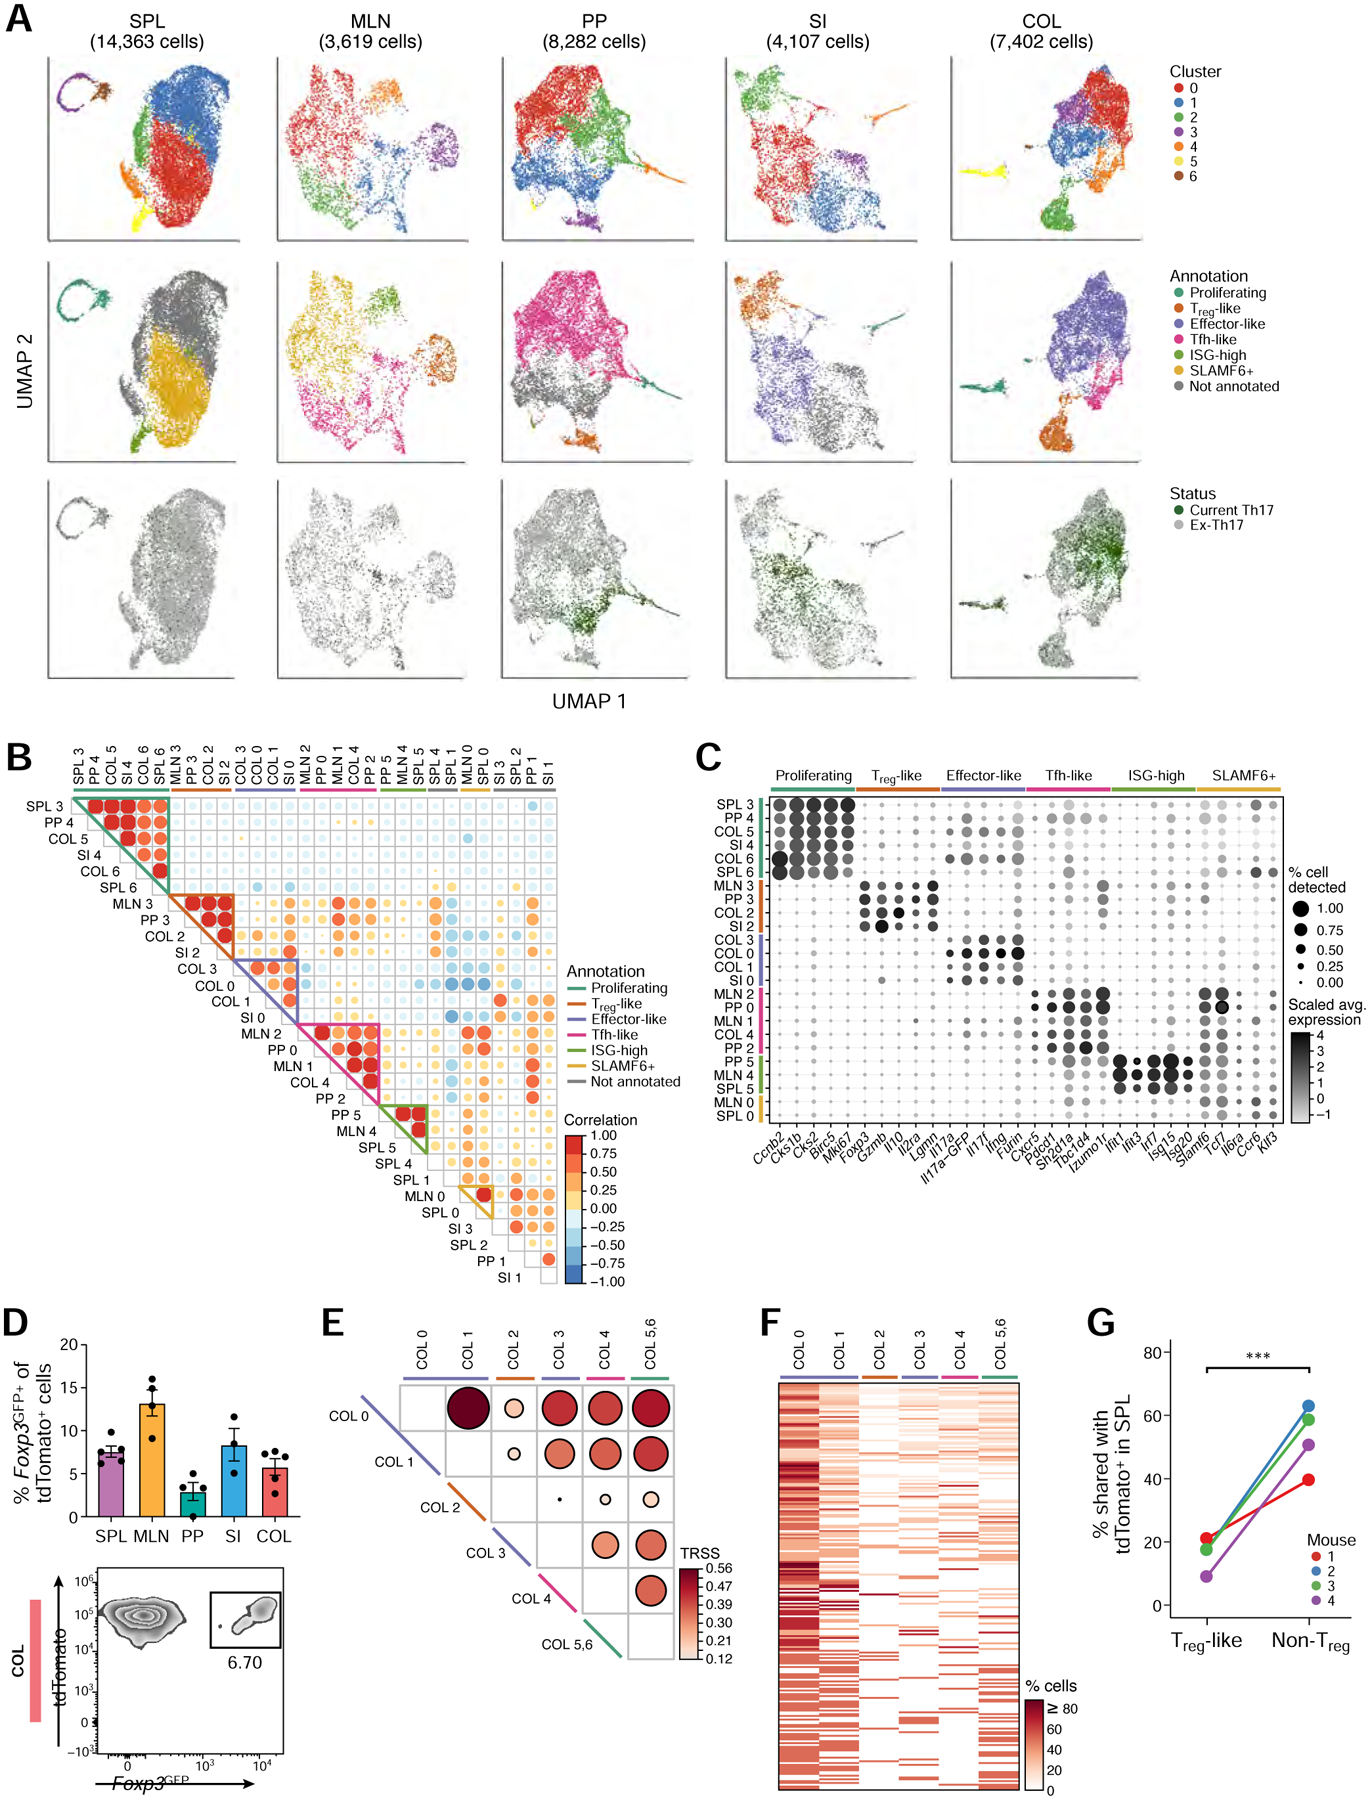
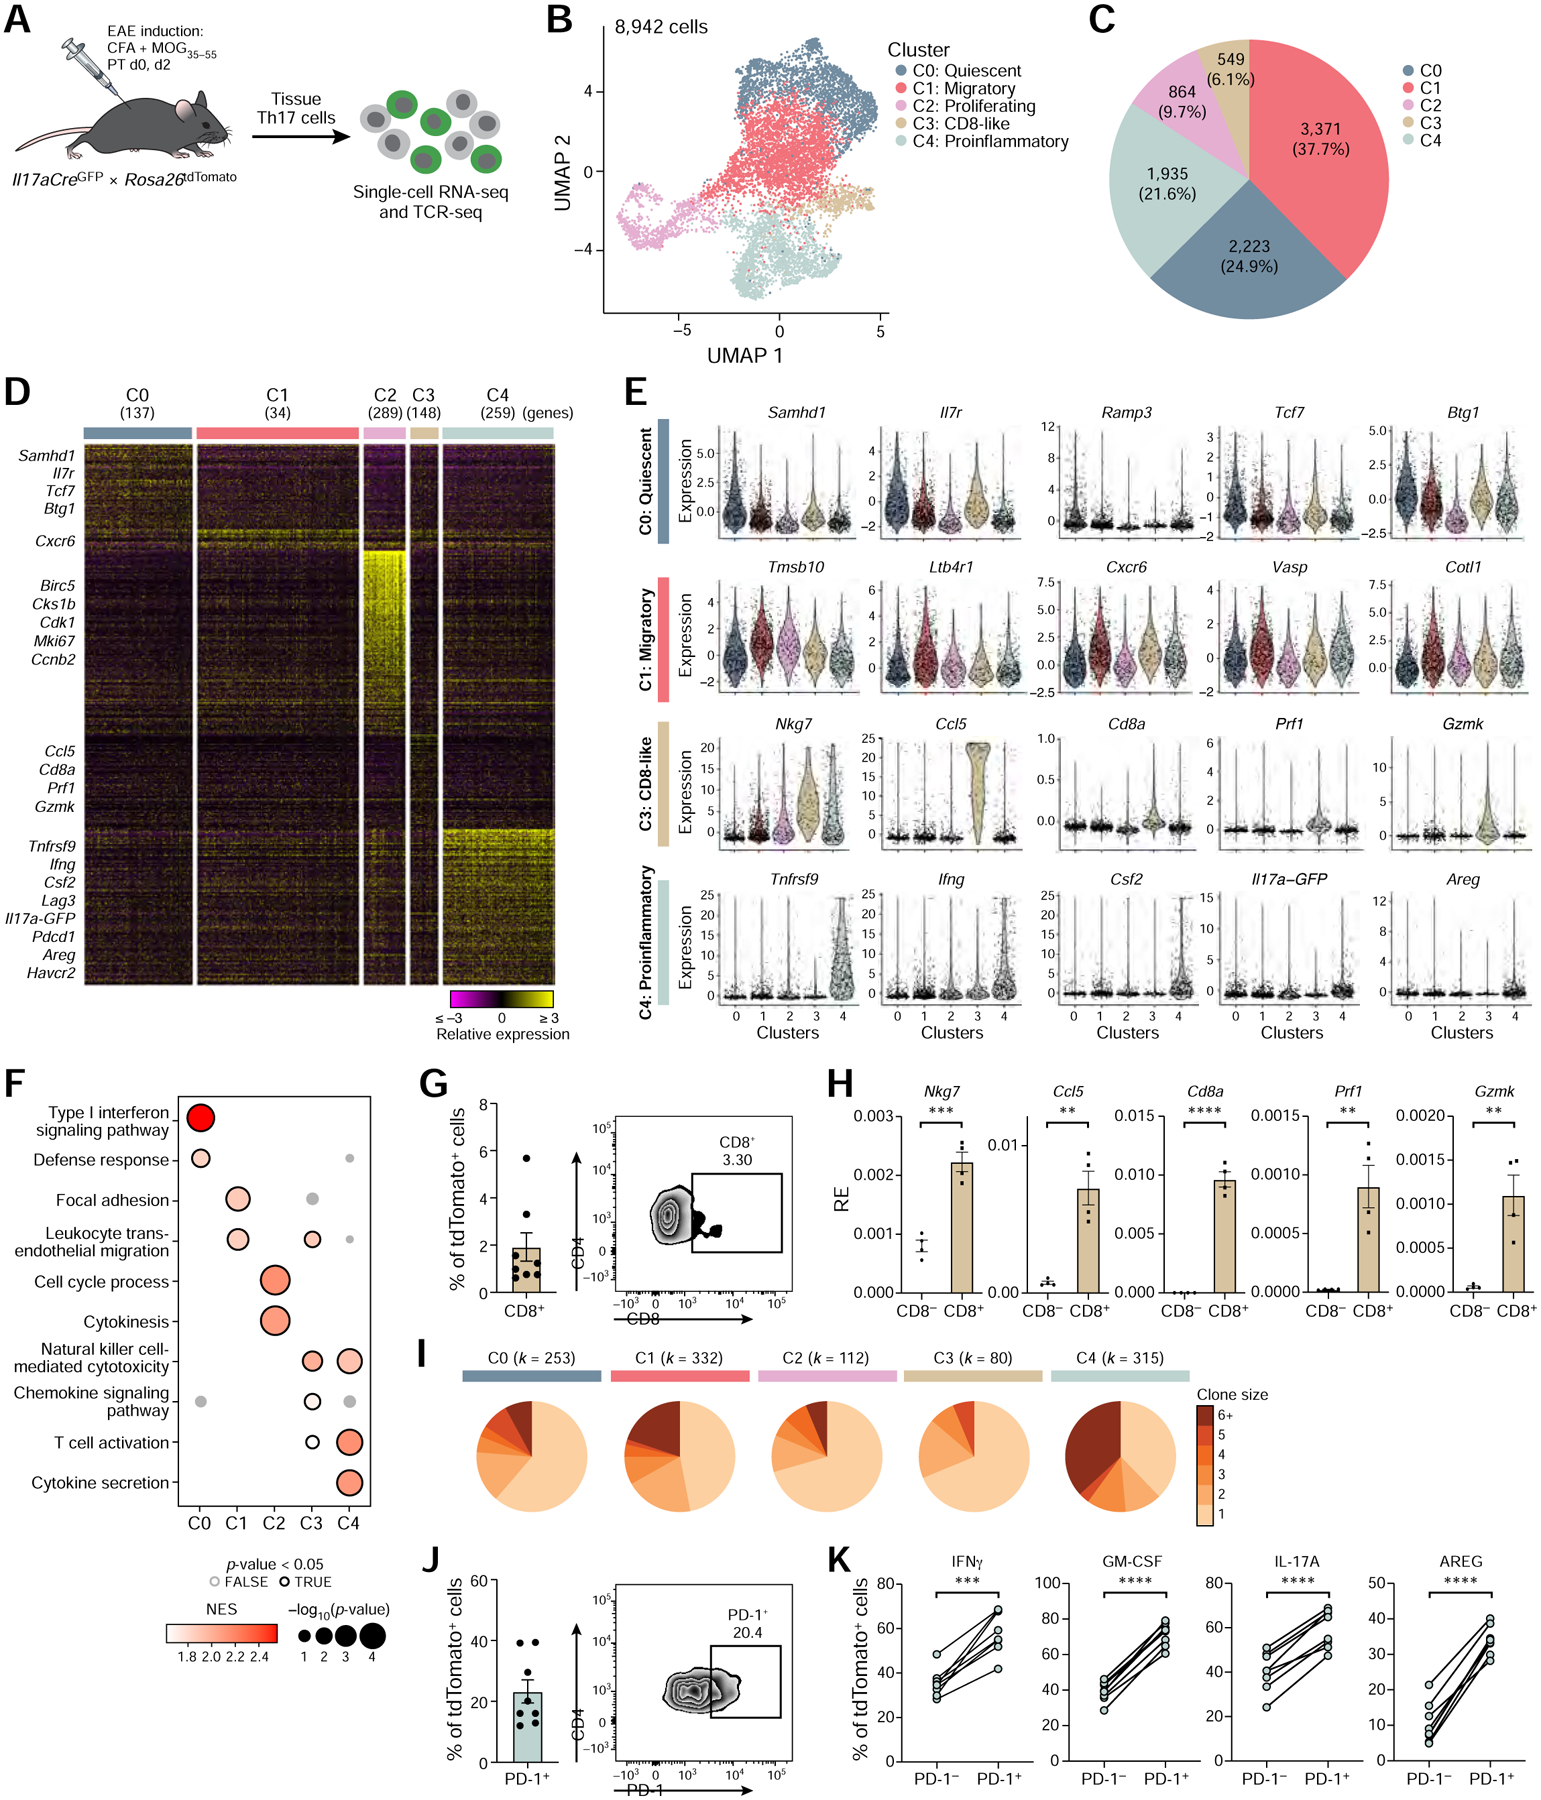
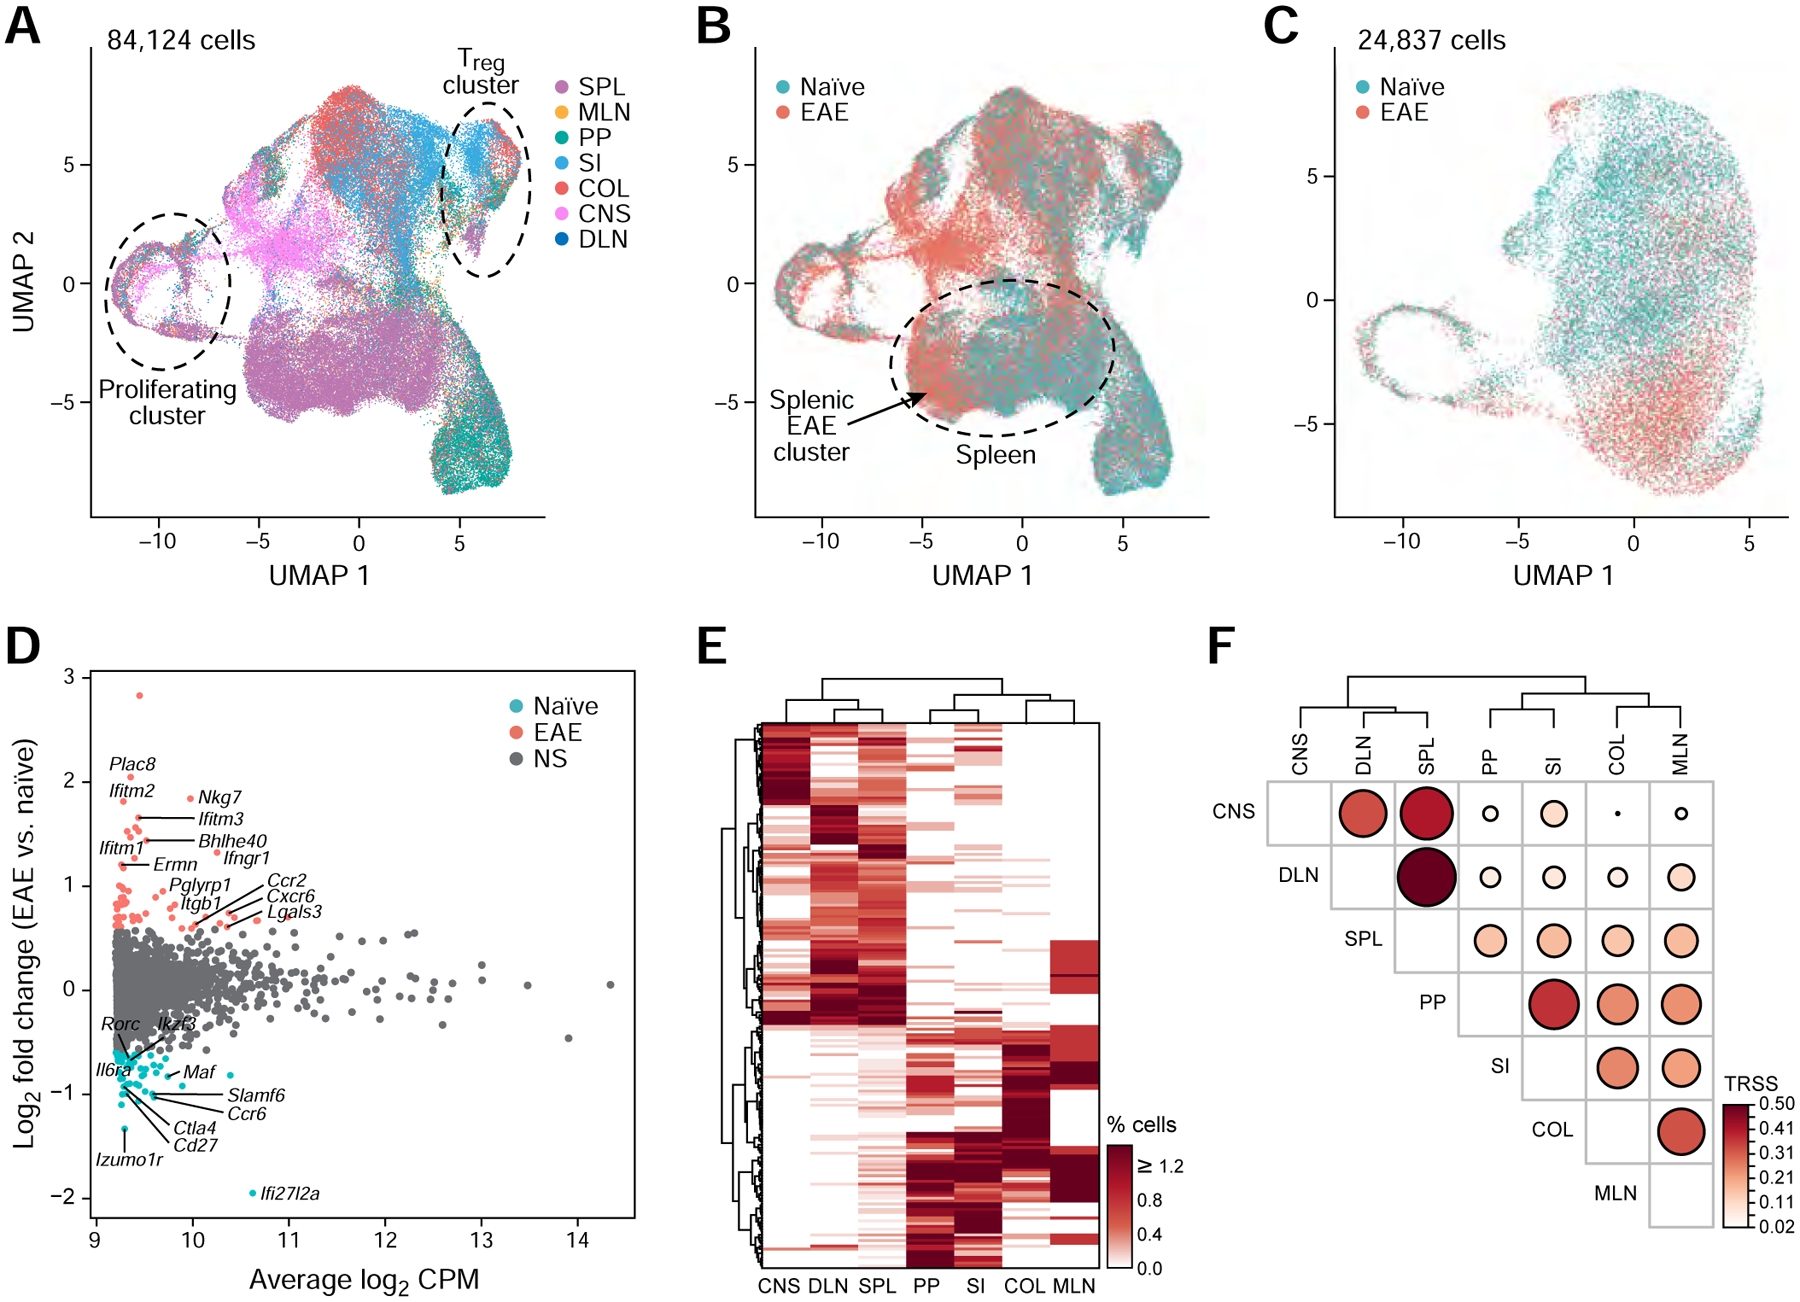
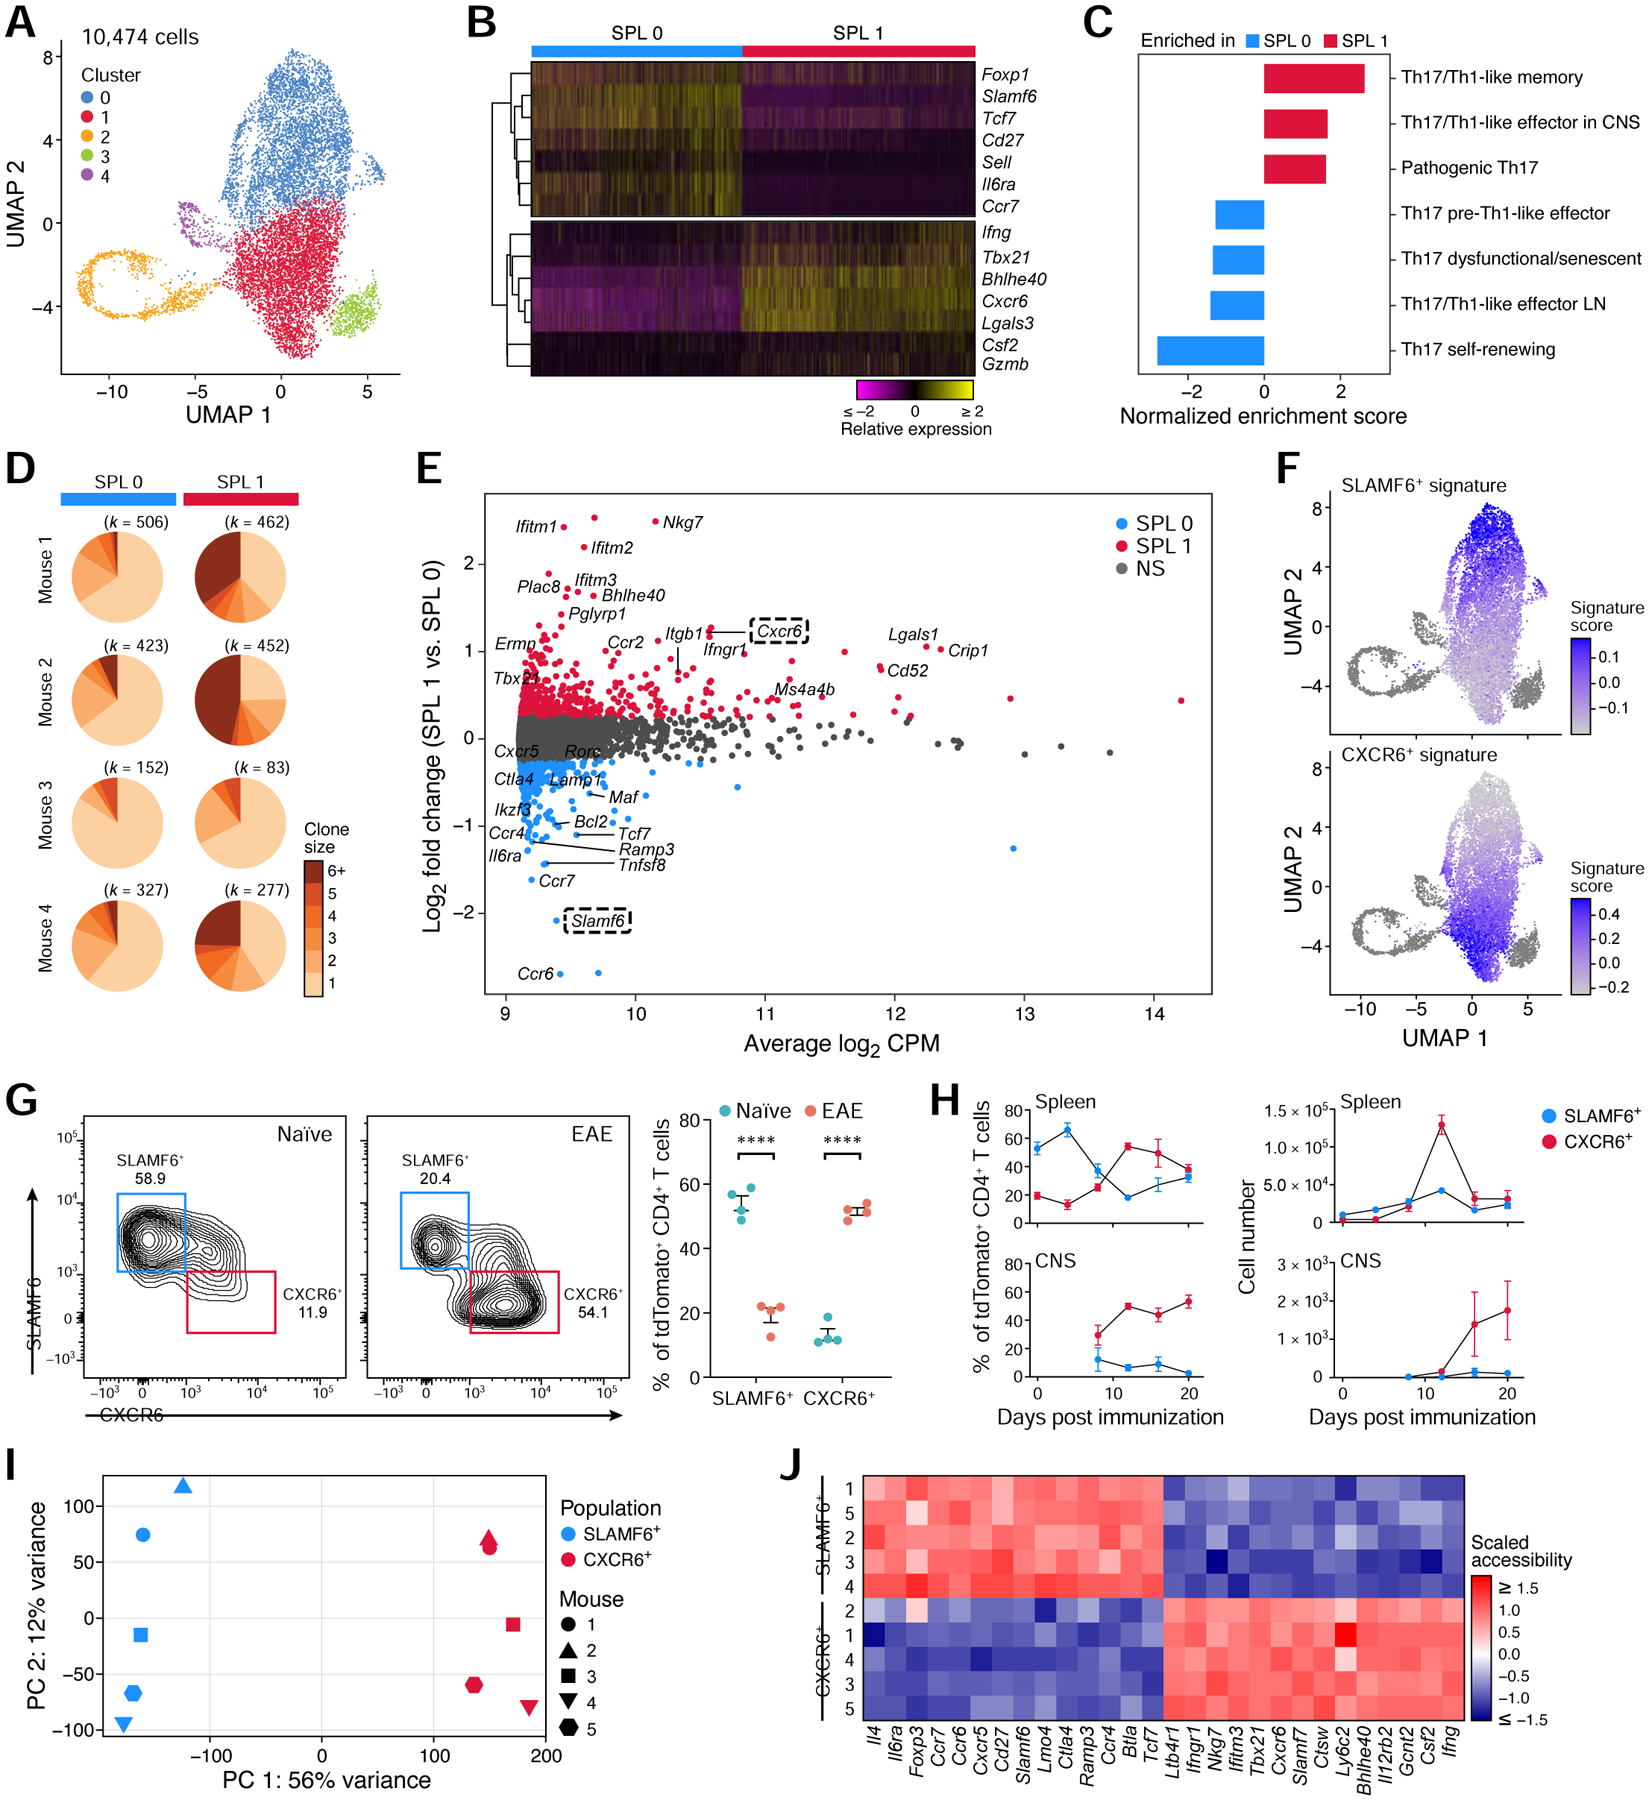
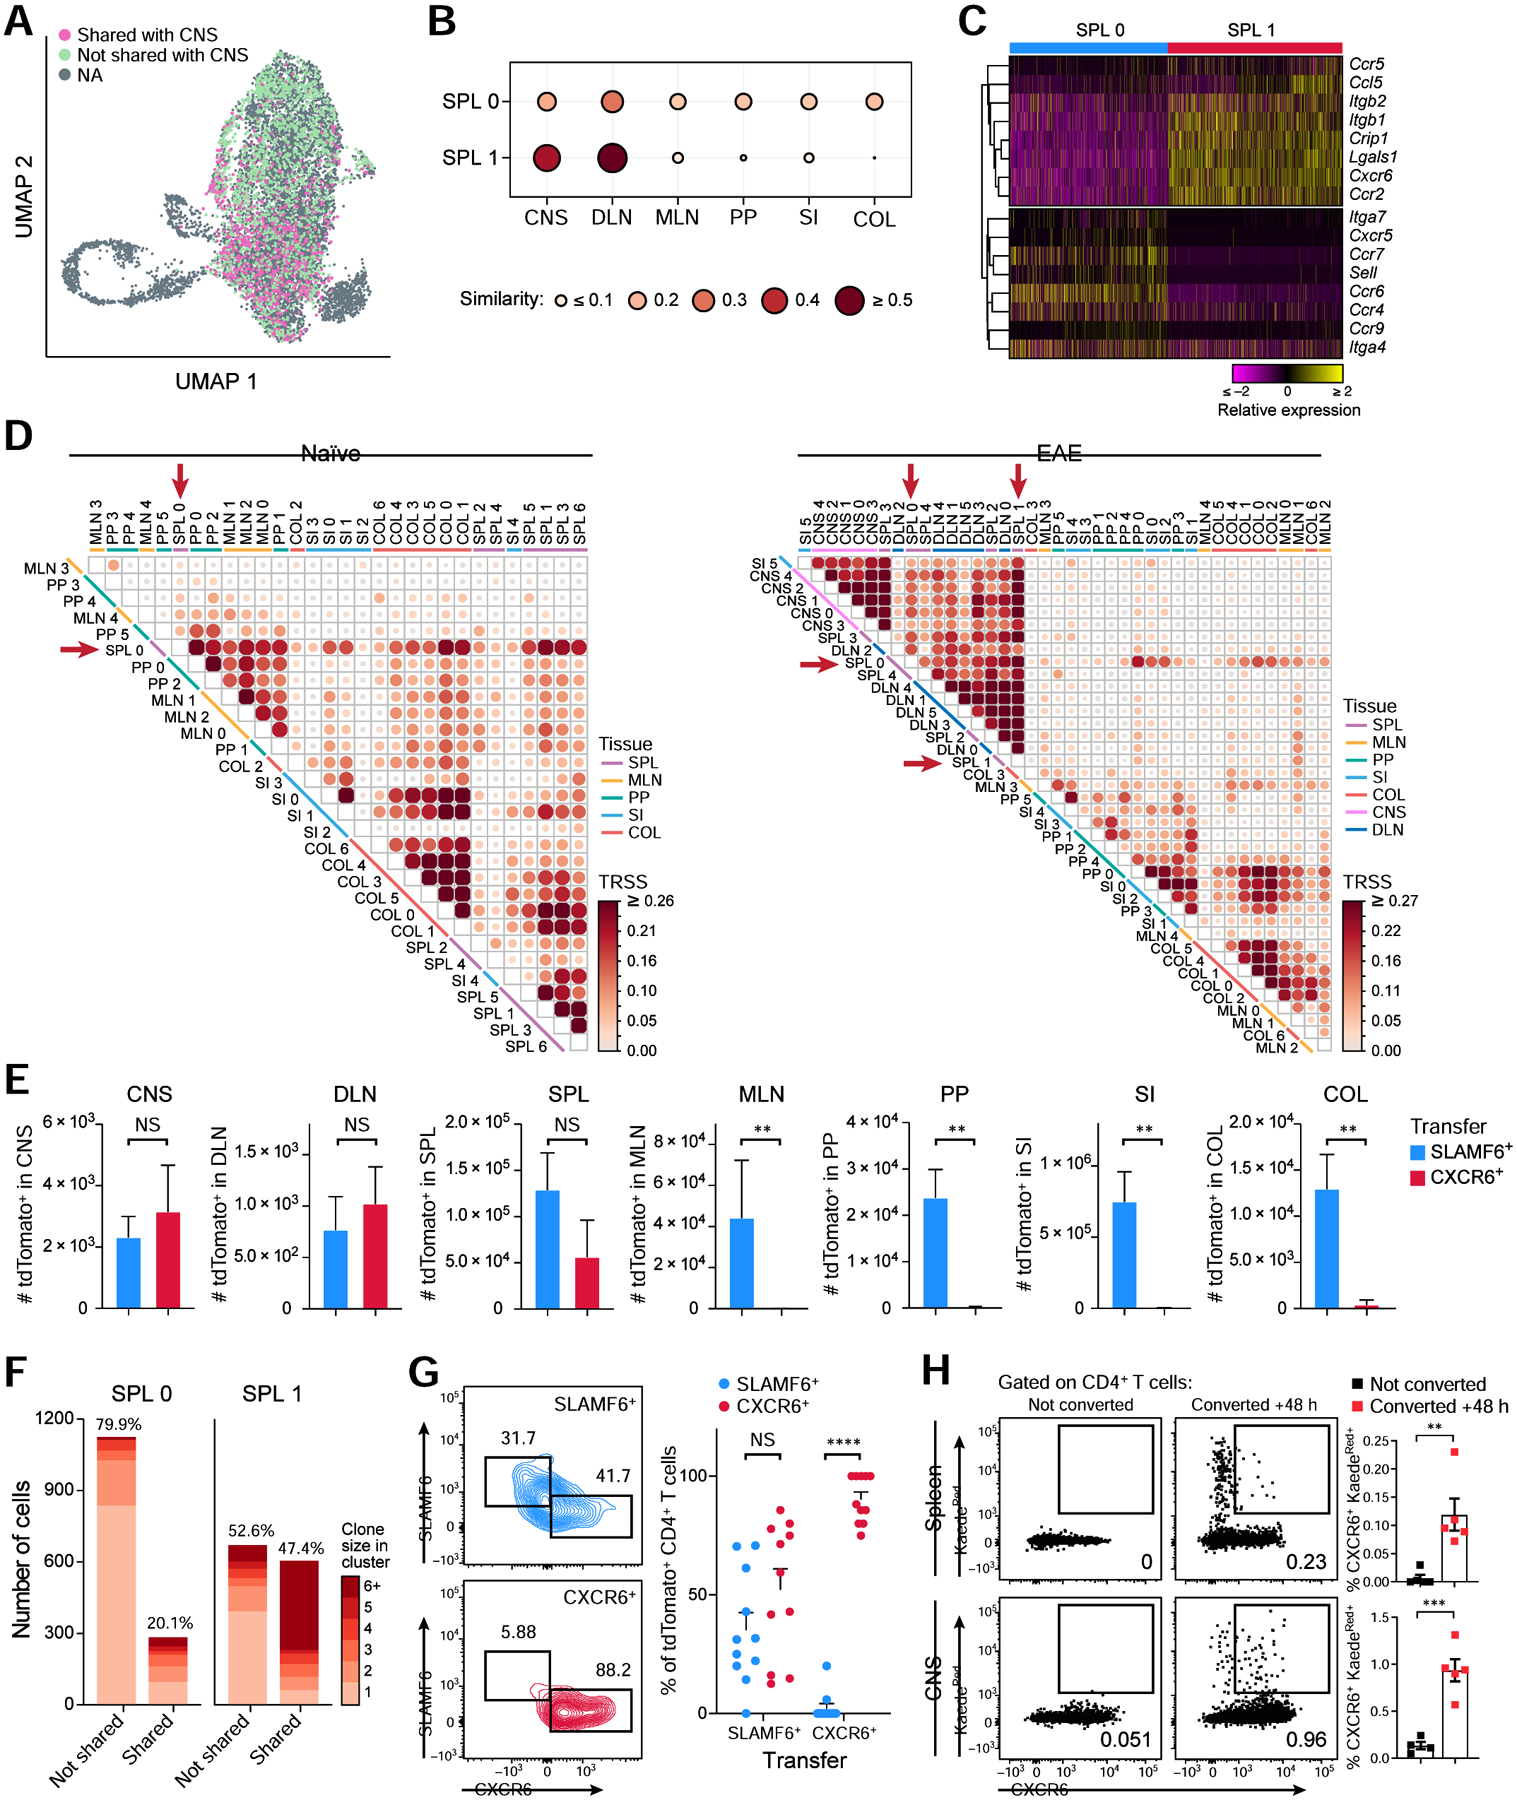
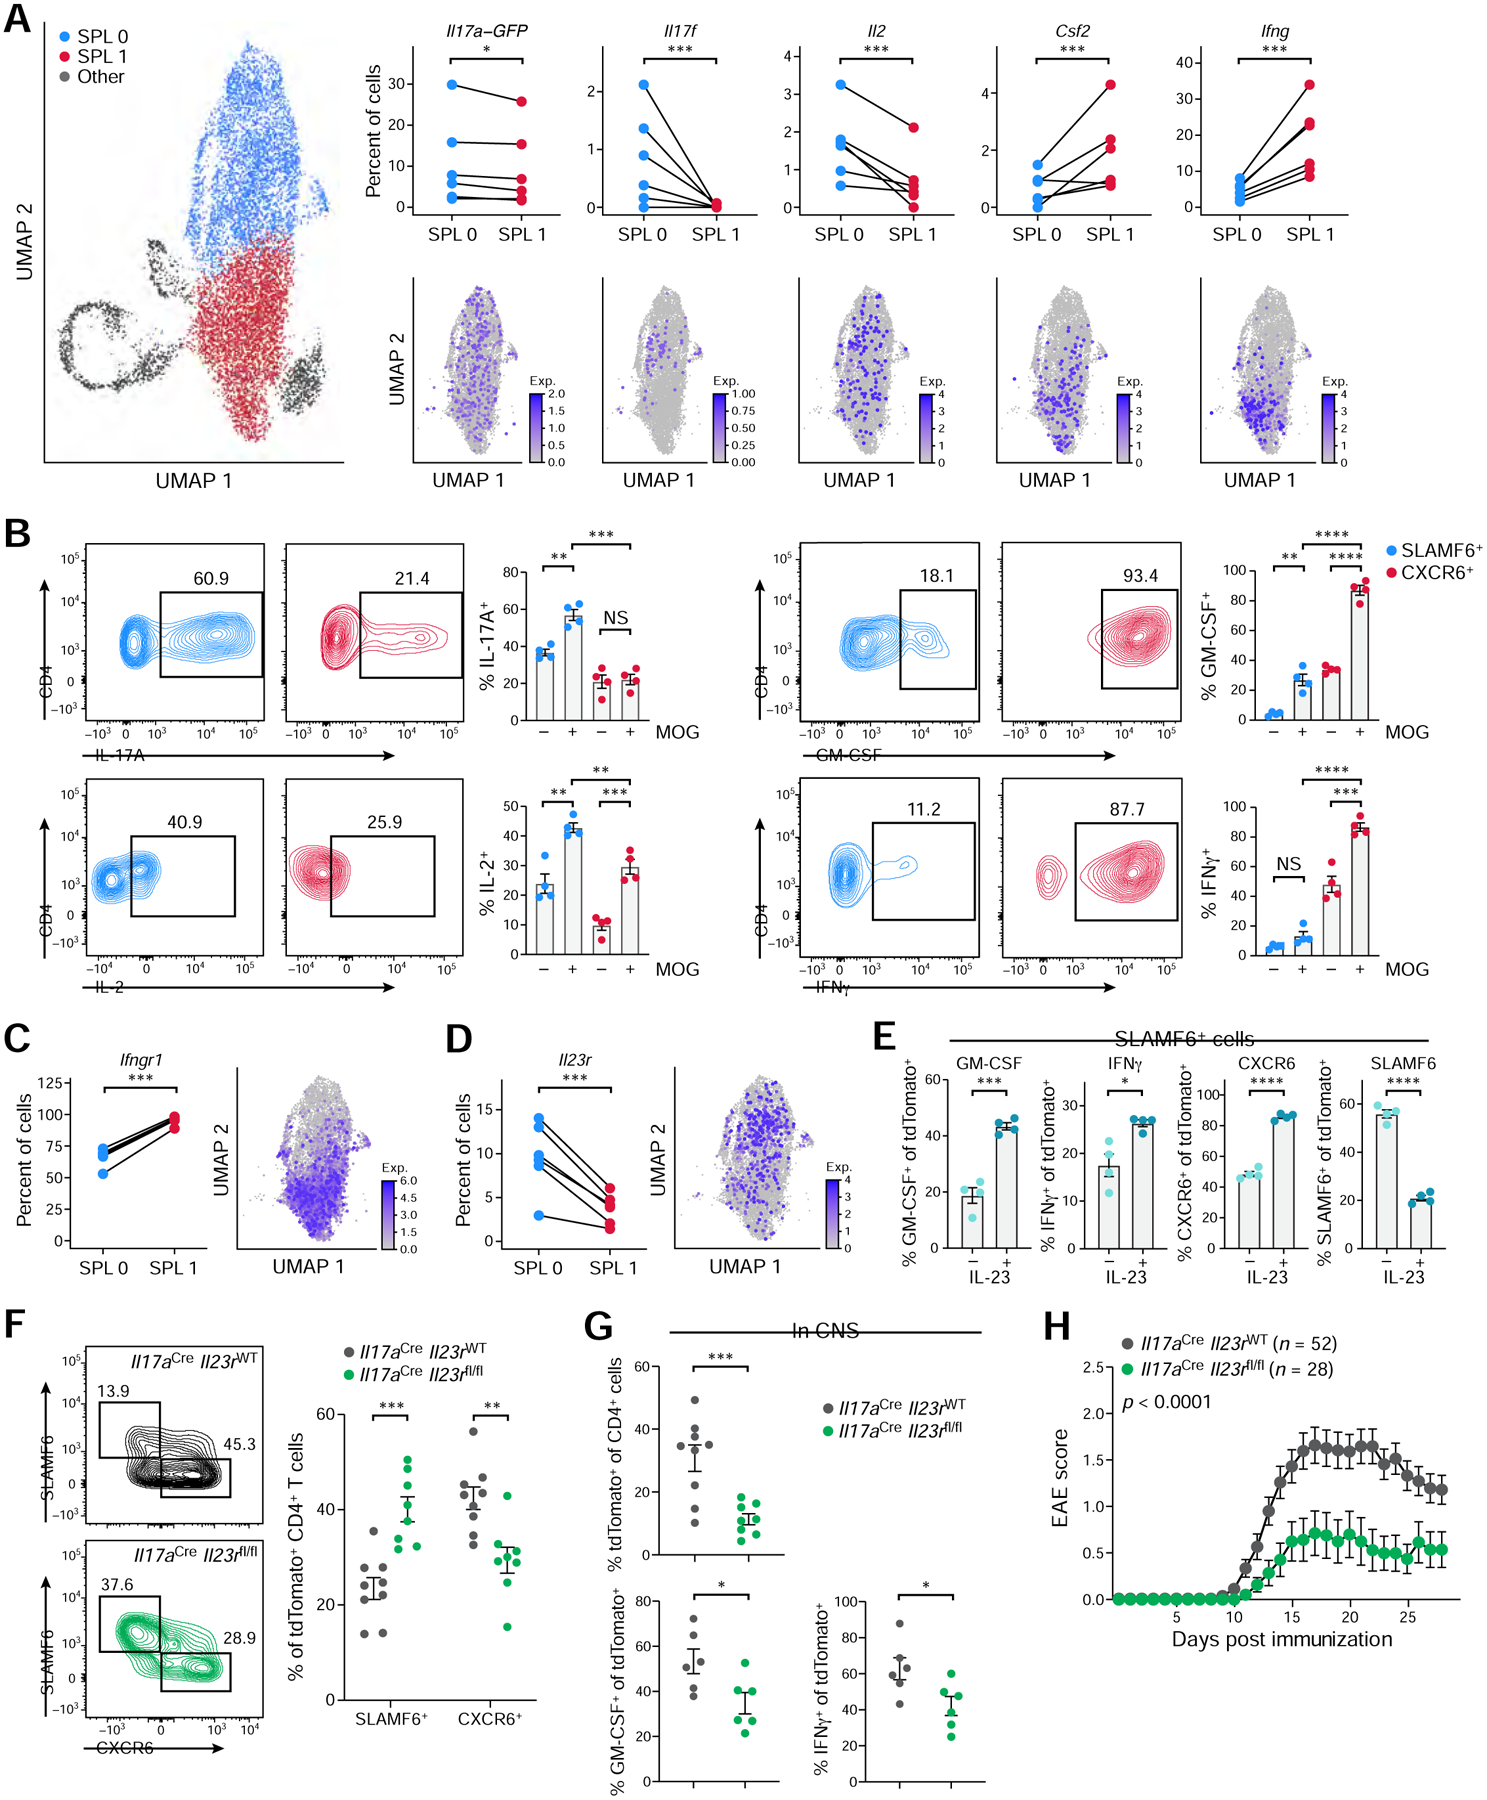
While intestinal Th17 cells are critical for maintaining tissue homeostasis, recent studies have implicated their roles in the development of extra-intestinal autoimmune diseases including multiple sclerosis. However, the mechanisms by which tissue Th17 cells mediate these dichotomous functions remain unknown. Here, we characterized the heterogeneity, plasticity, and migratory phenotypes of tissue Th17 cells in vivo by combined fate mapping with profiling of the transcriptomes and TCR clonotypes of over 84,000 Th17 cells at homeostasis and during CNS autoimmune inflammation. Inter- and intra-organ single-cell analyses revealed a homeostatic, stem-like TCF1+ IL-17+ SLAMF6+ population that traffics to the intestine where it is maintained by the microbiota, providing a ready reservoir for the IL-23-driven generation of encephalitogenic GM-CSF+ IFN-γ+ CXCR6+ T cells. Our study defines a direct in vivo relationship between IL-17+ non-pathogenic and GM-CSF+ and IFN-γ+ pathogenic Th17 populations and provides a mechanism by which homeostatic intestinal Th17 cells direct extra-intestinal autoimmune disease.

Keywords: CNS inflammation; GM-CSF; IFNγ; IL-17; Th17 cells; autoimmunity; fate-mapping; gut-brain axis; multiple sclerosis; stem-like T cells.


Conflict of interest statement

Declaration of interests A.R. was a SAB member of Thermo Fisher Scientific, Neogene Therapeutics, Asimov, and Syros Pharmaceuticals. A.R. is a cofounder of and equity holder in Celsius Therapeutics and an equity holder in Immunitas. V.K.K. is a co-founder and has an ownership interest and is a member of SAB in Celsius Therapeutics, Tizona Therapeutics, and Trishula Therapeutics. V.K.K. is also the chair of the board and has equity interests in Bicara Therpeutics. V.K.K.’s financial interests and conflicts are managed by Brigham and Women’s Hospital and Partners Health Care system. A.R. and O.R.-R. are employees of Genentech (member of the Roche Group) since August and October 2020, respectively. None of these companies provided support for this work. A.R. was an HHMI Investigator while this study was conducted. A. Schnell, M.S., A.R., and V.K.K. are co-inventors on US provisional patent application no. 17/063,617 and no. 62/968,981 filed by the Broad Institute relating to the subject matter of this manuscript. O.R.-R. is a co-inventor on patent applications filed by the Broad Institute relating to single-cell genomics. All other authors declare no competing interests.

Figures

Figure 1:
Figure 1:. Single-cell RNA sequencing identifies tissue-specific Th17 signatures
(A) Experimental workflow. (B, C) Frequencies of tdTomato+ cells (B) or IL-17A-GFP+ and IL-17A-GFP cells (C) in tissues profiled (n=5–7). Statistical significance determined from comparison to spleen. (D, E) UMAP of all current Th17 cells (GFP+) at homeostasis. Colored by tissue of origin (D) or transcript expression (log2(CP10k + 1)) of Foxp3 and Mki67 (E). (F) Up- and down-regulated genes (FDR <0.05, fold change ≥1.5) in tissue vs. splenic current Th17 cells. Columns represent batches. Small multi-tissue gene sets (<20 genes) not shown. (G) Selected GO terms from gene set enrichment analysis of tissue vs. splenic current Th17 cells. Only positively enriched results were shown. (H) Selected Th17 effector genes in the tissues at homeostasis. See also Figures S1 and S2, and Tables S1 and S2.
Figure 2:
Figure 2:. Intra-tissue heterogeneity of tissue Th17 cells revealed with single-cell analysis
(A) UMAP visualization of all current (GFP+) and ex-Th17 cells (GFP) at homeostasis, colored by cluster assignment (top row), cluster function annotation (middle row), and Th17 status (bottom row). (B) Correlation of transcriptomic landscape for all pairs of intra-tissue clusters. (C) Expression of selected genes used to define the intra-tissue cluster functional annotations. (D) Frequency of Foxp3GFP+ of tdTomato+ cells by flow cytometry in each tissue (top, n=3–5). Representative flow cytometry plot of the colonic population (bottom). (E) TCR repertoire similarity analysis across the colon tissue clusters. The two proliferating clusters (COL5 and COL6) were combined in this analysis. (F) Clonotype sharing across colon clusters. All clonotypes (rows) found in at least two colon clusters (columns) were included. (G) Percentage of Treg-like (cluster COL2) and non-Treg colonic tdTomato+ cells (all other clusters) that share their TCR sequences with splenic tdTomato+ cells (n=4). See also Figure S3 and Table S3.
Figure 3:
Figure 3:. Identification of functionally distinct encephalitogenic Th17 cell subpopulations
(A) Schematic of the experimental setup. (B) UMAP representation of unsupervised clustering of current (GFP+) and ex-Th17 cells (GFP) from the CNS of EAE mice at disease onset. (C) Cell numbers and relative frequencies of each cluster. (D) Relative expression of genes uniquely up-regulated in each cluster (Wilcoxon rank-sum test; FDR <0.05, fold change ≥1.5). Data are shown for a random sample of 1,000 cells. (E) Expression of a selected set of cluster markers. Extreme expression values (<0.5 or >99.5 percentiles) were excluded and points were shown for randomly selected 20% of the cells. (F) Selected GO terms and KEGG pathways from cluster-specific gene set enrichment analysis. Only positively enriched results were shown. (G) CD8α expression by flow cytometry on viable TCRβ+ CD4+ tdTomato+ CNS cells (n=8). Quantification (left) and a representative flow cytometry plot (right). (H) qPCR gene expression analysis of cluster 3 marker genes comparing CD8α to CD8α+ tdTomato+ CNS cells (n=4). RE = Relative expression. (I) Clonal expansion for each CNS cluster. Size of a pie slice represents the proportion of cells that belong to clones of the color-indicated size computed within each cluster. Number of cells is shown on the top. Clonal expansion scores for clusters (0–4) are 0.04, 0.07, 0.03, 0.03 and 0.13, respectively. (J) PD-1 expression by flow cytometry on viable TCRβ+ CD4+ tdTomato+ CNS cells (n=8). Quantification (left) and a representative flow cytometry plot (right). (K) Effector cytokine expression by flow cytometry in PD-1 and PD-1+ tdTomato+ CNS cells (n=8). Paired two-tailed t-tests were performed. See also Figure S4 and Table S1.
Figure 4:
Figure 4:. Single-cell profiling of tissue Th17 cells during EAE
(A,B) UMAP of all current (GFP+) and ex-Th17 cells (GFP) from naïve and EAE-diseased mice. Cells are colored by tissue origin (A) or by treatment condition (B). (C) UMAP of all splenic Th17 cells. Cells are colored by treatment condition. (D) MA plot of differentially expressed genes comparing EAE vs. naïve splenic Th17 cells (FDR <0.05 and fold change ≥1.5). (E) Th17 clonotype sharing across tissues during EAE. Tissue-specific or small (<10 cells) clonotypes were excluded. (F) Tissue-level TCR repertoire similarity analysis for Th17 cells during EAE. See also Figure S4 and Table S3.
Figure 5:
Figure 5:. Discovery of a homeostatic and a pathogenic Th17 population in the spleen
(A) UMAP of all splenic current (GFP+) and ex-Th17 cells (GFP) during EAE. (B) Relative expression of selected homeostatic and pathogenic genes that are differentially expressed (FDR <0.05) between SPL0 and SPL1. (C) Gene set enrichment analysis of published Th17 pathway signatures (Lee et al., 2012, Gaublomme et al., 2015) in SPL1 vs. SPL0. (D) Clonal expansion of SPL0 and SPL1 cells in each mouse. The number of cells is shown above. Clonal expansion scores are 0.018, 0.026, 0.016, and 0.022 for each mouse (1–4) in SPL0, and 0.071, 0.116, 0.024, and 0.080 in SPL1. (E) MA plot of differentially expressed genes between SPL1 and SPL0 (FDR <0.05, fold change ≥1.5). (F) Overlay of the bulk RNA-seq derived CXCR6+ and SLAMF6+ gene signatures (Table S4) on the splenic UMAP. (G) Frequency of the CXCR6+ and SLAMF6+ spleen populations in naïve and EAE-diseased mice analyzed by flow cytometry (n=4). Representative flow cytometry plots (left) and quantification (right). (H) Frequencies (left) and number (right) of SLAMF6+ and CXCR6+ cells in the spleen (top) and CNS (bottom) over the EAE disease time-course (n=3–4). CNS cells were sampled starting at day 8. (I, J) ATAC-seq of the SLAMF6+ and CXCR6+ populations. (I) Scatter plot of samples based on the top two PCs. (J) Normalized chromatin accessibility for a selected list of genes from the bulk RNA-seq derived SLAMF6+ and CXCR6+ gene signatures. See also Figure S5 and Table S4.
Figure 6:
Figure 6:. The homeostatic and pathogenic splenic Th17 populations display distinct migratory behavior in vivo
(A) UMAP of the SPL0 and SPL1 cells colored by TCR sharing (pink) or not sharing (green) with Th17 cells in the CNS. (B) TCR repertoire similarity analysis of SPL0 and SPL1 with cells in all other tissues. (C) Relative expression of selected genes involved in immune cell trafficking that are differentially expressed (FDR <0.05) in clusters SPL0 and SPL1. (D) TCR repertoire similarity analysis of intra-tissue clusters at homeostasis (left) and during EAE (right). Clusters were defined as in Figure 2A and Figure S6B. (E) Cell numbers of tdTomato+ cells in each tissue following SLAMF6+ or CXCR6+ tdTomato+ cell transfer into EAE-bearing recipients (n=5). Two-tailed Mann Whitney test was performed. (F) Number of cells in SPL0 and SPL1 whose TCRs were not shared (left) or shared (right) with the other cluster. Proportions are annotated on the top. Clonal expansion scores are 0.01 and 0.05 for not shared and shared clones in SPL0, and 0.03 and 0.10 in SPL1. (G) SLAMF6 and CXCR6 expression on transferred tdTomato+ cells in the spleen. SLAMF6+ or CXCR6+ tdTomato+ cells were transferred into EAE-bearing recipient mice and spleens were harvested 7 days post transfer (n=11). Representative flow cytometry plots (left) and quantification (right) are shown. (H) Frequencies of photoconverted KaedeRed+ CXCR6+ cells in the spleen (top) and CNS (bottom) of EAE-bearing mice 48 h after photoconversion of intestinal cells (n=4–5). See also Figures S6 and S7.
Figure 7:
Figure 7:. IL-23R signaling is driving the generation of GM-CSF+ IFNγ+ CXCR6+ cells from IL-17+ SLAMF6+ cells
(A) Cytokine expression in SPL0 and SPL1 clusters. Percent of cells with UMI count ≥1 by sample (top, n=6) and normalized expression on the UMAP (bottom). (B) Cytokine expression in SLAMF6+ and CXCR6+ cells during recall assay with or without MOG peptide (n=4). Representative flow cytometry plots (left) and quantification (right). (C-D) Ifngr1 (C) and Il23r (D) expression in SPL0 and SPL1 clusters. Percent of cells with UMI count ≥1 by sample (left, n=6) and normalized expression on the UMAP (right). (E) Phenotype of the SLAMF6+ population co-cultured for 3 days with CD4-deplected splenocytes with or without IL-23 by flow cytometry (n=4). (F) Frequencies of splenic SLAMF6+ and CXCR6+ tdTomato+ CD4+ T cells in immunized Il17aCreIl23rWT and Il17aCreIl23rfl/fl mice analyzed at EAE onset (n=8–9). Representative flow cytometry plots (left) and quantification (right) are shown. (G) tdTomato+ CD4+ T cell frequencies (top) and GM-CSF- and IFNγ- expression (bottom) in the CNS of immunized Il17aCreIl23rWT and Il17aCreIl23rfl/fl mice at disease onset (n=6–9). (H) EAE disease curve in Il17aCreIl23rWT (n=52) and Il17aCreIl23rfl/fl (n=28) mice. Data are mean from four independent experiments. See also Figure S7 and Table S5.

Comment in

References

    1. ARAZI A, RAO DA, BERTHIER CC, DAVIDSON A, LIU Y, HOOVER PJ, CHICOINE A, EISENHAURE TM, JONSSON AH, LI S, LIEB DJ, ZHANG F, SLOWIKOWSKI K, BROWNE EP, NOMA A, SUTHERBY D, STEELMAN S, SMILEK DE, TOSTA P, APRUZZESE W, MASSAROTTI E, DALL’ERA M, PARK M, KAMEN DL, FURIE RA, PAYAN-SCHOBER F, PENDERGRAFT WF 3RD, MCINNIS EA, BUYON JP, PETRI MA, PUTTERMAN C, KALUNIAN KC, WOODLE ES, LEDERER JA, HILDEMAN DA, NUSBAUM C, RAYCHAUDHURI S, KRETZLER M, ANOLIK JH, BRENNER MB, WOFSY D, HACOHEN N, DIAMOND B & ACCELERATING MEDICINES PARTNERSHIP IN, S. L. E. N. 2019. The immune cell landscape in kidneys of patients with lupus nephritis. Nat Immunol, 20, 902–914. - PMC - PubMed
    1. BEDOYA SK, LAM B, LAU K & LARKIN J 3RD 2013. Th17 cells in immunity and autoimmunity. Clin Dev Immunol, 2013, 986789. - PMC - PubMed
    1. BERER K, GERDES LA, CEKANAVICIUTE E, JIA X, XIAO L, XIA Z, LIU C, KLOTZ L, STAUFFER U, BARANZINI SE, KUMPFEL T, HOHLFELD R, KRISHNAMOORTHY G & WEKERLE H 2017. Gut microbiota from multiple sclerosis patients enables spontaneous autoimmune encephalomyelitis in mice. Proc Natl Acad Sci U S A, 114, 10719–10724. - PMC - PubMed
    1. BERER K, MUES M, KOUTROLOS M, RASBI ZA, BOZIKI M, JOHNER C, WEKERLE H & KRISHNAMOORTHY G 2011. Commensal microbiota and myelin autoantigen cooperate to trigger autoimmune demyelination. Nature, 479, 538–41. - PubMed
    1. BETTELLI E, CARRIER Y, GAO W, KORN T, STROM TB, OUKKA M, WEINER HL & KUCHROO VK 2006. Reciprocal developmental pathways for the generation of pathogenic effector TH17 and regulatory T cells. Nature, 441, 235–8. - PubMed

Publication types

MeSH terms