

Spatial patterns of brain lesions assessed through covariance estimations of lesional voxels in multiple Sclerosis: The SPACE-MS technique
- PMID: 34875458
- PMCID: PMC8654632
- DOI: 10.1016/j.nicl.2021.102904
Spatial patterns of brain lesions assessed through covariance estimations of lesional voxels in multiple Sclerosis: The SPACE-MS technique
Abstract
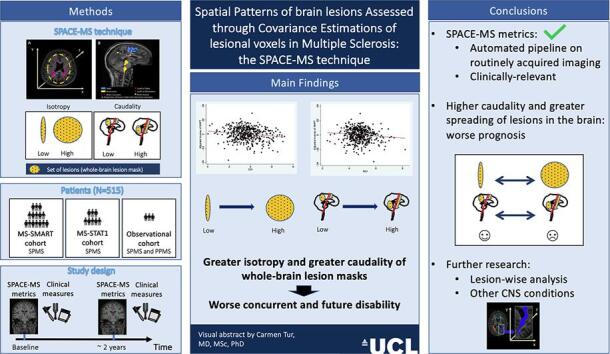
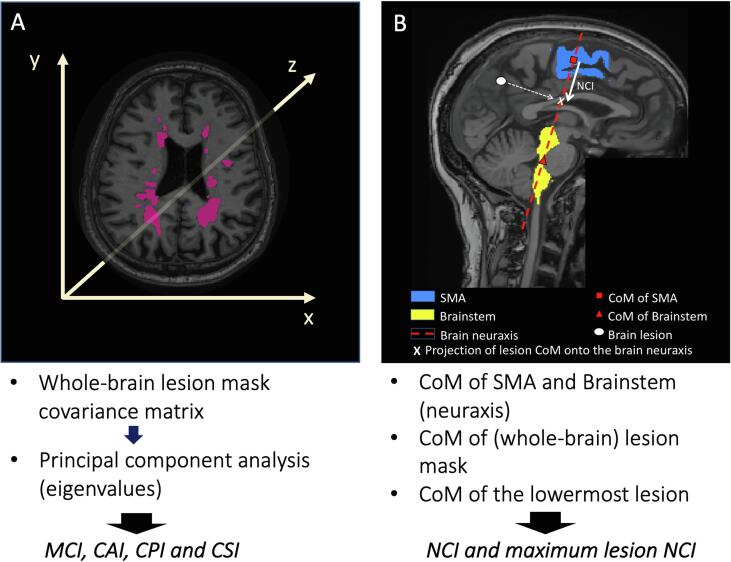
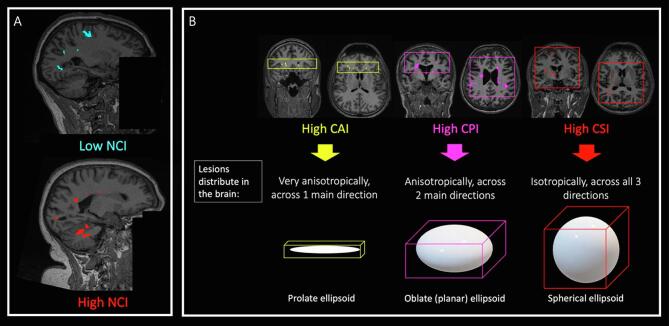
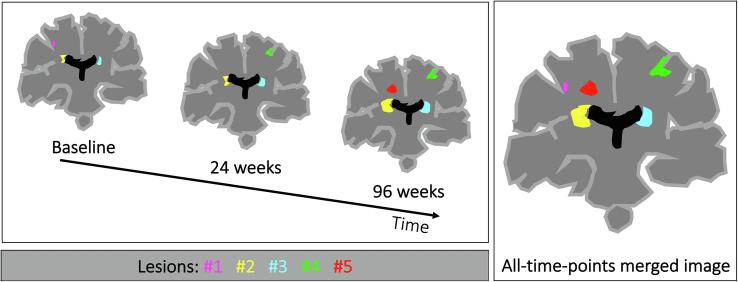
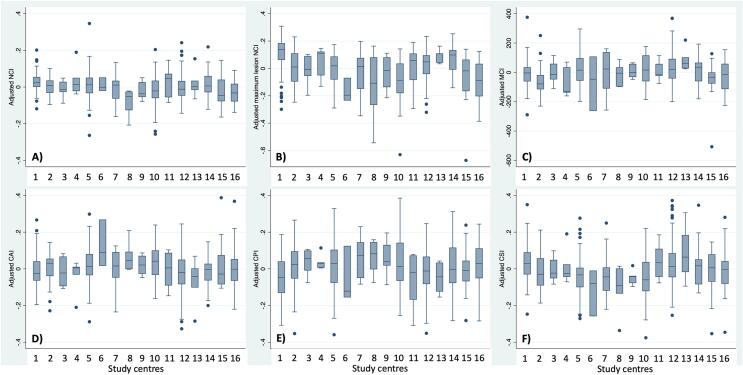
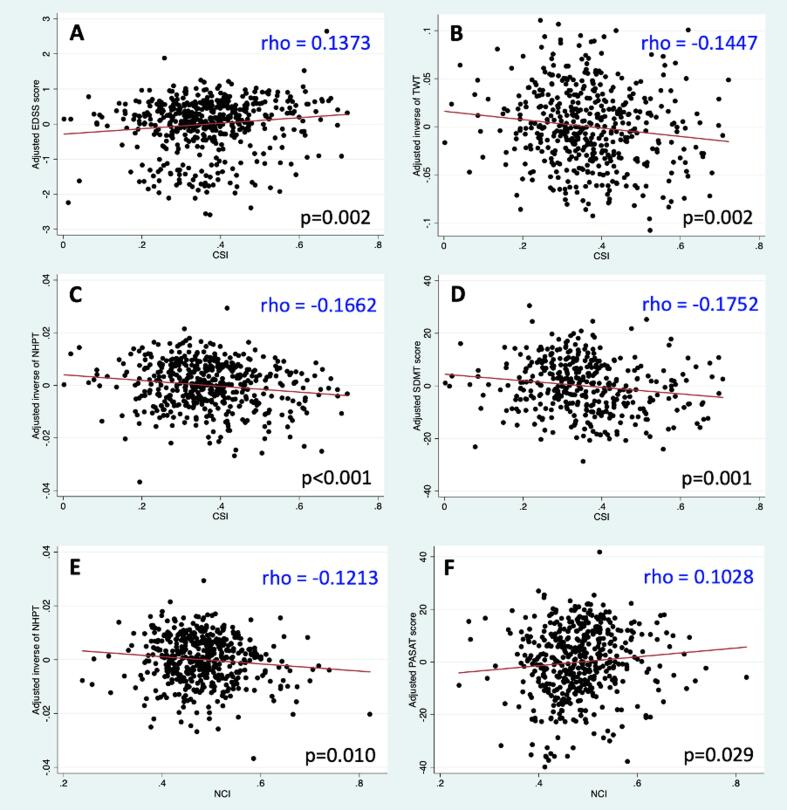
Predicting disability in progressive multiple sclerosis (MS) is extremely challenging. Although there is some evidence that the spatial distribution of white matter (WM) lesions may play a role in disability accumulation, the lack of well-established quantitative metrics that characterise these aspects of MS pathology makes it difficult to assess their relevance for clinical progression. This study introduces a novel approach, called SPACE-MS, to quantitatively characterise spatial distributional features of brain MS lesions, so that these can be assessed as predictors of disability accumulation. In SPACE-MS, the covariance matrix of the spatial positions of each patient's lesional voxels is computed and its eigenvalues extracted. These are combined to derive rotationally-invariant metrics known to be common and robust descriptors of ellipsoid shape such as anisotropy, planarity and sphericity. Additionally, SPACE-MS metrics include a neuraxis caudality index, which we defined for the whole-brain lesion mask as well as for the most caudal brain lesion. These indicate how distant from the supplementary motor cortex (along the neuraxis) the whole-brain mask or the most caudal brain lesions are. We applied SPACE-MS to data from 515 patients involved in three studies: the MS-SMART (NCT01910259) and MS-STAT1 (NCT00647348) secondary progressive MS trials, and an observational study of primary and secondary progressive MS. Patients were assessed on motor and cognitive disability scales and underwent structural brain MRI (1.5/3.0 T), at baseline and after 2 years. The MRI protocol included 3DT1-weighted (1x1x1mm3) and 2DT2-weighted (1x1x3mm3) anatomical imaging. WM lesions were semiautomatically segmented on the T2-weighted scans, deriving whole-brain lesion masks. After co-registering the masks to the T1 images, SPACE-MS metrics were calculated and analysed through a series of multiple linear regression models, which were built to assess the ability of spatial distributional metrics to explain concurrent and future disability after adjusting for confounders. Patients whose WM lesions laid more caudally along the neuraxis or were more isotropically distributed in the brain (i.e. with whole-brain lesion masks displaying a high sphericity index) at baseline had greater motor and/or cognitive disability at baseline and over time, independently of brain lesion load and atrophy measures. In conclusion, here we introduced the SPACE-MS approach, which we showed is able to capture clinically relevant spatial distributional features of MS lesions independently of the sheer amount of lesions and brain tissue loss. Location of lesions in lower parts of the brain, where neurite density is particularly high, such as in the cerebellum and brainstem, and greater spatial spreading of lesions (i.e. more isotropic whole-brain lesion masks), possibly reflecting a higher number of WM tracts involved, are associated with clinical deterioration in progressive MS. The usefulness of the SPACE-MS approach, here demonstrated in MS, may be explored in other conditions also characterised by the presence of brain WM lesions.
Keywords: Anisotropy; Caudality; Lesion spatial distribution; Magnetic resonance imaging; Multiple sclerosis; SPACE-MS.
Copyright © 2021 The Authors. Published by Elsevier Inc. All rights reserved.
Conflict of interest statement
The authors declare that they have no known competing financial interests or personal relationships that could have appeared to influence the work reported in this paper.
Figures
References
-
- Cannerfelt B., Nystedt J., Jönsen A., et al. White matter lesions and brain atrophy in systemic lupus erythematosus patients: correlation to cognitive dysfunction in a cohort of systemic lupus erythematosus patients using different definition models for neuropsychiatric systemic lupus erythematosus. Lupus [online serial]. 2018;27:1140–1149. http://journals.sagepub.com/doi/10.1177/0961203318763533 Accessed at: - DOI - PubMed
-
- Pantoni L. Cerebral small vessel disease: from pathogenesis and clinical characteristics to therapeutic challenges. Lancet Neurol. [online serial] 2010;9:689–701. https://linkinghub.elsevier.com/retrieve/pii/S1474442210701046 Accessed at: - PubMed
-
- Thompson A.J., Baranzini S.E., Geurts J., Hemmer B., Ciccarelli O. Multiple sclerosis. Lancet [online serial] 2018;391:1622–1636. https://linkinghub.elsevier.com/retrieve/pii/S0140673618304811 Accessed at: - PubMed
-
- Tintore M., Rovira À., Río J., et al. Defining high, medium and low impact prognostic factors for developing multiple sclerosis. Brain [online serial] 2015;138:1863–1874. https://academic.oup.com/brain/article-lookup/doi/10.1093/brain/awv105 Accessed at: - DOI - PubMed
-
- Fisniku L.K., Brex P.A., Altmann D.R., et al. Disability and T2 MRI lesions: a 20-year follow-up of patients with relapse onset of multiple sclerosis. Brain [online serial] 2008;131:808–817. https://academic.oup.com/brain/article-lookup/doi/10.1093/brain/awm329 Accessed at: - DOI - PubMed
Publication types
MeSH terms
Grants and funding
LinkOut - more resources
Full Text Sources
Medical
Research Materials
Miscellaneous
