. 2022 Feb;602(7895):148-155.
doi: 10.1038/s41586-021-04280-x. Epub 2021 Dec 7.

Signature of long-lived memory CD8+ T cells in acute SARS-CoV-2 infection

Affiliations

Signature of long-lived memory CD8+ T cells in acute SARS-CoV-2 infection

Sarah Adamo et al. Nature. 2022 Feb.

Abstract

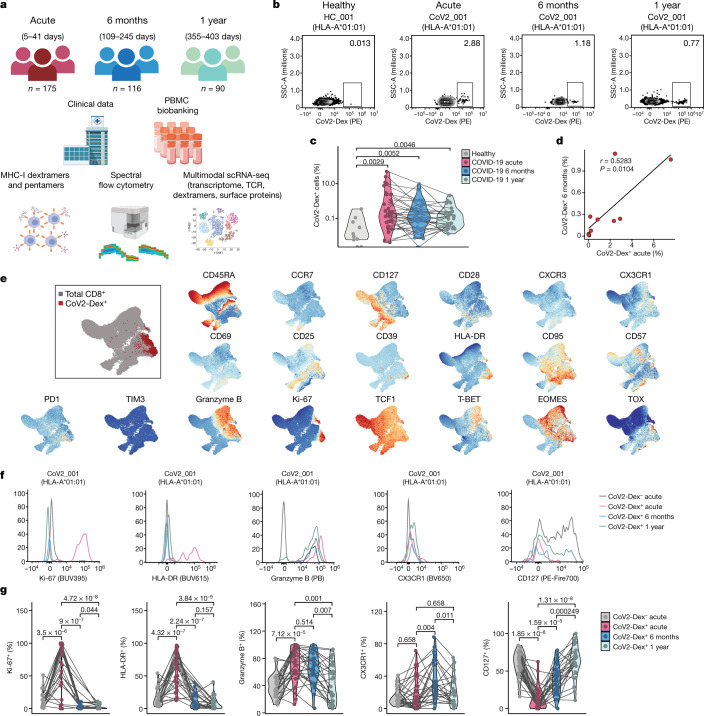
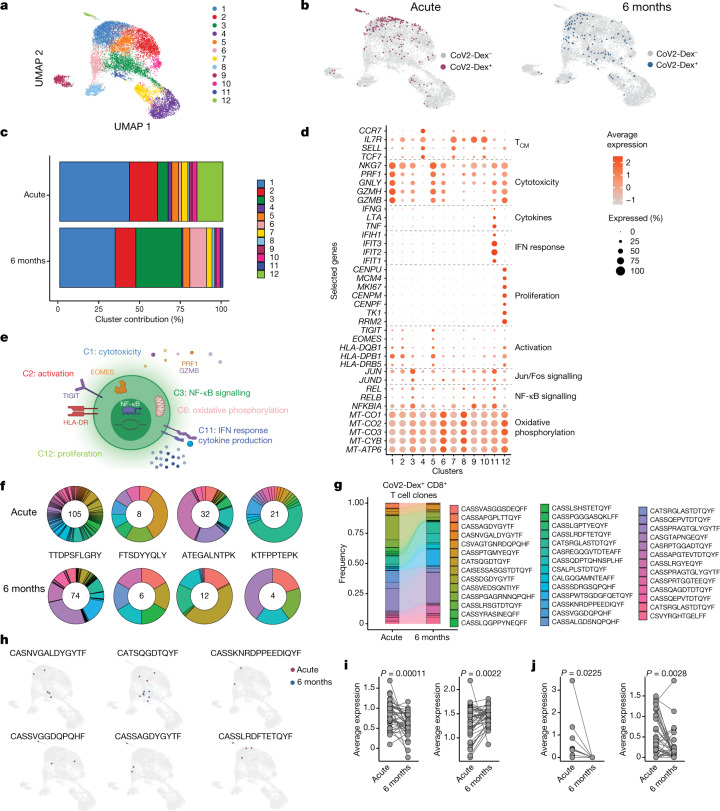
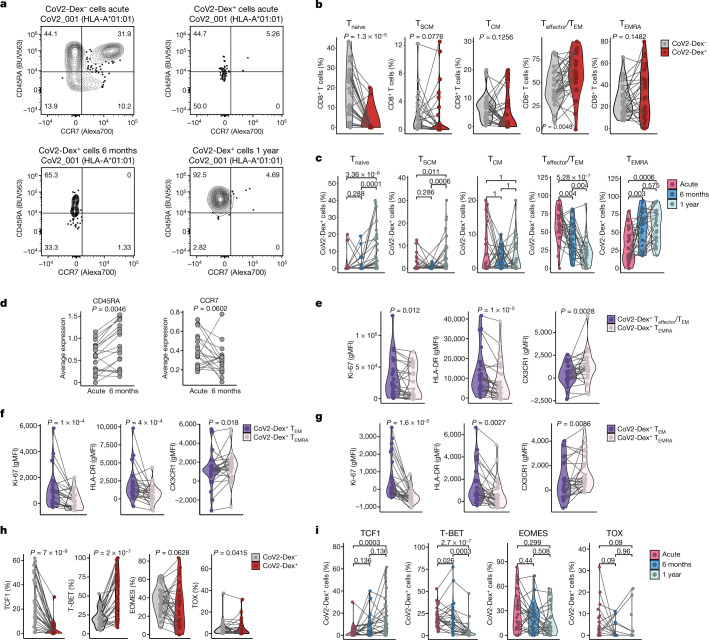
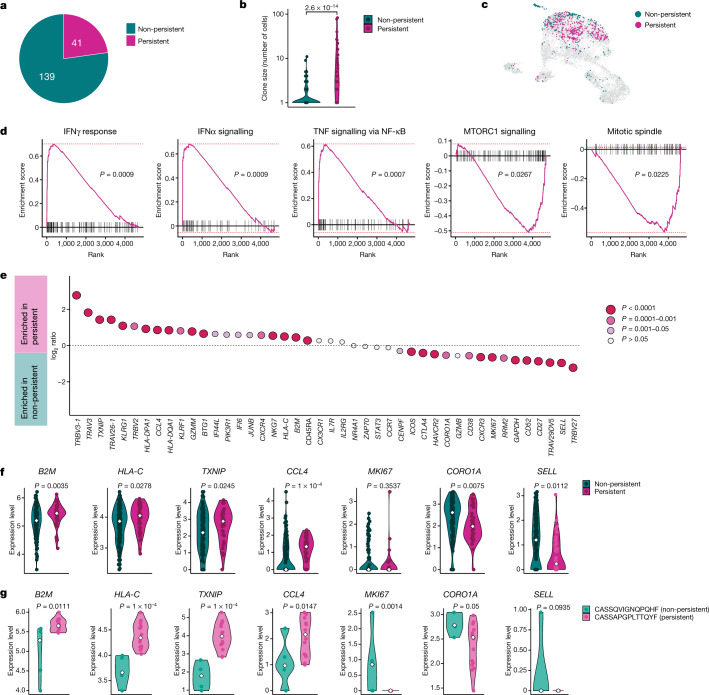
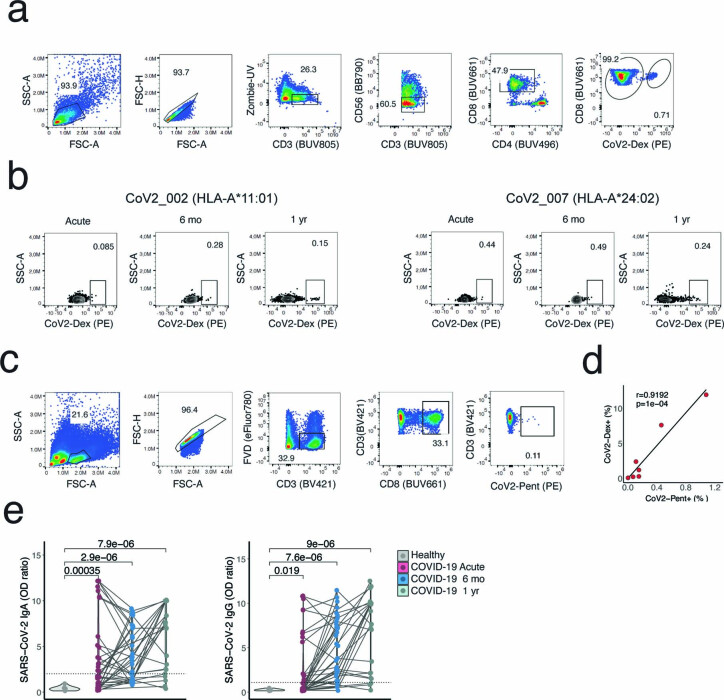
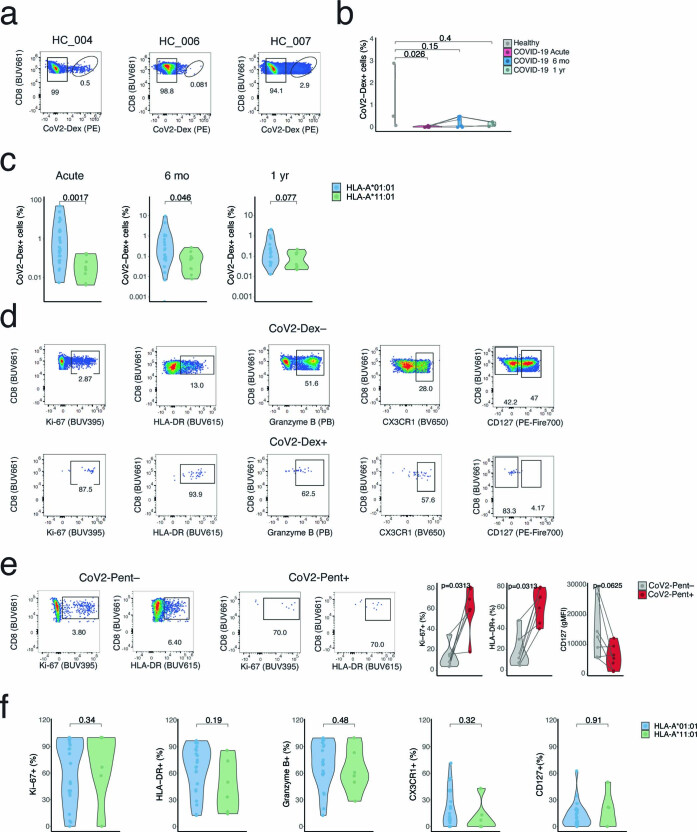
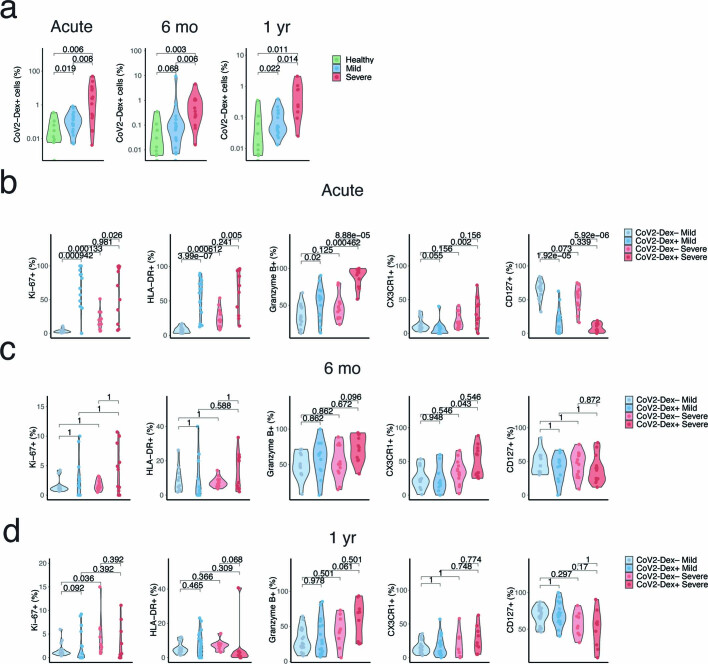
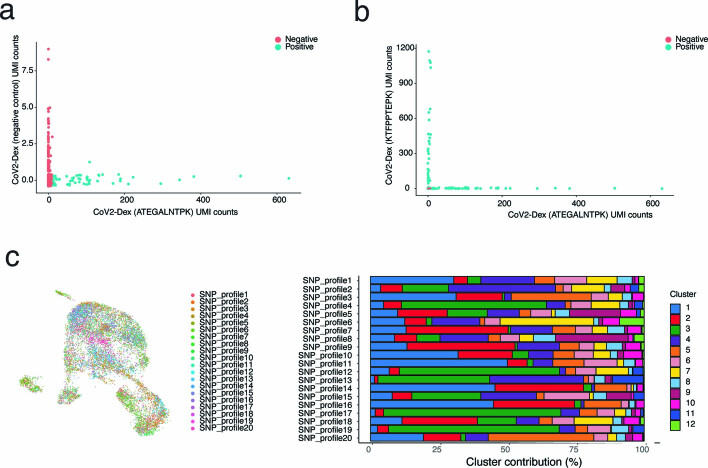
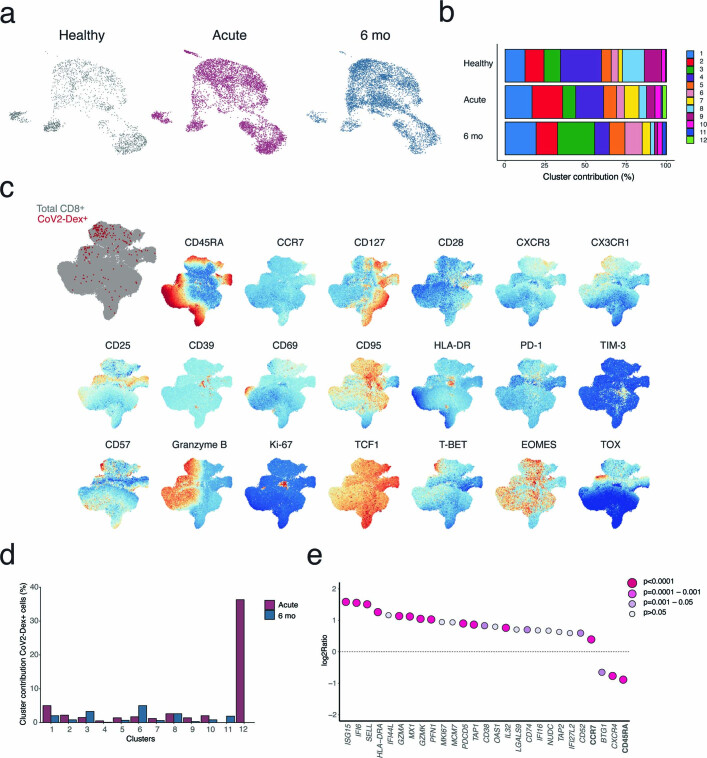
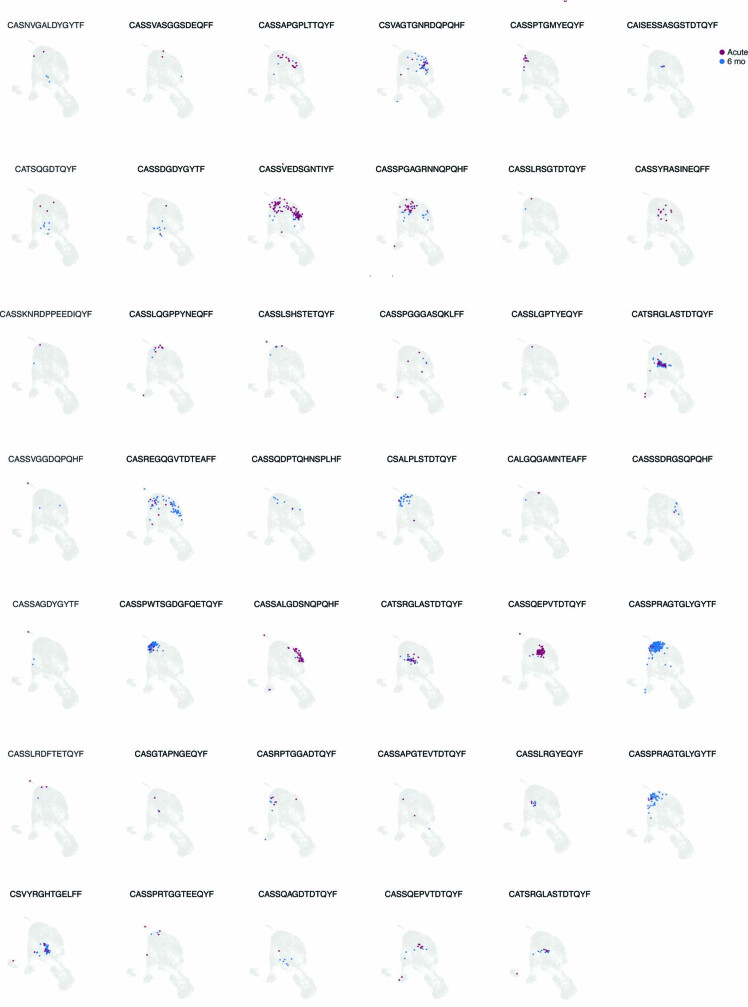
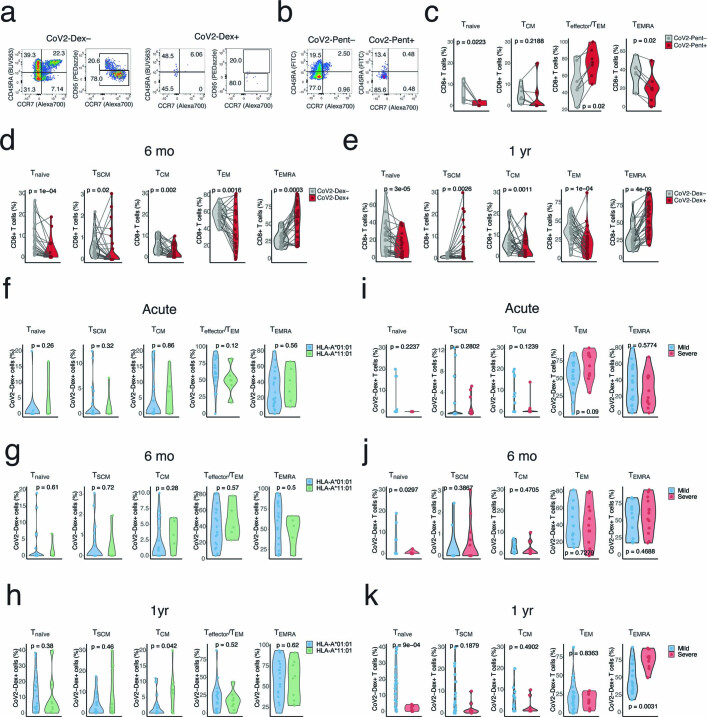
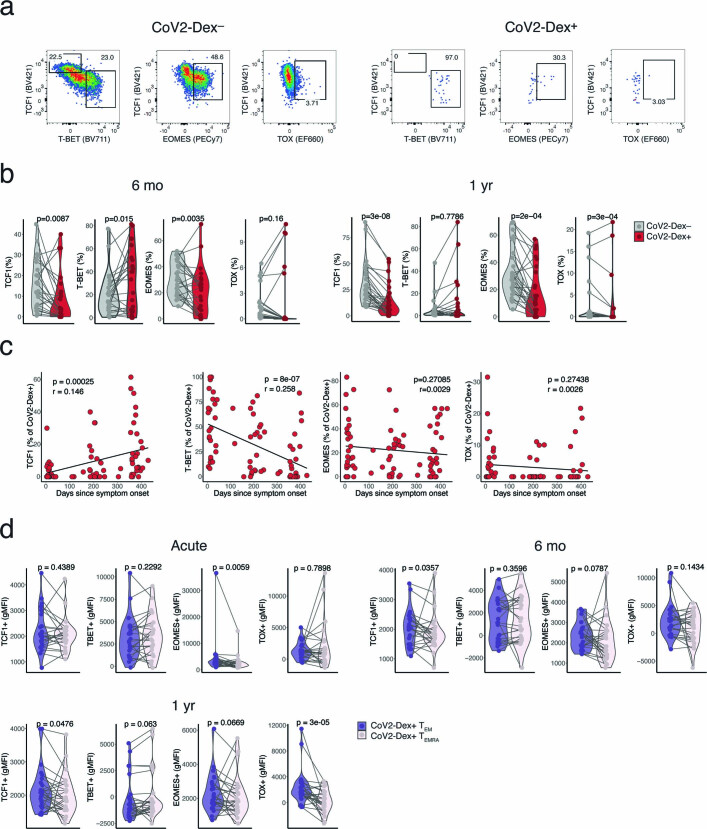
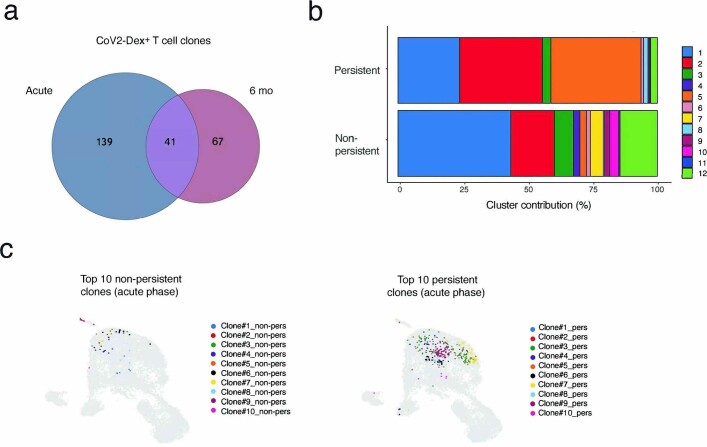
Immunological memory is a hallmark of adaptive immunity and facilitates an accelerated and enhanced immune response upon re-infection with the same pathogen1,2. Since the outbreak of the ongoing COVID-19 pandemic, a key question has focused on which SARS-CoV-2-specific T cells stimulated during acute infection give rise to long-lived memory T cells3. Here, using spectral flow cytometry combined with cellular indexing of transcriptomes and T cell receptor sequencing, we longitudinally characterized individual SARS-CoV-2-specific CD8+ T cells of patients with COVID-19 from acute infection to 1 year into recovery and found a distinct signature identifying long-lived memory CD8+ T cells. SARS-CoV-2-specific memory CD8+ T cells persisting 1 year after acute infection express CD45RA, IL-7 receptor-α and T cell factor 1, but they maintain low expression of CCR7, thus resembling CD45RA+ effector memory T cells. Tracking individual clones of SARS-CoV-2-specific CD8+ T cells, we reveal that an interferon signature marks clones that give rise to long-lived cells, whereas prolonged proliferation and mechanistic target of rapamycin signalling are associated with clonal disappearance from the blood. Collectively, we describe a transcriptional signature that marks long-lived, circulating human memory CD8+ T cells following an acute viral infection.


Conflict of interest statement

The authors declare no competing interests.

Figures

Fig. 1
Fig. 1. Characteristics of antigen-specific CD8+ T cells during acute and memory phases of SARS-CoV-2 infection.
a, Overview of study design. PBMC, peripheral blood mononuclear cell. b, Representative plots of CoV2-Dex staining. PE, Phycoerythrin. Numbers in the plots indicate percentage of parent population. c, Frequency of CoV2-Dex+ cells in healthy donors and patients with COVID-19 during acute infection and 6 months and 1 year after infection. Each dot represents an independent donor at the indicated timepoint (n = 10 healthy, n = 37 acute, n = 32 6 months, n = 29 1 year after infection). P values are shown. d, Linear regression of frequency of CoV2-Dex+ cells 6 months after infection as a function of CoV2-Dex+ cell frequencies during acute infection (n = 11). The P value was calculated with t-statistic. e, Uniform manifold approximation and projection (UMAP) plots of marker expression for up to 2,000 CD8+ T cells from each sample collected during acute infection (n = 37) analysed by spectral flow cytometry. Regions with high marker expression appear in red. An overlay of CoV2-Dex+ cells (red) and total CD8+ T cells (grey) is shown in the top left. f, Representative histograms showing expression of selected markers on CoV2-Dex and CoV2-Dex+ cells. g, Frequency of Ki-67+, HLA-DR+, granzyme B+, CX3CR1+ and CD127+ cells in CoV2-Dex (grey) and CoV2-Dex+ cells during acute infection and 6 months and 1 year after infection. Analysis was conducted on paired samples from acute infection versus 6 months and/or 1 year after infection (n = 28 acute, n = 24 6 months, n = 29 1 year). The grey lines connect individual donors sampled at different timepoints. P values were calculated using a Wilcoxon–Mann–Whitney test in c and g and corrected for multiple comparisons in g. All tests were performed two-sided.
Fig. 2
Fig. 2. Transcriptional makeup of SARS-CoV-2-specific CD8+ T cell clones.
a, Single-cell transcriptomes of CD8+ T cells displayed by UMAP. Seurat-based clustering of 14,853 cells, coloured based on cluster ID. b, UMAP as in a; CoV2-Dex+ cells from the acute infection (red) and 6 months after infection (blue) are highlighted. c, Cluster composition of CoV2-Dex+CD8+ T cells in acute infection versus 6 months after infection. d, Average expression (colour scale) and the percentage of expressing cells (size scale) of selected genes in indicated clusters. e, Schematic summary of the main clusters differentially represented in acute infection and 6 months after infection. f, Clonotype distribution in CoV2-Dex+ T cell clones (at least one CoV2-Dex+ cell per clone) for each of the four epitopes assessed. The number of T cell clones specific for the indicated epitopes at acute infection (top) and 6 months after infection (bottom) is provided within the circle. g, Alluvial plot showing relative representation of single clones present during acute infection and 6 months after infection (n = 41). h, UMAP as in a; cells from individual CoV2-Dex+CD8+ T cell clones in acute infection (red) and 6 months after infection (blue) are highlighted. i, Gene signature scores of individual CD8+ T cell clones in acute infection (acute gene signature, left) versus 6 months after infection (recovery gene signature, right) (n = 41). j, Expression of MKI67 (left) and HLA-DRB5 (right) in individual CD8+ T cell clones in acute infection versus 6 months after infection (n = 41). P values were calculated using a Wilcoxon signed-rank test in i and j.
Fig. 3
Fig. 3. Transition of antigen-specific CD8+ T cells to TCF1+CD45RA+ effector memory cells at 1 year.
a, Representative plots of CD45RA and CCR7 staining on CoV2-Dex and CoV2-Dex+ cells during acute infection and 6 months and 1 year after infection. Numbers in the plots indicate percentage of parent population. b, Percentages of Tnaive, TSCM, TCM, Teffector/TEM and TEMRA cells in CoV2-Dex and CoV2-Dex+ cells during acute infection (n = 28). c, Percentages of Tnaive, TSCM, TCM, Teffector/TEM and TEMRA CoV2-Dex+ cells in acute infection and 6 months and 1 year after infection (n = 28 acute, n = 24 6 months, n = 29 1 year). The grey lines connect individual donors sampled at different timepoints. P values are also shown. d, Expression of CD45RA (left) and CCR7 (right) determined by TotalSeq in individual CD8+ T cell clones in acute infection versus 6 months after infection (n = 41). eg, Geometric mean fluorescence intensity (gMFI) of selected markers on Teffector/TEM and TEMRA CoV2-Dex+ cells in acute infection (e), and 6 months (f) and 1 year (g) after infection. Phenotypes were evaluated only in patients with more than 5 Teffector/TEM and TEMRA CoV2-Dex+ cells per sample (n = 24 acute, n = 24 6 months, n = 26 1 year). h, Percentages of TCF1+, T-BET+, EOMES+ and TOX+ CoV2-Dex and CoV2-Dex+ cells during acute infection (n = 28). i, Percentages of TCF1+, T-BET+, EOMES+ and TOX+ CoV2-Dex+ cells in acute infection, and 6 months and 1 year after infection (n = 28 acute, n = 24 6 months, n = 29 1 year). P values were calculated using a Wilcoxon signed-rank test in b, dg, and a Wilcoxon–Mann–Whitney test with a correction for multiple comparisons using the Holm method in c and i. All tests were performed two-sided.
Fig. 4
Fig. 4. Transcriptional signature of antigen-specific CD8+ T cell clones persisting at 6 months.
a, Proportion of CoV2-Dex+ CD8+ T cell clones present during acute infection that were also detectable 6 months after infection. b, Clone size of persisting versus non-persisting CoV2-Dex+ CD8+ T cell clones (n = 41 persistent, n = 139 non-persistent). c, UMAP plot of persistent (red) versus non-persistent (green) CoV2-Dex+CD8+ T cell clones detected during acute infection. d, Gene set enrichment analysis showing enrichment of genes associated with cytokine signalling in persistent clones and mTOR signalling and proliferation in non-persistent CoV2-Dex+ T cell clones. Red dashed lines indicate minimal and maximal cumulative enrichment values. P value calculation was performed as detailed in the Method section. e, Expression of selected genes and CCR7 and CD45RA protein determined by Totalseq for persistent versus non-persistent CoV2-Dex+ T cell clones. P values were calculated using a Wilcoxon signed-rank test; a Bonferroni correction was applied for multiple comparisons. f, Expression level of selected genes in persistent versus non-persistent individual T cell clones; each dot represents one clone. g, Expression level of selected genes in cells from a single non-persistent clone compared to cells from a single persistent T cell clone; each dot represents one cell (n = 5 CASSQVIGNQPQHF, n = 16 CASSAPGPLTTQYF). In f, g, the white diamonds indicate median expression. For b, f, g, P values were calculated using a Wilcoxon–Mann–Whitney test. All tests were performed two-sided.
Extended Data Fig. 1
Extended Data Fig. 1. Gating strategy for antigen-specific CD8+ T cells and SARS-CoV2-specific antibodies in healthy donors and COVID-19 patients.
a, Gating strategy for CoV2-Dex+ cells. b, Representative plot of CoV2-Dex staining for HLA-A*11:01 and HLA-A*24:02. c, Gating strategy for CoV2-Pent+ cells. d, Linear regression of frequency of CoV2-Dex+ cells as a function of frequency of CoV2-Pent+ cells (n = 7). The p-value was calculated with t-statistic. e, SARS-CoV2-specific IgA (left) and IgG (right) of healthy donors compared to COVID-19 patients during acute infection, six months and one year after infection (n = 13 healthy , n = 46 acute, n = 41 six months, n = 30 one year). Dashed lines represent diagnostic cut-off values, i.e., 2.0 and 1.1 for IgA and IgG, respectively. P-values were calculated with a Mann-Whitney-Wilcoxon test. All tests were performed two-sided.
Extended Data Fig. 2
Extended Data Fig. 2. HLA-A*24:02 dextramer staining and CoV2-Dex+ cell frequency and phenotype based on HLA.
a, Representative plots of CoV2-Dex (HLA-A*24:02) staining in healthy donors. b, Percentage of CoV2-Dex+ cells in HLA-A*24:02 healthy donors and COVID-19 patients in acute infection and six months and one year after infection. Dots represent independent donors at each timepoint (n = 3 healthy, n = 6 acute, n = 5 six months, n = 3 one year). Gray lines connect individual donors sampled at different timepoints. c, Percentage of CoV2-Dex+ cells in HLA-A*01:01 and HLA-A*11:01 in acute infection and six months and one year after infection (HLA-A*01:01 n = 26 and HLA-A*11:01 n = 10 acute, HLA-A*01:01 n = 21 and HLA-A*11:01 n = 9 six months, HLA-A*01:01 n = 20 and HLA-A*11:01 n = 9 one year). d, Gating strategy for phenotypical analysis of CoV2-Dex+ compared to CoV2-Dex cells. e, Gating strategy for phenotypical analysis of CoV2-Pent+ compared to CoV2-Pent cells and frequency of Ki-67+, HLA-DR+ and CD127 levels in CoV2-Pent (gray) and CoV2-Pent+ (red) cells in acute COVID-19 (n = 7). f, Frequency of Ki-67+, HLA-DR+, granzyme B+, CX3CR1+ and CD127+ cells in CoV2-Dex+ cells in patients with an HLA-A*01:01 versus HLA-A*11:01 allele (HLA-A*01:01 n = 22 and HLA-A*11:01 n = 6) in the acute phase. b, c, and f, P-values were calculated with a Mann-Whitney-Wilcoxon test. e, P-values were calculated with a Wilcoxon signed-rank test. All tests were performed two-sided.
Extended Data Fig. 3
Extended Data Fig. 3. Frequency and phenotype of antigen-specific CD8+ T cells relative to disease severity.
a, Frequency of CoV2-Dex+ CD8+ T cells in healthy controls and patients with mild and severe disease during acute COVID-19 six months and one year after infection (n = 10 healthy; acute: n = 21 mild, n = 15 severe; six months: n = 18 mild, n = 16 severe; one year: n = 19 mild, n = 10 severe). bd, Frequency of Ki-67+, HLA-DR+, granzyme B+, CX3CR1+ and CD127+ in CoV-2Dex and CoV2-Dex+ cells in patients with mild versus severe disease (b) during acute infection, (c) six months and (d) one year after infection (acute: n = 16 mild, n = 12 severe; six months: n = 11 mild, n = 16 severe; one year: n = 19 mild, n = 10 severe). P-values were calculated with a Mann-Whitney-Wilcoxon test and adjusted for multiple comparisons using the Holm method. All tests were performed two-sided.
Extended Data Fig. 4
Extended Data Fig. 4. Definition of CoV2-Dex+ cells and single patient contribution to individual clusters.
a, Unique molecular identifier (UMI) counts for CoV2-Dex HLA-A*11:01 (ATEGALNTPK) versus UMI counts for negative control dextramer; cells defined as CoV2-Dex HLA-A*11:01 (ATEGALNTPK)+ are depicted in blue. b, (UMI) counts for CoV2-Dex HLA-A*11:01 (ATEGALNTPK) versus UMI counts for CoV2-Dex HLA-A*11:01 (KTFPPTEPK). c, Uniform manifold approximation and projection (UMAP) plot colored by patient ID (left) and cluster distribution for single patients (right).
Extended Data Fig. 5
Extended Data Fig. 5. Characteristics of antigen-specific CD8+ T cells six months after infection.
a, UMAP plot of transcriptomes from CD8+ T cells of healthy individuals (gray), COVID-19 patients in acute infection (red), and six months after infection (blue). b, Cluster contribution to total CD8+ T cells of healthy subjects, acute infection, and six months after infection. c, UMAP plots of marker expression for up to 2,000 CD8+ T cells from each sample collected six months after infection analyzed by spectral flow cytometry. Regions with high expression of specific markers appear red. Overlay of CoV2-Dex+ cells (red) and total CD8+ T cells (gray) is shown on the upper left. d, Percentages of CoV2-Dex+ cells contributing to indicated clusters during acute infection or six months after infection. Percentages are calculated on total cells per cluster per timepoint. e, Expression of selected genes (italicized), as well as CCR7 and CD45RA proteins determined by TotalseqTM, for CoV2-Dex+ cells detected in the acute versus recovery phase. P-values were calculated using a Mann-Whitney-Wilcoxon test and a Bonferroni correction was applied for multiple comparisons.
Extended Data Fig. 6
Extended Data Fig. 6. Transcriptome of SARS-CoV-2-specific CD8+ T cell clones.
UMAP plots highlighting single-cell transcriptomes belonging to individual CoV2-Dex+ T cell clones in acute infection (red) and six months after infection (blue).
Extended Data Fig. 7
Extended Data Fig. 7. Memory phenotypes in CoV2-Dex+ and CoV2-Pent+ cells.
a, b, Gating strategy for identifying naïve, stem cell memory (TSCM), central memory (TCM), effector/effector memory (Teffector/TEM), and effector memory T cells re-expressing CD45RA (TEMRA) in (a) CoV2-Dex and CoV2-Dex+ cells or (b) CoV2-Pent and CoV2-Pent+ cells. c, Percentages of naïve, TCM, Teffector/TEM, and TEMRA cells among CoV2-Pent (gray) and CoV2-Pent+ (red) cells (n = 7). d, e, Percentages of naïve, TCM, Teffector/TEM, and TEMRA cells among CoV2-Dex (gray) and CoV2-Dex+ (red) cells (d) six months and (e) one year after infection (n = 24 six months, n = 29 one year). fh, Percentages of naïve, TSCM, TCM, Teffector/TEM, and TEMRA in CoV2-Dex+ cells in patients with HLA-A*01:01 versus HLA-A*11:01 allele (f) during acute infection, (g) six months and (h) one year after infection (acute: n = 22 HLA-A*01:01 and n = 6 HLA-A*11:01; six months: n = 19 HLA-A*01:01 and n = 5 HLA-A*11:01; one year: n = 20 HLA-A*01:01 and n = 9 HLA-A*11:01). ik, Percentages of naïve, TSCM, TCM, Teffector/TEM, and TEMRA in CoV2-Dex+ cells in patients with mild versus severe disease (i) during acute infection, (j) six months and (k) one year after infection (acute: n = 16 mild, n = 12 severe; six months: n = 11 mild, n = 16 severe; one year: n = 19 mild, n = 10 severe). P-values were calculated with a Wilcoxon signed-rank test in ce and with a Mann-Whitney-Wilcoxon test in fk. All tests were performed two-sided.
Extended Data Fig. 8
Extended Data Fig. 8. Gating strategy and pseudolongitudinal time course of transcription factor expression.
a, Gating strategy TCF1+, T-BET+, EOMES+, and TOX+ cells in CoV2-Dex and CoV2-Dex+ cells. b, Percentages of TCF1+, T-BET+, EOMES+, and TOX+ cells in CoV2-Dex and CoV2-Dex+ cells (left) six months and (right) one year after infection (n = 24 six months, n = 29 one year). c, Linear regression of frequencies of TCF1+, T-BET+, EOMES+, and TOX+ cells in CoV2-Dex+ cells as a function of time since symptom onset (n = 81). P-values were calculated with t-statistic. d, Expression of transcription factors in Teffector/TEM and TEMRA in CoV2-Dex+ cells in acute infection and six months and one year after infection (n = 24 acute, n = 24 six months, n = 26 one year). P-values were calculated using a Wilcoxon signed-rank test in b and d. All tests were performed two-sided.
Extended Data Fig. 9
Extended Data Fig. 9. Clonality and phenotype of persistent versus non-persistent CoV2-Dex+ T cell clones.
a, Venn diagram showing overlapping clones during acute infection and at six months after infection. b, Cluster composition of persistent versus non-persistent CD8+ T cell clones. c, UMAP plots showing top ten persistent CoV2-Dex+ CD8+ T cell clones and top ten non-persistent CoV2-Dex+ CD8+ T cell clones.

References

    1. Crotty S, Ahmed R. Immunological memory in humans. Semin. Immunol. 2004;16:197–203. doi: 10.1016/j.smim.2004.02.008. - DOI - PubMed
    1. Sallusto F, Lanzavecchia A, Araki K, Ahmed R. From vaccines to memory and back. Immunity. 2010;33:451–463. doi: 10.1016/j.immuni.2010.10.008. - DOI - PMC - PubMed
    1. Saad-roy CM, et al. Immune life history, vaccination, and the dynamics of SARS-CoV-2 over the next 5 years. Science. 2020;818:811–818. doi: 10.1126/science.abd7343. - DOI - PMC - PubMed
    1. Jalkanen P, et al. COVID-19 mRNA vaccine induced antibody responses against three SARS-CoV-2 variants. Nat. Commun. 2021;12:3991. doi: 10.1038/s41467-021-24285-4. - DOI - PMC - PubMed
    1. Chemaitelly H, et al. mRNA-1273 COVID-19 vaccine effectiveness against the B.1.1.7 and B.1.351 variants and severe COVID-19 disease in Qatar. Nat. Med. 2021;27:1614–1621. doi: 10.1038/s41591-021-01446-y. - DOI - PubMed

Publication types

MeSH terms