. 2022 Jan;601(7894):623-629.
doi: 10.1038/s41586-021-04278-5. Epub 2021 Dec 7.

Multi-omic machine learning predictor of breast cancer therapy response

Affiliations

Multi-omic machine learning predictor of breast cancer therapy response

Stephen-John Sammut et al. Nature. 2022 Jan.

Abstract

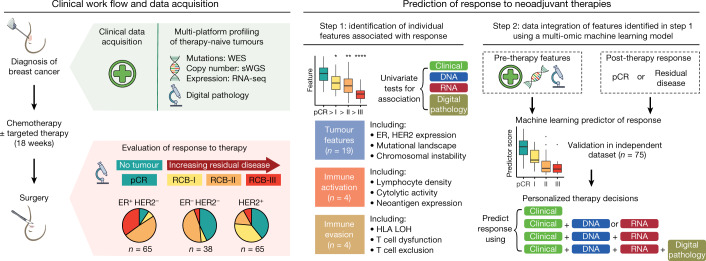
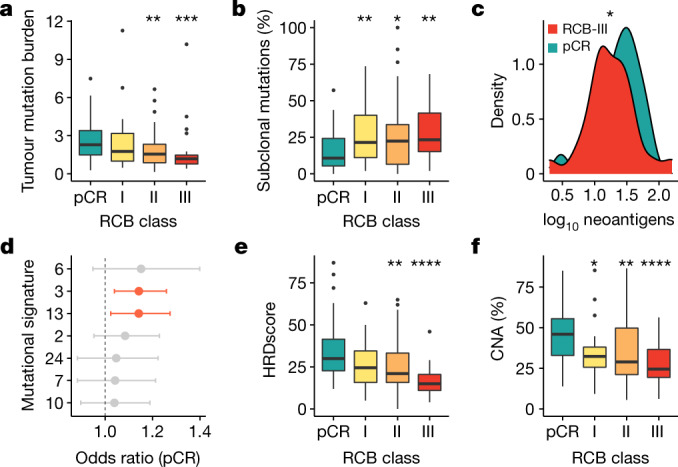
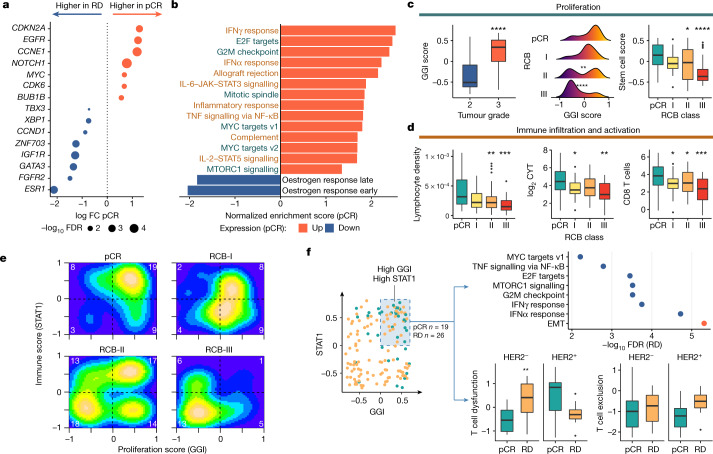
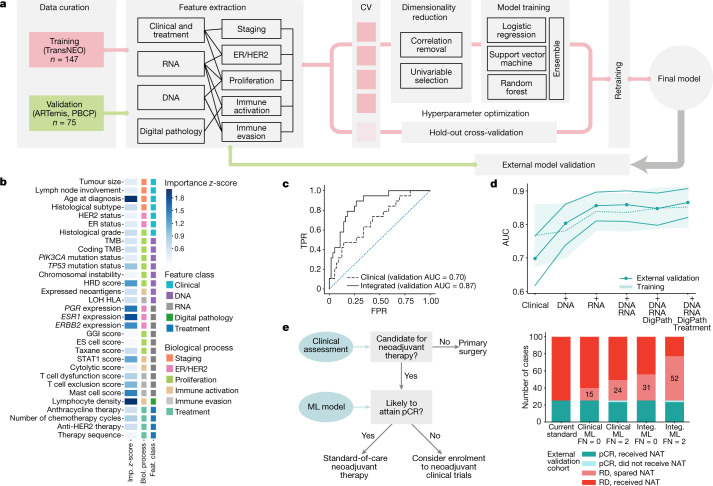
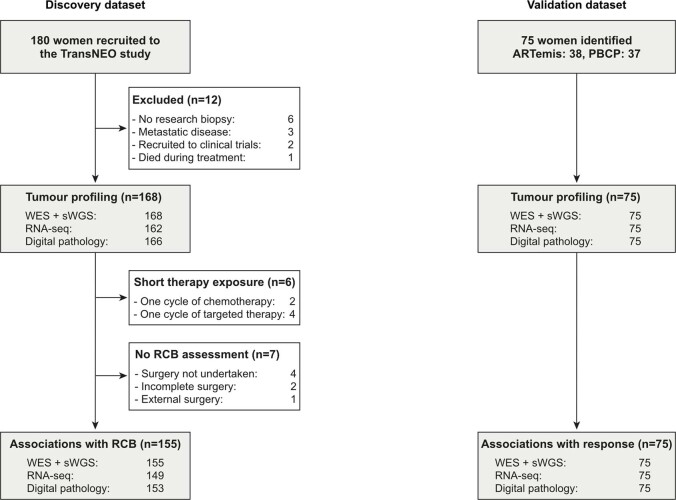
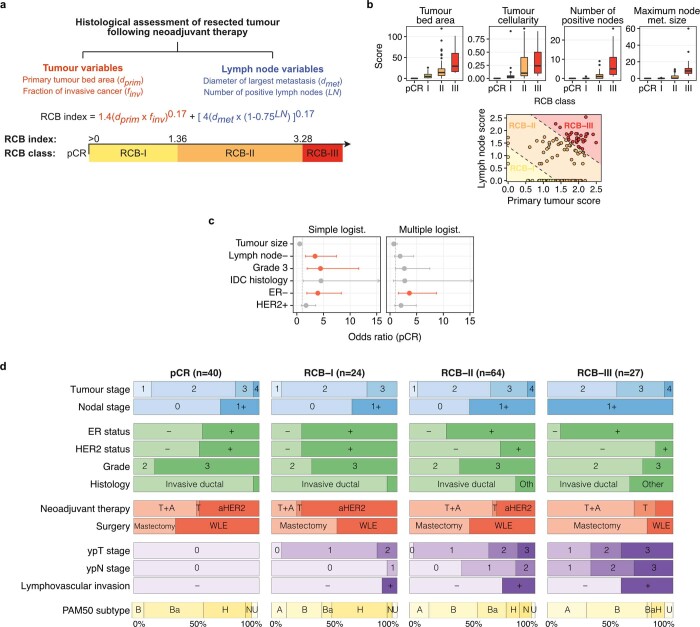
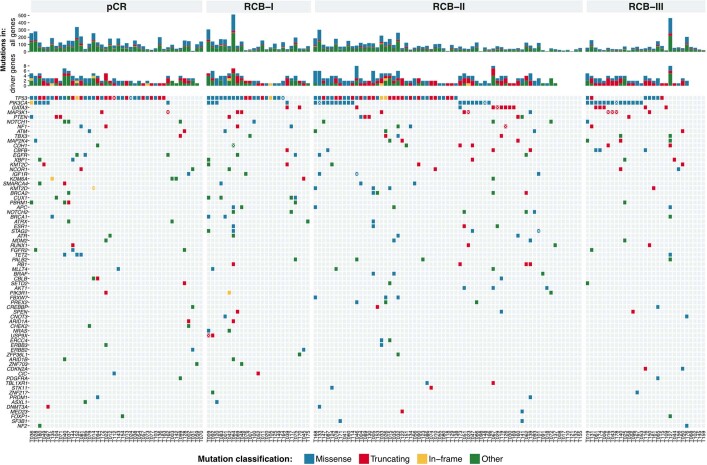
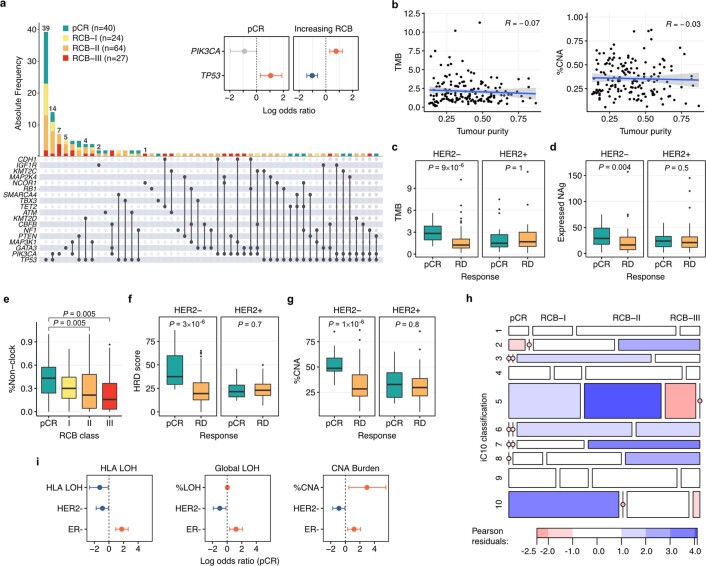
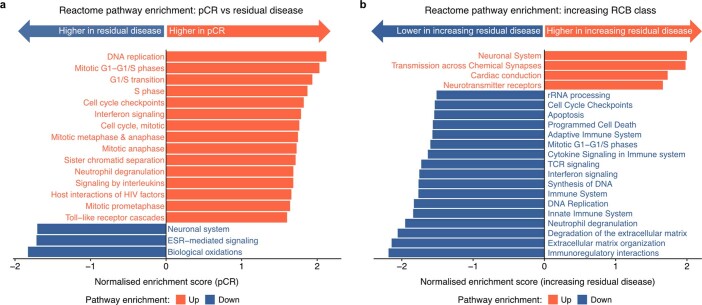
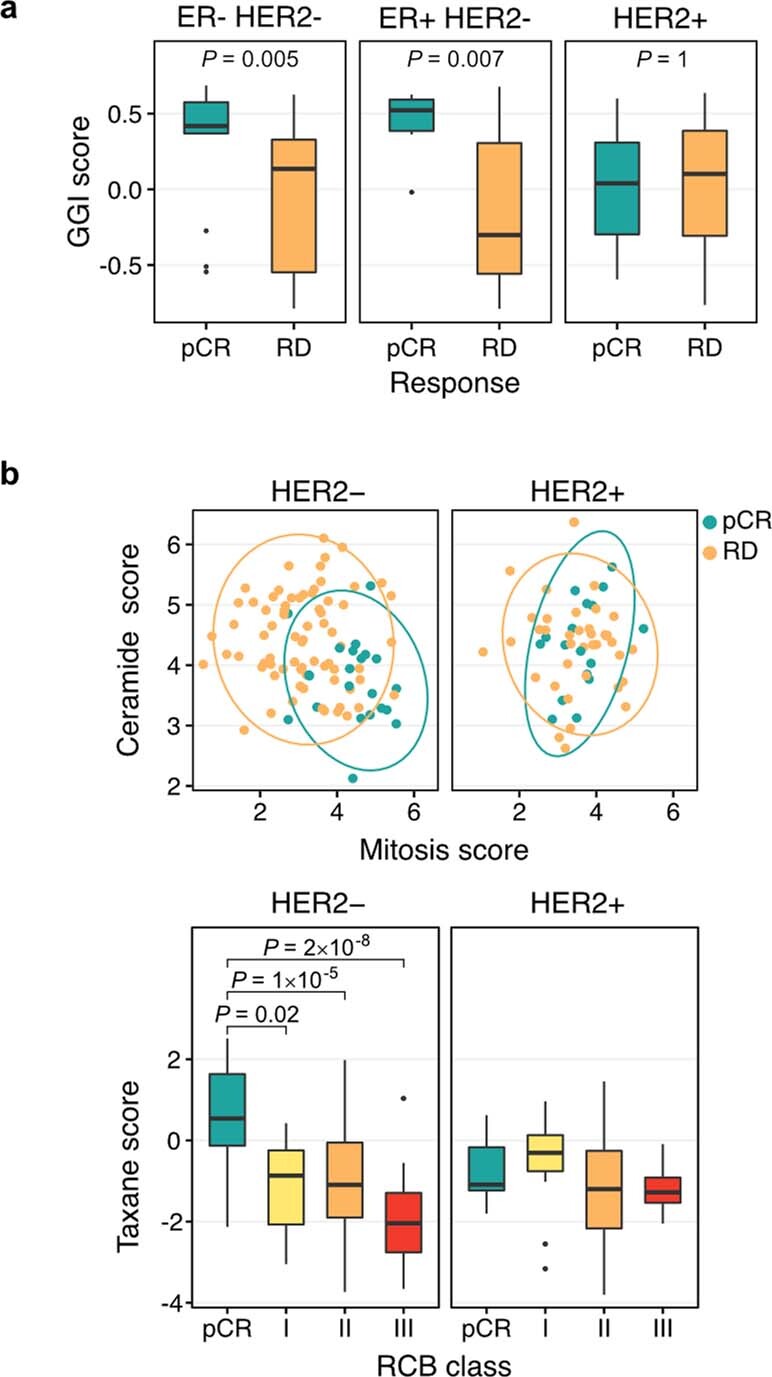
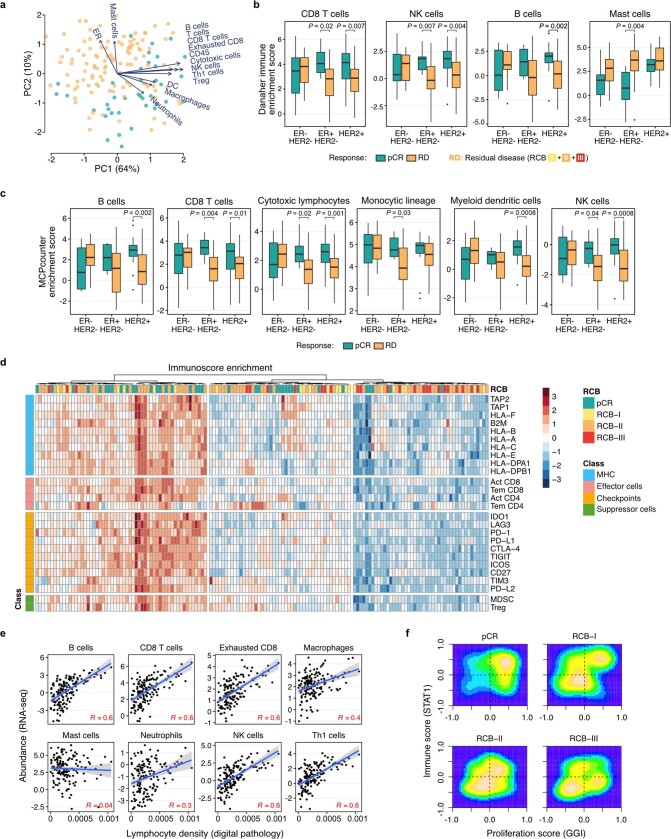
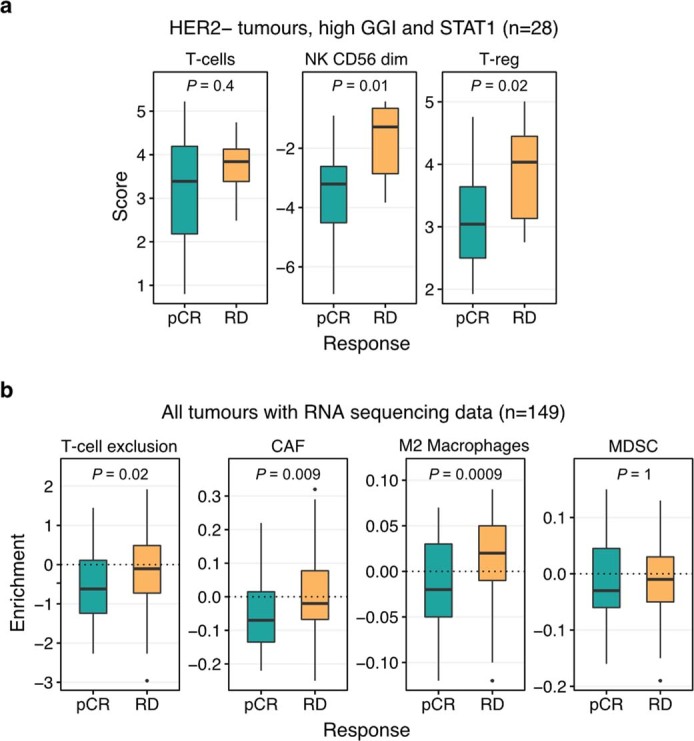
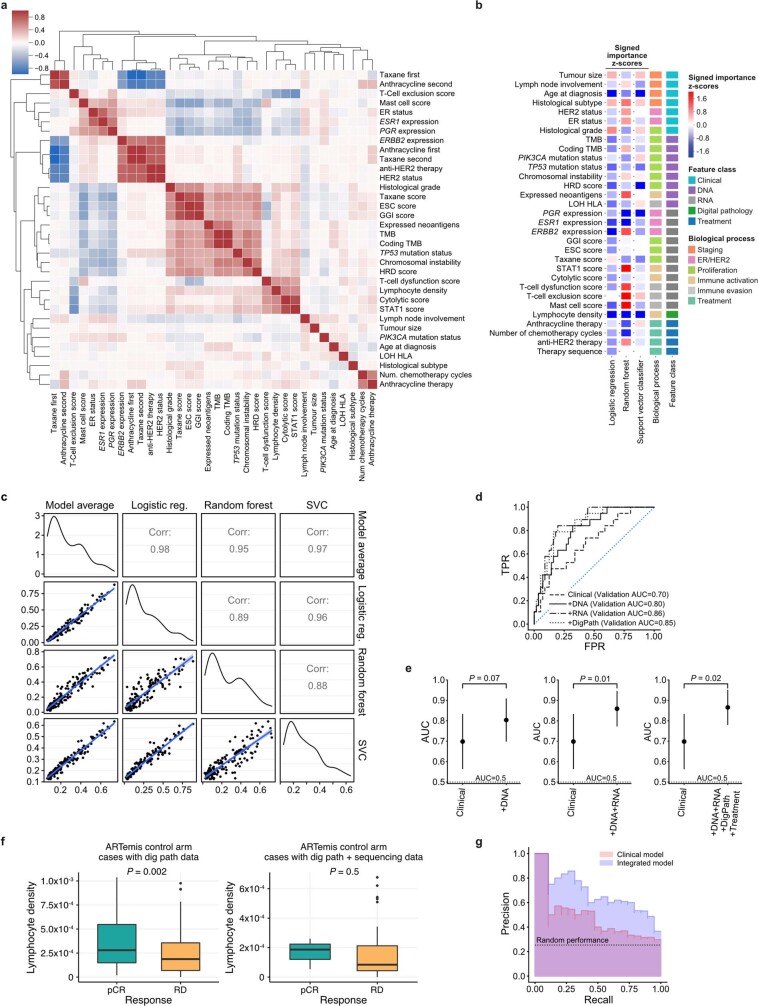
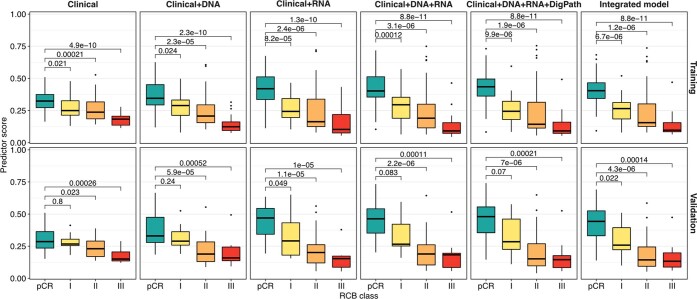
Breast cancers are complex ecosystems of malignant cells and the tumour microenvironment1. The composition of these tumour ecosystems and interactions within them contribute to responses to cytotoxic therapy2. Efforts to build response predictors have not incorporated this knowledge. We collected clinical, digital pathology, genomic and transcriptomic profiles of pre-treatment biopsies of breast tumours from 168 patients treated with chemotherapy with or without HER2 (encoded by ERBB2)-targeted therapy before surgery. Pathology end points (complete response or residual disease) at surgery3 were then correlated with multi-omic features in these diagnostic biopsies. Here we show that response to treatment is modulated by the pre-treated tumour ecosystem, and its multi-omics landscape can be integrated in predictive models using machine learning. The degree of residual disease following therapy is monotonically associated with pre-therapy features, including tumour mutational and copy number landscapes, tumour proliferation, immune infiltration and T cell dysfunction and exclusion. Combining these features into a multi-omic machine learning model predicted a pathological complete response in an external validation cohort (75 patients) with an area under the curve of 0.87. In conclusion, response to therapy is determined by the baseline characteristics of the totality of the tumour ecosystem captured through data integration and machine learning. This approach could be used to develop predictors for other cancers.


Conflict of interest statement

C.C. is a member of the iMED External Science Panel for AstraZeneca, a member of the Scientific Advisory Board for Illumina and a recipient of research grants (administered by the University of Cambridge) from Genentech, Roche, AstraZeneca and Servier. M.C.-O. has received research funding from Lilly. All other authors declare no competing interests.

Figures

Fig. 1
Fig. 1. Overview of the study design.
Pre-therapy breast tumours from 168 patients were profiled using DNA sequencing and RNA sequencing (RNA-seq) and digital pathology analysis. Response was assessed on completion of neoadjuvant therapy using the RCB classification. Individual pre-therapy clinical, molecular and digital pathology features associated with pCR were identified and integrated within machine learning models to predict responses, which were then validated in an independent dataset. sWGS, shallow whole-genome sequencing; WES, whole-exome sequencing.
Fig. 2
Fig. 2. Genomic features monotonically associate with response to therapy.
a, b, Box plots showing monotonic association between RCB class: total tumour mutation burden (a) (P = 0.004, ordinal logistic regression; pCR versus RCB-II **P = 0.001 and RCB-III ***P = 0.0002), and the percentage of subclonal mutations (b) (P = 0.02, ordinal logistic regression; pCR versus RCB-I **P = 0.007, RCB-II *P = 0.04 and RCB-III **P = 0.001). c, Density curves showing distribution of neoantigens in tumours that attained pCR and RCB-III (monotonic association, P = 0.03, ordinal logistic regression; pCR versus RCB-III *P < 0.05). d, Associations between mutational signatures and pCR. Statistically significant associations obtained from logistic regression are shown in red (HRD: 3; APOBEC: 13). The measure of the centre is the parameter estimate, and the error bars represent 95% confidence intervals; the vertical dashed line corresponds to an odds ratio of 1. e, f, Box plots showing monotonic association between RCB class and HRD score (e) (P = 0.00001, ordinal logistic regression; pCR versus RCB-II **P = 0.006 and RCB-III ****P = 3 × 10−6), and the percentage of copy number alterations (CNAs; f) (P = 0.0002, ordinal logistic regression; pCR versus RCB-I *P = 0.01, RCB-II **P = 0.004 and RCB-III ****P = 7 × 10−5). In af, the number of patients with DNA sequencing data: 40 (for pCR), 24 (for RCB-I), 64 (for RCB-II) and 27 (for RCB-III). In a, b, e, f, the box bounds the interquartile range divided by the median, with the whiskers extending to a maximum of 1.5 times the interquartile range beyond the box. Outliers are shown as dots. Wilcoxon rank-sum tests; all P values are two-sided.
Fig. 3
Fig. 3. Transcriptomic features associated with response to neoadjuvant therapy.
a, Expression of breast cancer driver genes associated with pCR. FC, fold change; RD, residual disease. b, MSigDB Hallmark gene sets associated with pCR. Response was predominantly associated with proliferative (green) and immune (brown) gene sets. c, Box plot showing association of GGI score with histological grade (P = 5 × 10−11) (left); density plots showing monotonic association (P = 2 × 10−5, ordinal logistic regression) between GGI score and RCB (pCR versus RCB-II **P = 0.01 and RCB-III ****P = 3 × 10−5) (middle); and box plot showing monotonic association (P = 0.0001, ordinal logistic regression) between stem -cell enrichment score and RCB (pCR versus RCB-II *P = 0.02 and RCB-III ****P = 7 × 10−5) (right). The number of patients with RNA sequencing data: 39 (for pCR), 23 (for RCB-I), 62 (for RCB-II) and 25 (for RCB-III). d, Box plots showing monotonic associations between computationally estimated lymphocyte density and RCB (P < 1 × 10−10, ordinal logistic regression; n = 153 cases with digital pathology data; pCR versus RCB-II **P = 0.006 and RCB-III ***P = 0.0001) (left); CYT score and RCB (P = 0.001; n = 149 cases with RNA sequencing data; pCR versus RCB-I *P = 0.03 and RCB-III **P = 0.001) (middle); and Danaher CD8 T cell enrichment and RCB (P = 0.0002; n = 149 cases; pCR versus RCB-I *P = 0.04, RCB-II *P = 0.04 and RCB-III ***P = 0.0003) (right). e, 2D density plot showing the relationship between proliferation and immune activation across RCB classes. The number of cases in each quadrant is shown in white. f, The distribution of GGI and STAT1 scores across cohort (left). The shaded area represents samples with proliferation and immune enrichment values above the mean (n = 45 cases). The MSigDB Hallmarks pathways associated with residual disease in these 45 tumours (red represents overexpressed, and blue indicates underexpressed) (top right). Box plots showing association between T cell dysfunction (**P = 0.006 HER2) and exclusion with response in these tumours are also shown (bottom right). EMT, epithelial-to-mesenchymal transition. In c, d, f, the box bounds the interquartile range divided by the median, with the whiskers extending to a maximum of 1.5 times the interquartile range beyond the box. Wilcoxon rank-sum tests; all P values are two-sided.
Fig. 4
Fig. 4. Predicting response to therapy using a composite machine learning model.
a, Schematic of the machine learning framework. CV, cross validation. b, Feature importance calculated as the average z-score resulting from dropping each individual feature from the three components of the model and calculating the new area under the receiver operating characteristic curve (AUC). The importance of chemotherapy sequence features have been averaged into a ‘therapy sequence’ row for simplicity. ES cell, embryonic stem cell; TMB, tumour mutation burden. c, Receiver operating characteristic curves for the clinical (dashed) and fully integrated (continuous) models applied on the external validation cohort. The dotted line indicates random performance. FPR, false positive rate; TPR, true positive rate. d, AUCs for models with increasing levels of data integration. The continuous line on the foreground corresponds to the AUCs obtained from the external validation cohorts (filled markers), with bands representing the standard deviation estimated with bootstrap. The filled band on the background corresponds to the standard deviation of the AUCs obtained using cross-validation on the training dataset, with mean values represented by a dashed line. DigPath, digital pathology. e, Potential clinical impact of the pCR model, using data from the external validation confusion matrix (left). Bar plots show the number of patients that would be identified to be chemoresistant using operating thresholds of 0 and 2 false negatives (FN), using either the clinical or fully integrated models, respectively (right). ML, machine learning; NAT, neoadjuvant therapy.
Extended Data Fig. 1
Extended Data Fig. 1. Summary of cases analysed within this study.
180 women were recruited to the TransNEO neoadjuvant breast cancer study. Tumour profiling was performed in 168 cases and associations with response identified in 155 cases who received more than one cycle of neoadjuvant chemotherapy or targeted therapy. 147 cases had a complete molecular/digital pathology dataset, received more than one cycle of chemotherapy and targeted therapy and had an RCB assessment available: data from these cases were used to build a machine learning predictor of response to neoadjuvant therapy. Validation was performed across a cohort of 75 cases recruited to the ARTemis and Personalised Breast Cancer (PBCP) studies.
Extended Data Fig. 2
Extended Data Fig. 2. Calculation of the Residual Cancer Burden index and associations between clinical features and response.
a, Tumour and lymph node histological features used to calculate the continuous Residual Cancer Burden (RCB) index and categorical RCB class. Increasing RCB index denotes increasing burden of residual disease post-neoadjuvant therapy and increasing chemoresistance. b, Top: Box plots showing distribution of tumour and lymph node histological features in n = 161 cases with clinical data and RCB assessment across the RCB classes. The box bounds the interquartile range divided by the median, with the whiskers extending to a maximum of 1.5 times the interquartile range beyond the box. Outliers are shown as dots. Bottom: distribution of primary tumour score and lymph node score across RCB classes. c, Associations of clinical variables with pCR using simple and multiple logistic regression. Significant associations (P < 0.05, logistic regression) are shown in red. The measure of centre is the parameter estimate and error bars represent 95% confidence intervals. d, Distribution of tumour features across RCB classes: pre-operative staging (blue), pre-operative histological features (green), neoadjuvant therapy (red, T: taxane, A: anthracycline, aHER2: anti-HER2 therapy), surgical approach (red, WLE: wide local excision), post-operative tumour (ypT) and nodal (ypN) staging and lymphovascular invasion (purple) and PAM50 subtypes (yellow, A: Luminal A, B: Luminal B, Ba: Basal, H: HER2-enriched, N: Normal-like, U: Unknown). Tumours with RCB assessment and adequate therapy exposure only included (more than 1 cycle of chemotherapy or anti-HER2 therapy received, n = 155).
Extended Data Fig. 3
Extended Data Fig. 3. The somatic mutational driver landscape of tumours prior to neoadjuvant therapy.
Oncoprint showing somatic mutations in breast cancer driver gene identified using WES. Cases classified by RCB class. Multiple mutations in a case are denoted by a white × . Truncating mutations (red) include nonsense, splice site and frame shift insertions and deletions. In-frame mutations (yellow) include in-frame insertions and deletions. Other mutations (green) include silent exonic mutations, 3’ and 5’ UTR flank mutations and intronic mutations.
Extended Data Fig. 4
Extended Data Fig. 4. Further associations between genomic features and response to neoadjuvant therapy.
a, Interaction plot showing co-occurrence of non-silent driver gene mutations and response. Associations between TP53 and PIK3CA mutations and response shown in inset (logistic regression, red: positive, blue: negative, grey: not significant, error bars represent 95% confidence intervals). b, Pearson’s product-moment correlations (R) between tumour purity and (left) tumour mutation burden and (right) %CNAs. The shaded area, in grey, represents the 95% confidence interval. c, Box plots showing associations between TMB and response, stratified by HER2 status. d, Box plots showing association between expressed neoantigen (NAg) load and response, stratified by HER2 status. e, Box plot showing monotonic association (P = 0.005, ordinal logistic regression) between exposure of non-clock signatures and RCB class. f, Box plots showing associations between HRD score and response, stratified by HER2 status. g, Box plots showing associations between %CNA and response, stratified by HER2 status. cg, The box bounds the interquartile range divided by the median, with the whiskers extending to a maximum of 1.5 times the interquartile range beyond the box. Outliers are shown as dots. Wilcoxon rank sum tests, all P values two-sided. Number of cases analysed (n) = 155 (HER2- pCR = 22, RD (residual disease) = 76; HER2+ pCR = 18, RD = 39)). h, Associations between RCB class and iC10: Pearson residuals indicate overrepresentation of iC10 subtype with response (blue: overrepresentation, red: underrepresentation). i, Associations between HLA LOH, global LOH and global copy number alterations with pCR (logistic regression, red: positive association, blue: negative association). The measure of centre is the parameter estimate and error bars represent 95% confidence intervals.
Extended Data Fig. 5
Extended Data Fig. 5. Reactome pathways associated with response to neoadjuvant therapy.
a, b, Reactome pathway enrichment showing pathways associated with (a) pCR versus residual disease, (b) degree of residual disease following neoadjuvant therapy.
Extended Data Fig. 6
Extended Data Fig. 6. Associations between tumour proliferation and response.
a, Box plots showing associations between proliferation (GGI) GSVA scores across ER/HER subtypes. b, Top: Scatter plots showing the distribution of the mitotic and ceramide score components of a taxane response metagene within the HER2- and HER2+ cohorts. Bottom: Box plots showing association of the combined taxane response metagene score within the HER2- and HER2+ cohorts. In a, b, the box bounds the interquartile range divided by the median, with the whiskers extending to a maximum of 1.5 times the interquartile range beyond the box. Outliers are shown as dots. Two-tailed Wilcoxon rank sum tests. Number of cases (n): ER-HER2-: 37, ER+HER2-: 57, HER2+: 55.
Extended Data Fig. 7
Extended Data Fig. 7. The relationship between tumour immune microenvironment and response.
a, PCA analysis on the abundance of tumour immune microenvironment components obtained through the deconvolution of RNA-seq data using Danaher’s immune signatures (number of cases (n): pCR (green) = 39, RD (orange) = 110). b, c, Box plots showing associations between response and (b) Danaher immune cell enrichment and (c) MCPcounter immune cell enrichment across ER/HER subtypes. The box bounds the interquartile range divided by the median, with the whiskers extending to a maximum of 1.5 times the interquartile range beyond the box. Outliers are shown as dots. Two-tailed Wilcoxon rank sum tests. Number of cases (n): ER-HER2-: 37, ER+HER2-: 57, HER2+: 55. d, Heatmap showing unsupervised clustering of cancer immunity parameters across n = 149 cases with RNA sequencing data. e, Scatter plot showing association between computationally derived lymphocyte density and immune cell enrichment using Danaher’s immune signatures across n = 147 cases with digital pathology and RNA sequencing data. Pearson’s product-moment correlations (R) shown. The shaded area, in grey, represents the 95% confidence interval. f, 2D density plot validating relationship between GGI and STAT1 GSVA across RCB subgroups in two external microarray gene sets comprising 457 cases.
Extended Data Fig. 8
Extended Data Fig. 8. T-cell dysfunction and exclusion.
a, Box plots showing enriched inhibitory immune cell types (Danaher gene sets) in HER2- tumours with high GGI and STAT1 (number of cases (n): pCR = 12, RD = 16). b, Box plots showing association between components of T-cell exclusion score and response (number of cases (n): pCR = 39, RD = 110). CAF: Cancer associated fibroblasts, MDSC: Myeloid-derived suppressor cells. In a, b, the box bounds the interquartile range divided by the median, with the whiskers extending to a maximum of 1.5 times the interquartile range beyond the box. Outliers are shown as dots. Two-tailed Wilcoxon rank sum tests.
Extended Data Fig. 9
Extended Data Fig. 9. Machine learning model performance.
a, Correlation plot showing the results of unsupervised clustering between all the features explored. b, Signed feature importance split by algorithm. Negative numbers (blue) signify a decrease in AUC as a result of dropping, and therefore indicate that the feature improves the performance. c, Correlation of the three classification pipeline scores across the training dataset. Two-sided P values of all correlations < 2.2 x 10⁻¹⁶. d, Receiver-operating characteristic curves for the clinical and integrated models applied on the external validation cohort. e, Comparison between AUCs of the clinical model and models with different levels of data integration. The measure of centre is the parameter estimate and error bars represent 95% DeLong confidence intervals. f, Association between lymphocyte density and treatment response in ARTemis patients with digital pathology and sequencing data (right, n = 38 cases) vs. patients with only digital pathology available (left, n = 313 cases). The box bounds the interquartile range divided by the median, with the whiskers extending to a maximum of 1.5 times the interquartile range beyond the box. Outliers are shown as dots. P values obtained from Wilcoxon rank sum tests. g, Precision-recall curves of the clinical and fully integrated models applied on the test cohorts. The average precision values are 0.46 (clinical model) and 0.68 (fully integrated model). The areas under the precision-recall curves are 0.43 (clinical model) and 0.67 (fully integrated model).
Extended Data Fig. 10
Extended Data Fig. 10. Predictor score ordinally associated with RCB class.
Box plots showing the distribution of predictor scores obtained by the six models across RCB classes in both training (n = 147 cases) and validation (n = 75 cases) sets. The box bounds the interquartile range divided by the median, with the whiskers extending to a maximum of 1.5 times the interquartile range beyond the box. Outliers are shown as dots. P values two-sided and obtained from FDR-corrected Wilcoxon rank sum tests.

References

    1. Hanahan D, Weinberg RA. Hallmarks of cancer: the next generation. Cell. 2011;144:646–674. - PubMed
    1. Marusyk A, Janiszewska M, Polyak K. Intratumor heterogeneity: the Rosetta stone of therapy resistance. Cancer Cell. 2020;37:471–484. - PMC - PubMed
    1. Symmans WF, et al. Measurement of residual breast cancer burden to predict survival after neoadjuvant chemotherapy. J. Clin. Oncol. 2007;25:4414–4422. - PubMed
    1. Asselain B, et al. Long-term outcomes for neoadjuvant versus adjuvant chemotherapy in early breast cancer: meta-analysis of individual patient data from ten randomised trials. Lancet Oncol. 2018;19:27–39. - PMC - PubMed
    1. Symmans WF, et al. Long-term prognostic risk after neoadjuvant chemotherapy associated with residual cancer burden and breast cancer subtype. J. Clin. Oncol. 2017;35:1049–1060. - PMC - PubMed

Publication types