

Identification of Rare Loss-of-Function Genetic Variation Regulating Body Fat Distribution
- PMID: 34875679
- PMCID: PMC8947777
- DOI: 10.1210/clinem/dgab877
Identification of Rare Loss-of-Function Genetic Variation Regulating Body Fat Distribution
Abstract
Context: Biological and translational insights from large-scale, array-based genetic studies of fat distribution, a key determinant of metabolic health, have been limited by the difficulty in linking predominantly noncoding variants to specific gene targets. Rare coding variant analyses provide greater confidence that a specific gene is involved, but do not necessarily indicate whether gain or loss of function (LoF) would be of most therapeutic benefit.
Objective: This work aimed to identify genes/proteins involved in determining fat distribution.
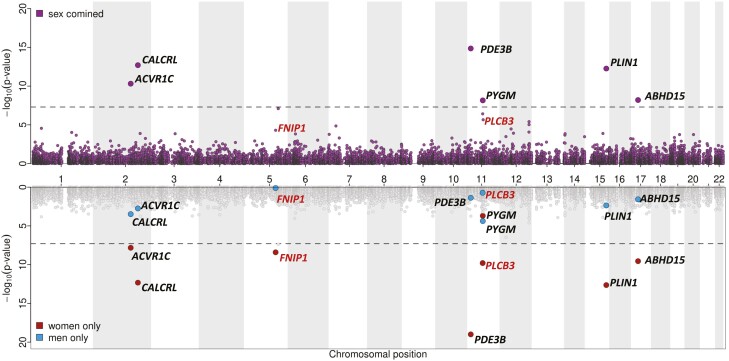
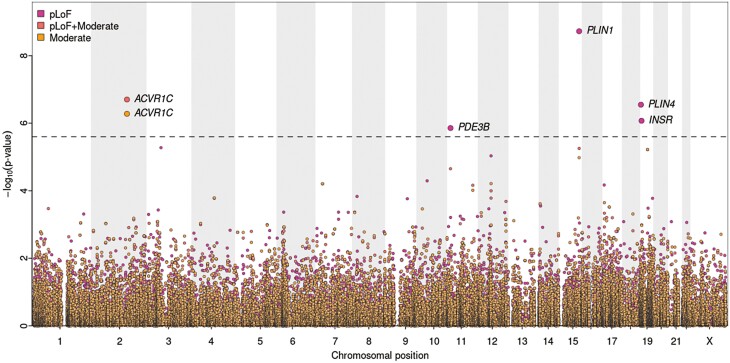
Methods: We combined the power of genome-wide analysis of array-based rare, nonsynonymous variants in 450 562 individuals in the UK Biobank with exome-sequence-based rare LoF gene burden testing in 184 246 individuals.
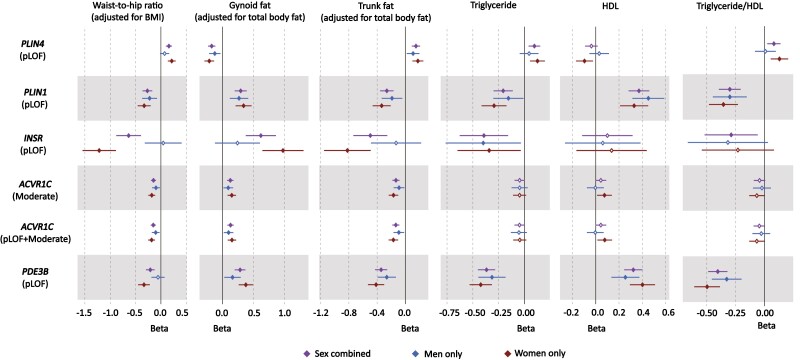
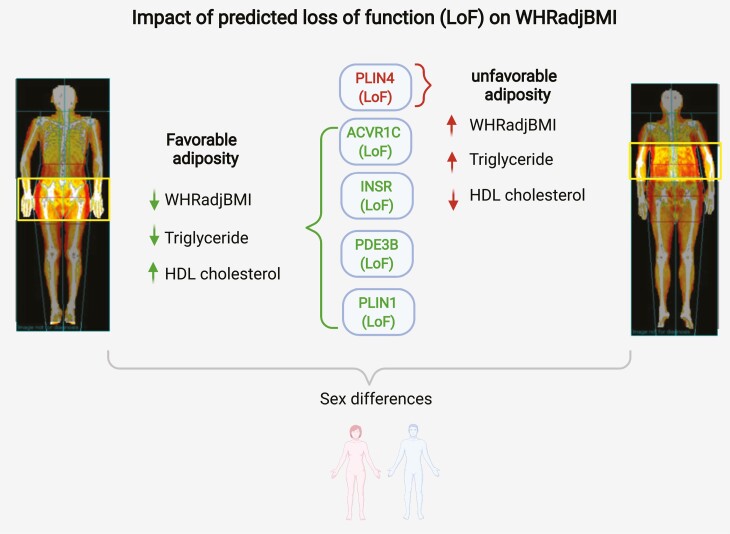
Results: The data indicate that the LoF of 4 genes (PLIN1 [LoF variants, P = 5.86 × 10⁻⁷], INSR [LoF variants, P = 6.21 × 10⁻⁷], ACVR1C [LoF + moderate impact variants, P = 1.68 × 10⁻⁷; moderate impact variants, P = 4.57 × 10⁻⁷], and PDE3B [LoF variants, P = 1.41 × 10⁻⁶]) is associated with a beneficial effect on body mass index-adjusted waist-to-hip ratio and increased gluteofemoral fat mass, whereas LoF of PLIN4 (LoF variants, P = 5.86 × 10⁻⁷ adversely affects these parameters. Phenotypic follow-up suggests that LoF of PLIN1, PDE3B, and ACVR1C favorably affects metabolic phenotypes (eg, triglycerides [TGs] and high-density lipoprotein [HDL] cholesterol concentrations) and reduces the risk of cardiovascular disease, whereas PLIN4 LoF has adverse health consequences. INSR LoF is associated with lower TG and HDL levels but may increase the risk of type 2 diabetes.
Conclusion: This study robustly implicates these genes in the regulation of fat distribution, providing new and in some cases somewhat counterintuitive insight into the potential consequences of targeting these molecules therapeutically.
Keywords: UK Biobank; cardiometabolic risk; fat distribution; genetic variants; loss of function.
© The Author(s) 2021. Published by Oxford University Press on behalf of the Endocrine Society.
Figures
References
-
- Shungin D, Winkler TW, Croteau-Chonka DC, et al. ; ADIPOGen Consortium; CARDIOGRAMplusC4D Consortium; CKDGen Consortium; GEFOS Consortium; GENIE Consortium; GLGC; ICBP; International Endogene Consortium; LifeLines Cohort Study; MAGIC Investigators; MuTHER Consortium; PAGE Consortium; ReproGen Consortium. . New genetic loci link adipose and insulin biology to body fat distribution. Nature. 2015;518(7538):187-196. - PMC - PubMed
Publication types
MeSH terms
Substances
Grants and funding
- MR/T014067/1/MRC_/Medical Research Council/United Kingdom
- 203141/WT_/Wellcome Trust/United Kingdom
- DH_/Department of Health/United Kingdom
- MC_QA137853/MRC_/Medical Research Council/United Kingdom
- MC_UU_00014/5/MRC_/Medical Research Council/United Kingdom
- 221651/Z/20/Z/WT_/Wellcome Trust/United Kingdom
- WT 214274/WT_/Wellcome Trust/United Kingdom
- WT 219417/WT_/Wellcome Trust/United Kingdom
- 090532/WT_/Wellcome Trust/United Kingdom
- MR/X001210/1/MRC_/Medical Research Council/United Kingdom
- 098381/WT_/Wellcome Trust/United Kingdom
- 106130/WT_/Wellcome Trust/United Kingdom
- WT 210752/WT_/Wellcome Trust/United Kingdom
- MC_UU_12012/5/MRC_/Medical Research Council/United Kingdom
- MC_UU_12015/1/MRC_/Medical Research Council/United Kingdom
- MR/L016311/1/MRC_/Medical Research Council/United Kingdom
- MC_PC_13046/MRC_/Medical Research Council/United Kingdom
- MC_UU_12015/2/MRC_/Medical Research Council/United Kingdom
- MR/L00002/1/MRC_/Medical Research Council/United Kingdom
- L01999X/1/MRC_/Medical Research Council/United Kingdom
- MR/L01999X/1/MRC_/Medical Research Council/United Kingdom
- MC_PC_17228/MRC_/Medical Research Council/United Kingdom
- MC_UU_00006/1/MRC_/Medical Research Council/United Kingdom
- MC_UU_00006/2/MRC_/Medical Research Council/United Kingdom
- MC_PC_13048/MRC_/Medical Research Council/United Kingdom
LinkOut - more resources
Full Text Sources
Other Literature Sources
Medical
Research Materials
Miscellaneous
