

Repression of the expression of proinflammatory genes by mitochondrial transcription factor A is linked to its alternative splicing regulation in human lung epithelial cells
- PMID: 34876009
- PMCID: PMC8650232
- DOI: 10.1186/s12865-021-00464-2
Repression of the expression of proinflammatory genes by mitochondrial transcription factor A is linked to its alternative splicing regulation in human lung epithelial cells
Abstract
Background: Mitochondrial transcription factor A (TFAM) is associated with a number of neurodegenerative diseases and also with asthma. TFAM deficiency-induced mitochondrial DNA stress primes the antiviral innate immune response in mouse embryonic fibroblasts. However, the role of TFAM in asthma related inflammation remains obscure. The purpose of this study was to investigate the regulatory mechanism of TFAM in asthma.
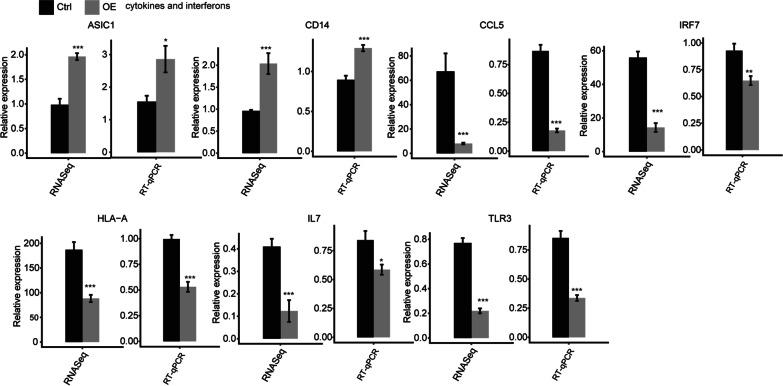
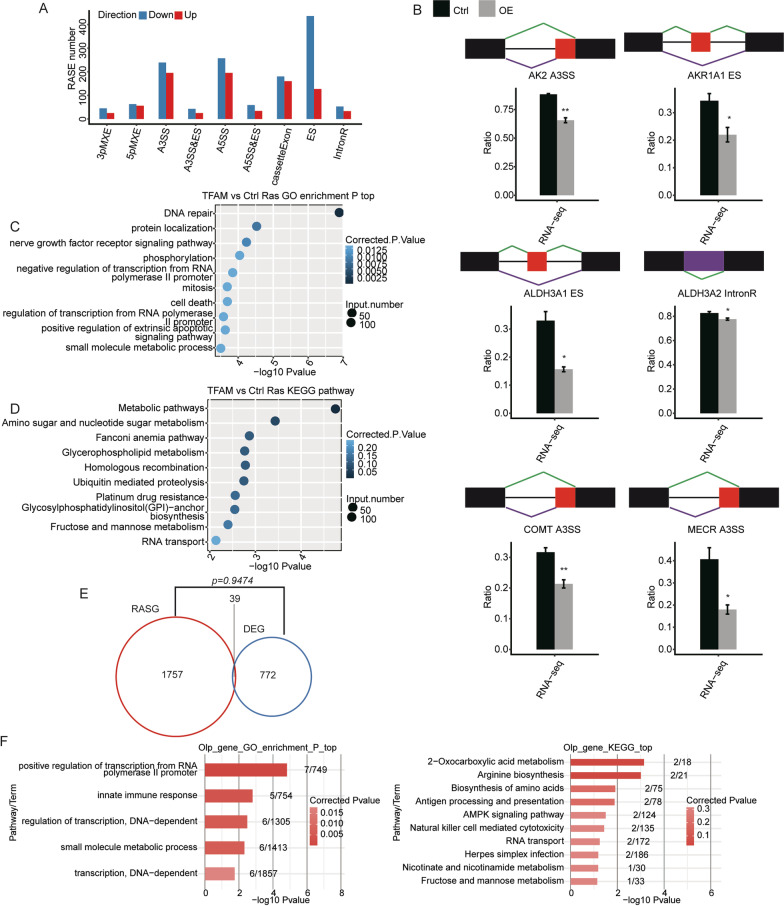
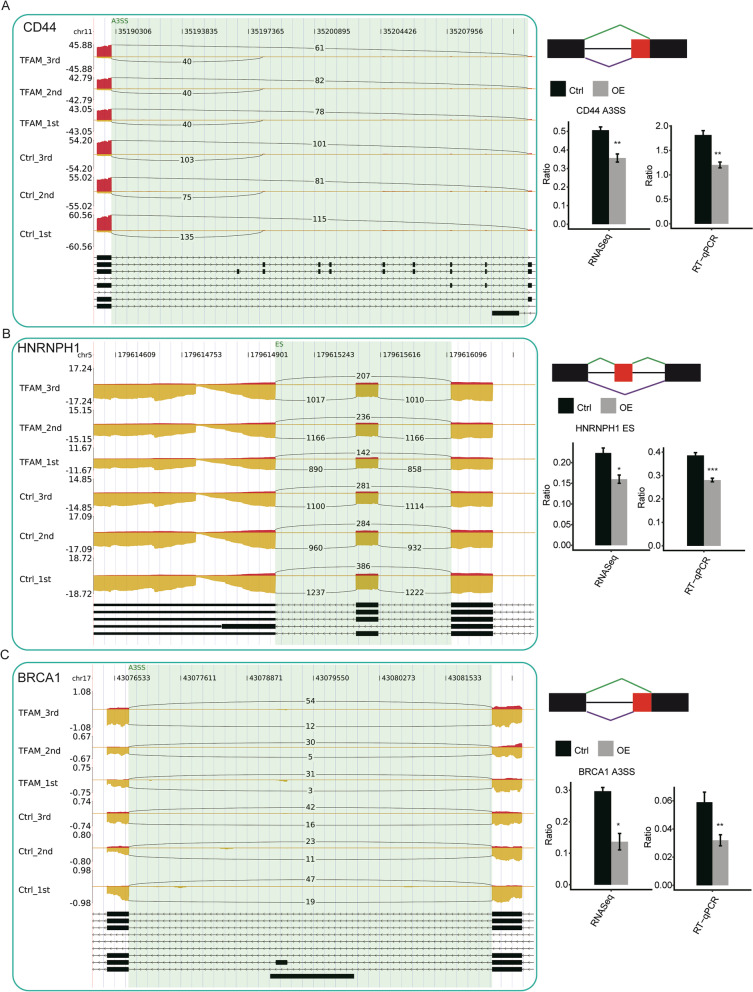
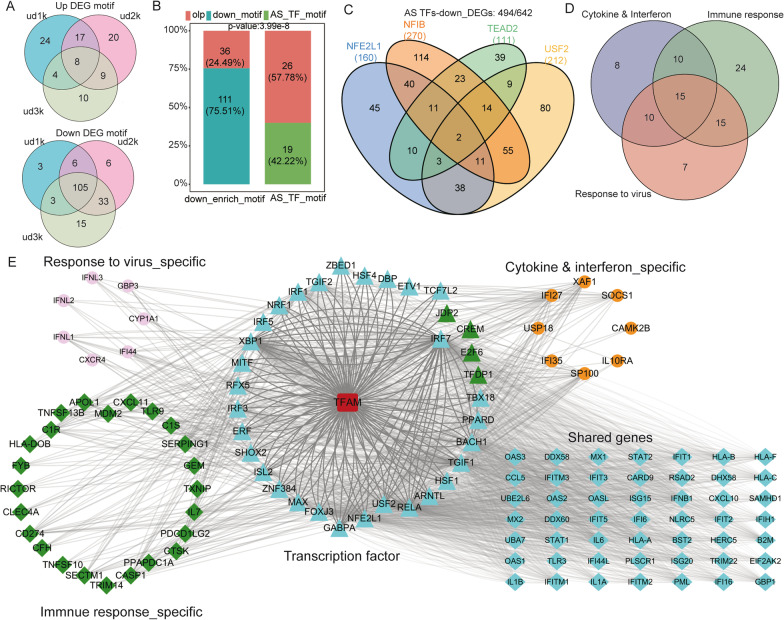
Results: In this study, we overexpressed TFAM in human lung epithelial cells (A549), then obtained the TFAM-regulated transcriptome by Illumina sequencing technology. Transcriptome analysis revealed that TFAM overexpression down-regulated and up-regulated the expression of 642 and 169 differentially expressed genes (DEGs), respectively. The TFAM-repressed genes were strongly enriched in cytokine-mediated signaling pathway, type I interferon- and INF-γ-mediated signaling pathways, and viral response pathways. We also revealed that 2563 alternative splicing events in 1796 alternative splicing genes (ASGs) were de-regulated upon TFAM overexpression. These TFAM-responding ASGs were enriched in DNA repair, nerve growth factor receptor signaling pathway, and also transcription regulation. Further analysis revealed that the promoters of TFAM-repressed DEGs were enriched by DNA binding motifs of transcription factors whose alternative splicing was regulated by TFAM.
Conclusions: These findings suggest that TFAM regulates not only immune response gene expression in human lung epithelial cells, but also pre-mRNA alternative splicing which may mediate transcriptional regulation; this TFAM-centered gene regulation network could be targeted in developing therapies against various diseases.
Keywords: A549; Alternative splicing; TFAM; Transcription factors; Viral response pathway gene expression.
© 2021. The Author(s).
Conflict of interest statement
The authors declare that they have no competing interests.
Figures

Similar articles
-
Upregulation of Mitochondrial Transcription Factor A Promotes the Repairment of Renal Tubular Epithelial Cells in Sepsis by Inhibiting Reactive Oxygen Species-Mediated Toll-Like Receptor 4/p38MAPK Signaling.Pathobiology. 2019;86(5-6):263-273. doi: 10.1159/000501789. Epub 2019 Aug 20. Pathobiology. 2019. PMID: 31430762
-
RBM4 modulates the proliferation and expression of inflammatory factors via the alternative splicing of regulatory factors in HeLa cells.Mol Genet Genomics. 2020 Jan;295(1):95-106. doi: 10.1007/s00438-019-01606-3. Epub 2019 Sep 5. Mol Genet Genomics. 2020. PMID: 31489484
-
Tristetraprolin specifically regulates the expression and alternative splicing of immune response genes in HeLa cells.BMC Immunol. 2019 May 2;20(1):13. doi: 10.1186/s12865-019-0292-1. BMC Immunol. 2019. PMID: 31046669 Free PMC article.
-
Mitochondrial transcription factor A regulates mitochondrial transcription initiation, DNA packaging, and genome copy number.Biochim Biophys Acta. 2012 Sep-Oct;1819(9-10):921-9. doi: 10.1016/j.bbagrm.2012.03.002. Epub 2012 Mar 21. Biochim Biophys Acta. 2012. PMID: 22465614 Review.
-
The mitochondrial transcription factor TFAM in neurodegeneration: emerging evidence and mechanisms.FEBS Lett. 2018 Mar;592(5):793-811. doi: 10.1002/1873-3468.12989. Epub 2018 Feb 15. FEBS Lett. 2018. PMID: 29364506 Free PMC article. Review.
Cited by
-
Gene Editing Technologies Targeting TFAM and Its Relation to Mitochondrial Diseases.Adv Exp Med Biol. 2023;1429:173-189. doi: 10.1007/978-3-031-33325-5_10. Adv Exp Med Biol. 2023. PMID: 37486522
-
Mitochondrial damage-associated molecular patterns in chronic obstructive pulmonary disease: Pathogenetic mechanism and therapeutic target.J Transl Int Med. 2022 Jun 10;11(4):330-340. doi: 10.2478/jtim-2022-0019. eCollection 2023 Dec. J Transl Int Med. 2022. PMID: 38130648 Free PMC article.
-
The functional role of CST1 and CCL26 in asthma development.Immun Inflamm Dis. 2024 Jan;12(1):e1162. doi: 10.1002/iid3.1162. Immun Inflamm Dis. 2024. PMID: 38270326 Free PMC article.
-
Cellular Immunity Is Critical for Assessing COVID-19 Vaccine Effectiveness in Immunocompromised Individuals.Front Immunol. 2022 May 26;13:880784. doi: 10.3389/fimmu.2022.880784. eCollection 2022. Front Immunol. 2022. PMID: 35693815 Free PMC article.
References
-
- Manoli I, Alesci S, Blackman MR, Su YA, Rennert OM, Chrousos GP. Mitochondria as key components of the stress response. Trends Endocrinol Metab. 2007;18(5):190–198. - PubMed
-
- Wang H, Li T, Chen S, Gu Y, Ye S. Neutrophil extracellular trap mitochondrial DNA and its autoantibody in systemic lupus erythematosus and a proof-of-concept trial of metformin. Arthritis Rheumatol. 2015;67(12):3190–3200. - PubMed
-
- Roers A, Hiller B, Hornung V. Recognition of endogenous nucleic acids by the innate immune system. Immunity. 2016;44(4):739–754. - PubMed
Publication types
MeSH terms
Substances
LinkOut - more resources
Full Text Sources
Medical
Molecular Biology Databases
