

Traditional chinese medicine syndromes classification associates with tumor cell and microenvironment heterogeneity in colorectal cancer: a single cell RNA sequencing analysis
- PMID: 34876190
- PMCID: PMC8650518
- DOI: 10.1186/s13020-021-00547-7
Traditional chinese medicine syndromes classification associates with tumor cell and microenvironment heterogeneity in colorectal cancer: a single cell RNA sequencing analysis
Abstract
Background: Colorectal cancer (CRC) is one of the common gastrointestinal malignancies, tumor heterogeneity is the main cause of refractory CRC. Syndrome differentiation is the premise of individualized treatment of traditional Chinese medicine (TCM), but TCM syndrome lacks objective identification in CRC. This study is to investigate the correlation and significance of tumor heterogeneity and TCM syndromes classification in CRC.
Methods: In this study, we using scRNA-seq technology, investigate the significance of tumor heterogeneity in TCM syndromes classification on CRC.
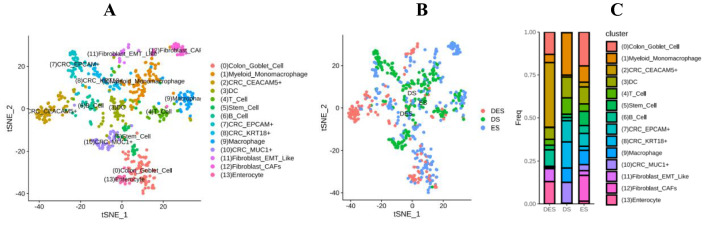
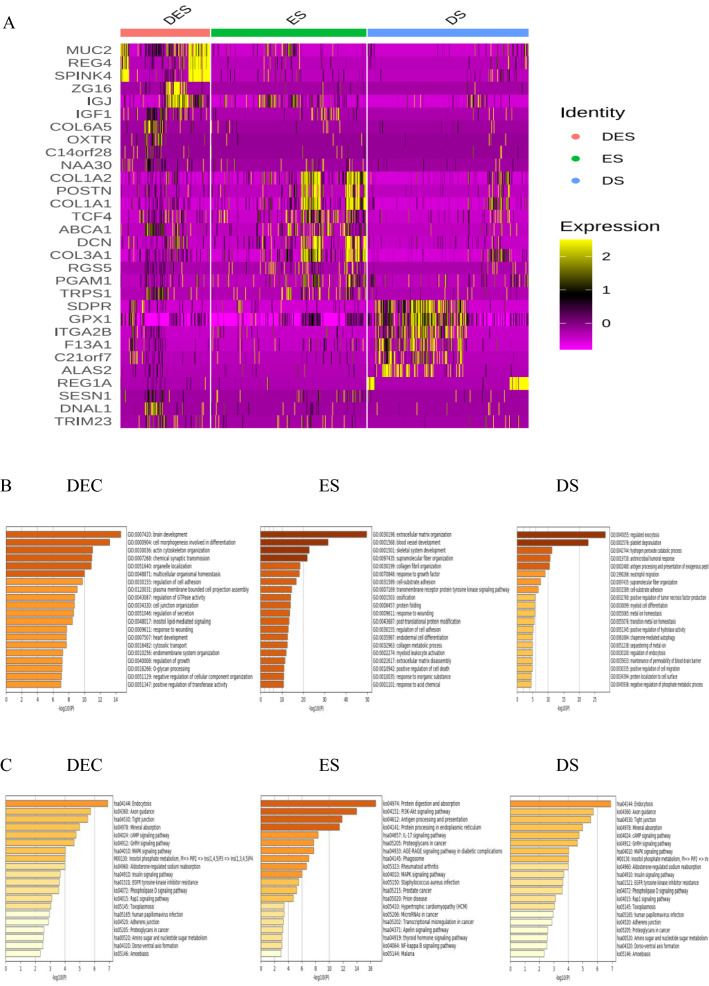
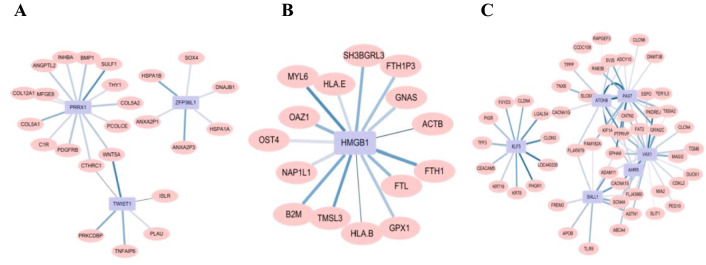
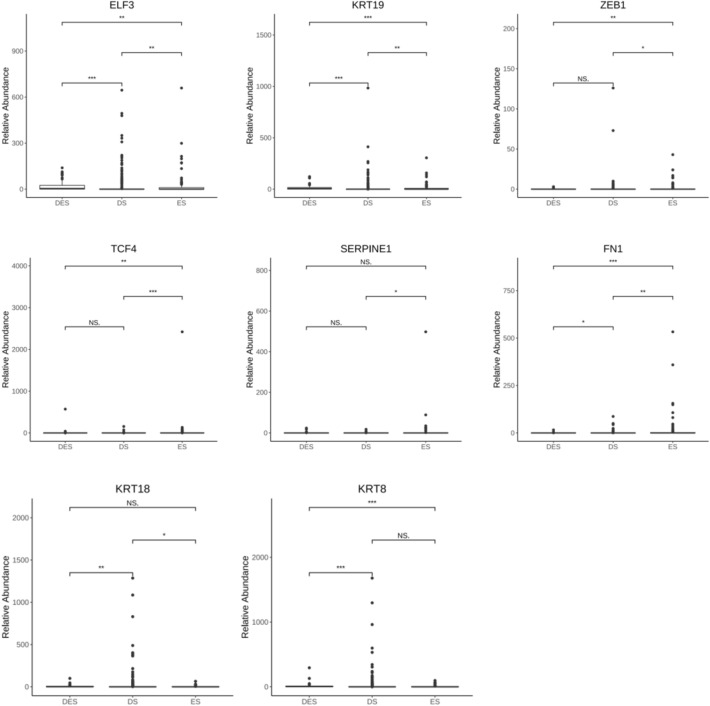
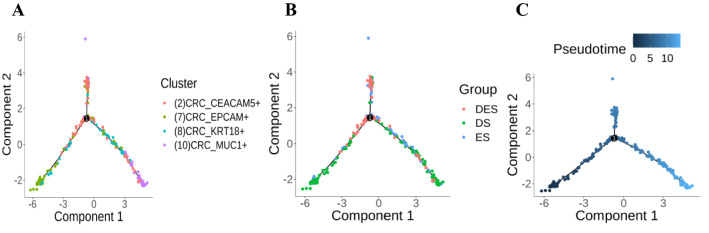
Results: The results showed that 662 cells isolated from 11 primary CRC tumors are divided into 14 different cell clusters, and each cell subtype and its genes have different functions and signal transduction pathways, indicating significant heterogeneity. CRC tumor cell clusters have different proportions in Excess, Deficiency and Deficiency-Excess syndromes, and have their own characteristic genes, gene co-expression networks, gene functional interpretations as well as monocle functional evolution. Moreover, there were significant differences between the high expressions of MUC2, REG4, COL1A2, POSTN, SDPR, GPX1, ELF3, KRT8, KRT18, KRT19, FN1, SERPINE1, TCF4 and ZEB1 genes in Excess and Deficiency syndrome classification in CRC (P < 0.01).
Conclusions: The Excess and Deficiency syndromes classification may be related to tumor heterogeneity and its microenvironment in CRC.
Keywords: Colorectal cancer; Excess and Deficiency syndromes classification; Single cell RNA sequencing; Tumor heterogeneity; Tumor microcirculation.
© 2021. The Author(s).
Conflict of interest statement
The authors declare that they have no competing interests.
Figures
Similar articles
-
Comparative analysis of immune function, hemorheological alterations and prognosis in colorectal cancer patients with different traditional Chinese medicine syndromes.Cancer Biomark. 2018 Feb 14;21(3):701-710. doi: 10.3233/CBM-170805. Cancer Biomark. 2018. PMID: 29171989
-
TCM syndrome differentiation in colorectal cancer patients assisted by differences in gut microbiota: An exploratory study.Heliyon. 2023 Oct 20;9(11):e21057. doi: 10.1016/j.heliyon.2023.e21057. eCollection 2023 Nov. Heliyon. 2023. PMID: 37928040 Free PMC article.
-
An exploratory study on TCM syndrome differentiation in preoperative patients with colorectal cancer assisted by laboratory indicators.Heliyon. 2022 Aug 14;8(8):e10207. doi: 10.1016/j.heliyon.2022.e10207. eCollection 2022 Aug. Heliyon. 2022. PMID: 36033259 Free PMC article.
-
Single-cell sequencing technology in colorectal cancer: a new technology to disclose the tumor heterogeneity and target precise treatment.Front Immunol. 2023 May 15;14:1175343. doi: 10.3389/fimmu.2023.1175343. eCollection 2023. Front Immunol. 2023. PMID: 37256123 Free PMC article. Review.
-
Research progress of colorectal cancer in genomic and transcriptomic at multi-level.Front Genet. 2025 May 30;16:1533817. doi: 10.3389/fgene.2025.1533817. eCollection 2025. Front Genet. 2025. PMID: 40520235 Free PMC article. Review.
Cited by
-
Progress of traditional Chinese medicine in the prevention and treatment of colorectal cancer.World J Gastrointest Oncol. 2025 Jun 15;17(6):105690. doi: 10.4251/wjgo.v17.i6.105690. World J Gastrointest Oncol. 2025. PMID: 40547140 Free PMC article. Review.
-
Novel prognostic model of complement and coagulation cascade-related genes correlates with immune environment and drug sensitivity in hepatocellular carcinoma.Heliyon. 2024 Sep 20;10(19):e38230. doi: 10.1016/j.heliyon.2024.e38230. eCollection 2024 Oct 15. Heliyon. 2024. PMID: 39391504 Free PMC article.
-
Pan-cancer analysis of CDKN2A alterations identifies a subset of gastric cancer with a cold tumor immune microenvironment.Hum Genomics. 2024 May 31;18(1):55. doi: 10.1186/s40246-024-00615-7. Hum Genomics. 2024. PMID: 38822443 Free PMC article.
-
Network pharmacology: towards the artificial intelligence-based precision traditional Chinese medicine.Brief Bioinform. 2023 Nov 22;25(1):bbad518. doi: 10.1093/bib/bbad518. Brief Bioinform. 2023. PMID: 38197310 Free PMC article. Review.
-
Investigating the effects and mechanisms of Erchen Decoction in the treatment of colorectal cancer by network pharmacology and experimental validation.Front Pharmacol. 2022 Oct 13;13:1000639. doi: 10.3389/fphar.2022.1000639. eCollection 2022. Front Pharmacol. 2022. PMID: 36313338 Free PMC article.
References
-
- Bray F, Ferlay J, Soerjomataram I, Siegel RL, Torre LA, Jemal A. Global cancer statistics 2018: GLOBOCAN estimates of incidence and mortality worldwide for 36 cancers in 185 countries. CA Cancer J Clin. 2018;68(6):394–424. - PubMed
Grants and funding
LinkOut - more resources
Full Text Sources
Research Materials
Miscellaneous
