. 2021 Dec 7;11(1):201.
doi: 10.1186/s13578-021-00710-5.

Catalase deficiency facilitates the shuttling of free fatty acid to brown adipose tissue through lipolysis mediated by ROS during sustained fasting

Affiliations

Catalase deficiency facilitates the shuttling of free fatty acid to brown adipose tissue through lipolysis mediated by ROS during sustained fasting

Raghbendra Kumar Dutta et al. Cell Biosci. .

Abstract

Background: Fatty acids (FA) derived from adipose tissue and liver serve as the main fuel in thermogenesis of brown adipose tissue (BAT). Catalase, a peroxisomal enzyme, plays an important role in maintaining intracellular redox homeostasis by decomposing hydrogen peroxide to either water or oxygen that oxidize and provide fuel for cellular metabolism. Although the antioxidant enzymatic activity of catalase is well known, its role in the metabolism and maintenance of energy homeostasis has not yet been revealed. The present study investigated the role of catalase in lipid metabolism and thermogenesis during nutrient deprivation in catalase-knockout (KO) mice.

Results: We found that hepatic triglyceride accumulation in KO mice decreased during sustained fasting due to lipolysis through reactive oxygen species (ROS) generation in adipocytes. Furthermore, the free FA released from lipolysis were shuttled to BAT through the activation of CD36 and catabolized by lipoprotein lipase in KO mice during sustained fasting. Although the exact mechanism for the activation of the FA receptor enzyme, CD36 in BAT is still unclear, we found that ROS generation in adipocytes mediated the shuttling of FA to BAT.

Conclusions: Taken together, our findings uncover the novel role of catalase in lipid metabolism and thermogenesis in BAT, which may be useful in understanding metabolic dysfunction.

Keywords: Catalase; Lipolysis; Reactive Oxygen species (ROS); Sustained fasting; Thermogenesis.


Conflict of interest statement

The authors have no competing interest to declare.

Figures
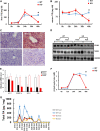
Fig. 1
Fig. 1
Catalase deficiency decreases the accumulation of lipid in liver during sustained fasting. Liver samples from mice fasted at the indicated time were homogenized, and TG levels were analyzed from A liver and B serum (n = 6). C Liver tissues from mice cryosectioned and stained with ORO. Scale bar represents 20 μm. D Immunoblot analysis of liver tissue. Protein expression using whole-cell lysates with the indicated antibodies (n = 3). E qPCR analysis of FA metabolism-related genes from the liver of mice fed and fasted for 48 h. F β-hydroxybutyrate was analyzed from the serum of mice fasted for indicated time. G GC–MS for total FA of long Chain and VLCFA from liver samples (n = 3). Values represent mean ± SD (n = 3, 4). *P < 0.001 WT 48 h fasting versus KO 48 h of fasting
Fig. 2
Fig. 2
Catalase deficiency during sustained fasting decreases the fat mass that augmented lipolysis in WAT. A Images of subcutaneous and gonadal (sWAT, gWAT) white adipose tissuefrom mice (n = 6). B Analytical weight of gWAT and sWAT in gram (g) C Representative H&E staining of WAT from mice. D Representative fluorescence images of WAT, fixed and immunostained with anti-PLIN1 (green) and DAPI (blue).Scale bar represents 20 μm. E FFA and F glycerol level from mice serum fasted for indicated time (n = 6). G Proteins were extracted from WAT and immunoblot analysis was performed using whole-cell lysates with the indicated antibodies (n = 3). H Total ROS was measured from WAT. Values represent mean ± SD (n = 3, 4). *P < 0.05 WT 48 h fasting versus KO 48 h of fasting
Fig. 3
Fig. 3
Catalase deficiency during sustained fasting increased BAT thermogenesis through mitochondrial activation. A Representative H&E staining of BAT from mice. Scale bar represents 20 μm. B Proteins were extracted from BAT of WT and KO mice and immunoblot analysis was performed using whole-cell lysates with the indicated antibodies (n = 3). α-Tubulin was used as a loading control. qPCR analysis of C UCP1 and D PGC-1α genes in BAT from mice. E Rectal body temperature was measured from mice fasted for indicated time (n = 6). F qPCR analysis of ADBR3. G, H Activities of mitochondrial complexes I and IV from BAT of mice. Details are described in Materials and Methods. I Total ROS was measured from BAT. Values represent mean ± SD (n = 3, 4). *P < 0.05 WT 48 h fasting versus KO 48 h of fasting
Fig. 4
Fig. 4
Catalase deficiency during sustained fasting facilitates the shuttling of free fatty acid to BAT through fatty acid receptor enzymes. A Proteins were extracted from BAT of mice fasted at indicated time and immunoblot analysis was performed using whole-cell lysates with indicated antibody (n = 2). B Isolated BAT from fasted mice at indicated time were homogenized and LPL activity was measured. qPCR analysis of C CD36, D LPL and E UCP1 in the BAT of mice fasted for indicated time. F Proteins were extracted from liver of mice fasted at indicated time and immunoblot analysis was performed using whole cell lysates with indicated antibodies (n = 2). G Isolated liver from fasted mice at indicated time were homogenized and LPL activity was measured. qPCR analysis of H CD36 and I LPL genes in liver of mice fasted for indicated time. Values represent mean ± SD (n = 3, 4). *P < 0.05 WT 48 h fasting versus KO 48 h of fasting; ##P < 0.001 WT 48 h fasting versus KO 48 h of fasting
Fig. 5
Fig. 5
ROS generation induced lipolysis was suppressed by N-Acetylcysteine in catalase deficient adipocytes. A Representative fluorescence images of primary white adipocytes treated as indicated and fluorescence were measured with DCFH-DA and examined under a fluorescence microscope. Scale bar represents 100 μm. B Percentage of cells showing green fluorescence (corresponding to DCFH-DA) and fluorescence intensity of adipocytes. ##P < 0.001 WT ISO vs KO ISO; #P < 0.001 KO ISO vs KO ISO + NAC. C Representative fluorescence images primary white adipocytes, fixed and immunostained with anti-PLIN1 (green), ORO (red), and DAPI (blue). Scale bar represents 5 μm. D The quantification of ORO positive cells in white adipocytes from C. *P < 0.05 WT nor vs WT ISO; WT ISO vs KO ISO; KO ISO vs KO ISO + NAC. E Serum glycerol; **P < 0.01 WT nor vs WT ISO; WT ISO vs KO ISO; KO ISO vs KO ISO + NAC and F FFA level in primary white adipocytes. *P < 0.05 WT nor vs WT ISO; WT ISO vs KO ISO; KO ISO vs KO ISO + NAC. G Proteins were extracted from treated adipocytes and immunoblot analysis was performed using whole-cell lysates with the indicated antibodies. Data represent mean ± SD of three independent experiments
Fig. 6
Fig. 6
UCP1 activation in brown adipocytes induced by ROS was suppressed by N-Acetylcysteine in catalase deficient adipocytes. A Representative fluorescence images primary brown adipocytes treated as indicated and fluorescence were measured with DCFH-DA and examined under a fluorescence microscope. Scale bar represents 100 μm. B Percentage of cells showing green fluorescence (corresponding to DCFH-DA) and fluorescence intensity of adipocytes. *P < 0.05 WT ISO vs KO ISO; **P < 0.001 KO ISO vs KO ISO + NAC C Proteins were extracted from treated adipocytes and immunoblot analysis was performed using whole cell lysates with the indicated antibodies. qPCR analysis of D UCP1: *P < 0.01 WT nor vs WT ISO; WT ISO vs KO ISO; KO ISO vs KO ISO + NAC. E PGC-1α: **P < 0.05 WT ISO vs KO ISO; KO ISO vs KO ISO + NAC and F PPARα in isolated brown adipocytes. Data represent mean ± SD of three independent experiments

Similar articles

Cited by

References

    1. Lee YK, Sohn JH, Han JS, Park YJ, Jeon YG, Ji Y, Dalen KT, Sztalryd C, Kimmel AR, Kim JB. Perilipin 3 deficiency stimulates thermogenic beige adipocytes through PPARα activation. Diabetes. 2018;67(5):791–804. - PMC - PubMed
    1. Heeren J, Scheja L. Brown adipose tissue and lipid metabolism. Curr Opin Lipidol. 2018;29(3):180–185. - PubMed
    1. Shan L, Yu XC, Liu Z, Hu Y, Sturgis LT, Miranda ML, Liu Q. The angiopoietin-like proteins ANGPTL3 and ANGPTL4 inhibit lipoprotein lipase activity through distinct mechanisms. J Biol Chem. 2009;284(3):1419–1424. - PMC - PubMed
    1. Finn PF, Dice JF. Proteolytic and lipolytic responses to starvation. Nutrition. 2006;22(7–8):830–844. - PubMed
    1. Lee JN, Dutta RK, Kim SG, Lim JY, Kim SJ, Choe SK, Yoo KW, Song SR, Park DS, So HS. Fenofibrate, a peroxisome proliferator-activated receptor α ligand, prevents abnormal liver function induced by a fasting-refeeding process. Biochem Biophys Res Commun. 2013;442(1–2):22–27. - PubMed