. 2021 Dec 8;37(1):33.
doi: 10.1186/s42826-021-00110-3.

Comparison of cisplatin-induced anti-tumor response in CT26 syngeneic tumors of three BALB/c substrains

Affiliations

Comparison of cisplatin-induced anti-tumor response in CT26 syngeneic tumors of three BALB/c substrains

Jeong Eun Gong et al. Lab Anim Res. .

Abstract

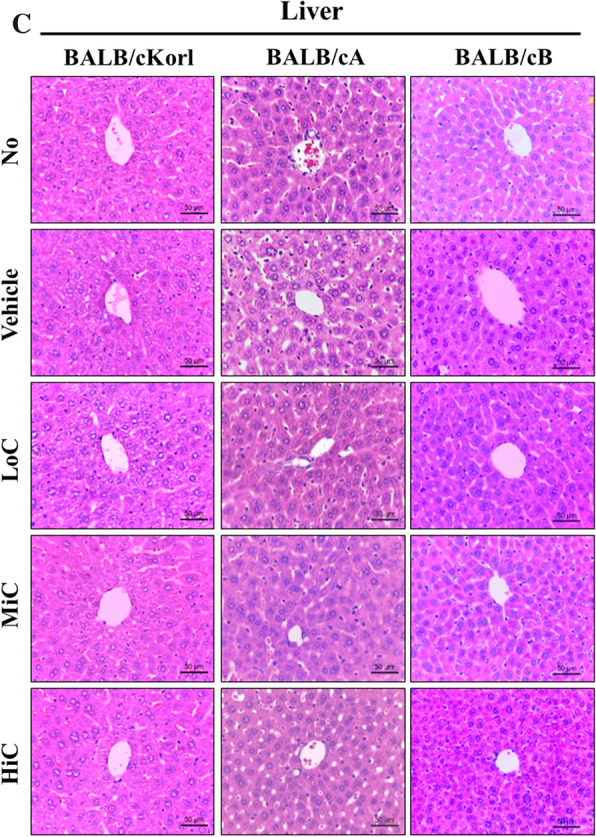
Background: To determine whether the background of BALB/c substrains affects the response to anti-tumor drugs, we measured for alterations in tumor growth, histopathological structure of the tumor, and expressions of tumor-related proteins in three BALB/c substrains derived from different sources (BALB/cKorl, BALB/cA and BALB/cB), after exposure to varying concentrations of cisplatin (0.1, 1 and 5 mg/kg).

Results: Cisplatin treatment induced similar responses for body and organ weights, serum analyzing factors, and blood analyzing factors in all BALB/c substrains with CT26 syngeneic tumor. Few differences were detected in the volume and histopathological structure of the CT26 tumor. Growth inhibition of CT26 tumors after exposure to cisplatin was greater in the BALB/cB substrain than BALB/cKorl and BALB/cA substrains, and a similar pattern was observed in the histopathological structure of tumors. However, the expression levels of other tumor-related factors, including Ki67, p27, p53, Bcl-2-associated X protein (Bax), B-cell lymphoma 2 (Bcl-2), caspase-3 (Cas-3), matrix metallopeptidase 2 (MMP2) and vascular endothelial growth factor (VEGF) proteins, were constantly maintained in the tumors of all three substrains after cisplatin treatment. A similar decrease pattern was observed for the expressions of inflammatory cytokines, including interleukin (IL)-1β, IL-6 and IL-10, in the CT26 tumors of the three BALB/c substrains.

Conclusions: Taken together, results of the present study indicate that the genetic background of the three BALB/c substrains has no major effect on the therapeutic responsiveness of cisplatin, except growth and histopathology of the CT26 syngeneic tumor.

Keywords: BALB/c; BALB/cKorl; CT26 colon cancer cell; Cisplatin; Substrains.


Conflict of interest statement

The authors declare that they have no conflict of interest.

Figures

Fig. 1
Fig. 1
Experimental scheme for CT26 cell injection and cisplatin treatment in the three BALB/c substrains. After subcutaneous injection of CT26 cells, the syngeneic model was intraperitoneally administered varying doses of cisplatin (0.1, 1 and 5 mg/kg) once the tumor size reached 150 mm2
Fig. 2
Fig. 2
CT26 tumor volume in the three BALB/c substrains treated with cisplatin. The size of solid tumor formed in the syngeneic model was measured using a caliper from days 1 to 14, although significant changes were detected from day 7 to day 14. Five to six mice per group were used for measurement of tumor size; the volume of tumor was calculated in duplicate for each tumor. Data represent the mean ± SD. *, p < 0.05 compared to the No treated group. #, p < 0.05 compared to the Vehicle treated group
Fig. 3
Fig. 3
The histopathological structure of CT26 tumor, kidney and liver. a Tumorigenic changes. After harvesting the CT26 tumors from the three BALB/c substrains, the histopathological images were obtained at 400 × magnification, from slide sections of tumor tissue stained with H&E solution. Various tumorigenic changes, such as spindle cells (white arrow), mitotic figures (yellow arrow), vacuolated tumor cells (blue arrow), hemorrhage (red circle), necrosis (green circle) and plumped cell (red arrow), were characterized by a pathologist, Dr. Sang Gu Lee. b Histopathological structure of kidney. Various tumorigenic changes, such as necrosis (white arrow) and tubular bashophilia (yellow arrow), were characterized by a pathologist, Dr. Sang Gu Lee. c Histopathological structure of liver. Five to six mice per group were used for preparation of tissue sections and H&E staining, and histopathological structure was analyzed in duplicate for each tumor
Fig. 3
Fig. 3
The histopathological structure of CT26 tumor, kidney and liver. a Tumorigenic changes. After harvesting the CT26 tumors from the three BALB/c substrains, the histopathological images were obtained at 400 × magnification, from slide sections of tumor tissue stained with H&E solution. Various tumorigenic changes, such as spindle cells (white arrow), mitotic figures (yellow arrow), vacuolated tumor cells (blue arrow), hemorrhage (red circle), necrosis (green circle) and plumped cell (red arrow), were characterized by a pathologist, Dr. Sang Gu Lee. b Histopathological structure of kidney. Various tumorigenic changes, such as necrosis (white arrow) and tubular bashophilia (yellow arrow), were characterized by a pathologist, Dr. Sang Gu Lee. c Histopathological structure of liver. Five to six mice per group were used for preparation of tissue sections and H&E staining, and histopathological structure was analyzed in duplicate for each tumor
Fig. 4
Fig. 4
IF assays for Ki67 protein. a After IF staining, the green fluorescence was observed at a fluorescent microscope. b The number of Ki67 positive cells were measured within 67,500 μm2 of the CT26 tumor section, and results are shown as a percentage of control. Two to three tumors per group were used in the preparation of the Ki67 stained sample, and the number of Ki67 positive cells was counted in duplicate for each sample. The data are reported as the means ± SD. *, p < 0.05 relative to the No treated group. #, p < 0.05 compared to the Vehicle treated group
Fig. 5
Fig. 5
Expression analysis of p53 and p27 proteins. Expression levels of p53 and p27 proteins were determined in CT26 tumors of the three cisplatin-treated BALB/c substrains, using specific antibodies and an imaging densitometer. The levels of each protein are presented relative to the intensity of actin. Two to three tumors per group were used to prepare the total tumor homogenate, and Western blot analysis was assayed in duplicate for each sample. The data are reported as the means ± SD. *, p < 0.05 relative to the No treated group. #, p < 0.05 compared to the Vehicle treated group
Fig. 6
Fig. 6
Expression analysis of Bax, Bcl-2 and Cas-3 proteins. Expression levels of Bax, Bcl-2 and Cas-3 proteins were determined in CT26 tumors of the three cisplatin-treated BALB/c substrains, using the specific antibodies and an imaging densitometer. Levels of each protein are presented relative to the intensity of actin. Two to three tumors per group were used to prepare the total tumor homogenate, and Western blot analysis was assayed in duplicate for each sample. The data are reported as the means ± SD. *, p < 0.05 relative to the No treated group. #, p < 0.05 compared to the Vehicle treated group
Fig. 7
Fig. 7
Expression analysis of MMP2 and VEGF protein. Expression levels of MMP2 and VEGF protein were determined in CT26 tumors of the three cisplatin-treated BALB/c substrains, using the specific antibodies and an imaging densitometer. Levels of each protein are presented relative to the intensity of actin. Two to three tumors per group were used to prepare the total tumor homogenate, and Western blot analysis was assayed in duplicate for each sample. The data are reported as the means ± SD. *, p < 0.05 relative to the No treated group. #, p < 0.05 compared to the Vehicle treated group
Fig. 8
Fig. 8
Transcription level of inflammatory cytokines. After collection of total RNA from CT26 tumor of the three cisplatin-treated BALB/c substrains, the mRNA levels of IL-1β, IL-6 and IL-10 genes were measured by quantitative realtime – polymerase chain reaction (RT-qPCR), as described in materials and methods. Two to three tumors per group were used to prepare the total RNA, and RT-qPCR analysis was assayed in duplicate for each sample. The data are reported as the means ± SD. *, p < 0.05 relative to the No treated group. #, p < 0.05 compared to the Vehicle treated group

Similar articles

References

    1. Potter M. History of the BALB/c family. Curr Top Microbiol Immunol. 1985;122:1–5. - PubMed
    1. Coletti D, Berardi E, Aulino P, Rossi E, Moresi V, Li Z, Adamo S. Substrains of inbred mice differ in their physical activity as a behavior. Sci World J. 2013;2013:237260. doi: 10.1155/2013/237260. - DOI - PMC - PubMed
    1. Hilgers J, van Nie R, Iványi D, Hilkens J, Michalides R, de Moes J, et al. Genetic differences in BALB/c sublines. Curr Top Microbiol Immunol. 1985;122:19–30. - PubMed
    1. Velez L, Sokoloff G, Miczek KA, Palmer AA, Dulawa SC. Differences in aggressive behavior and DNA copy number variants between BALB/cJ and BALB/cByJ substrains. Behav Genet. 2010;40:201–210. doi: 10.1007/s10519-009-9325-5. - DOI - PMC - PubMed
    1. Kang MJ, Gong JE, Kim JE, Choi HJ, Bae SJ, Choi YJ, et al. Influence of three BALB/c substrain backgrounds on the skin tumor induction efficacy to DMBA and TPA cotreatment. Lab Anim Res. 2020;36:30. doi: 10.1186/s42826-020-00063-z. - DOI - PMC - PubMed