. 2022 Feb 2;42(5):877-893.
doi: 10.1523/JNEUROSCI.1303-21.2021. Epub 2021 Dec 7.

Distinct Contribution of Granular and Agranular Subdivisions of the Retrosplenial Cortex to Remote Contextual Fear Memory Retrieval

Affiliations

Distinct Contribution of Granular and Agranular Subdivisions of the Retrosplenial Cortex to Remote Contextual Fear Memory Retrieval

Tsung-Chih Tsai et al. J Neurosci. .

Abstract

The retrieval of recent and remote memories are thought to rely on distinct brain circuits and mechanisms. The retrosplenial cortex (RSC) is robustly activated during the retrieval of remotely acquired contextual fear memories (CFMs), but the contribution of particular subdivisions [granular (RSG) vs agranular retrosplenial area (RSA)] and the circuit mechanisms through which they interact to retrieve remote memories remain unexplored. In this study, using both anterograde and retrograde viral tracing approaches, we identified excitatory projections from layer 5 pyramidal neurons of the RSG to the CA1 stratum radiatum/lacunosum-moleculare of the dorsal hippocampus and the superficial layers of the RSA in male mice. We found that chemogenetic or optogenetic inhibition of the RSG-to-CA1, but not the RSG-to-RSA, pathway selectively impairs the retrieval of remote CFMs. Collectively, our results uncover a specific role for the RSG in remote CFM recall and provide circuit evidence that RSG-mediated remote CFM retrieval relies on direct RSG-to-CA1 connectivity. The present study provides a better understanding of brain circuit mechanisms underlying the retrieval of remote CFMs and may help guide the development of therapeutic strategies to attenuate remote traumatic memories that lead to mental health issues such as post-traumatic stress disorder.SIGNIFICANCE STATEMENT The RSC is implicated in contextual information processing and remote recall. However, how different subdivisions of the RSC and circuit mechanisms through which they interact to underlie remote memory recall remain unexplored. This study shows that granular subdivision of the RSC and its input to hippocampal area CA1 contributes to the retrieval of remote contextual fear memories. Our results support the hypothesis that the RSC and hippocampus require each other to preserve fear memories and may provide a novel therapeutic avenue to attenuate remote traumatic memories in patients with post-traumatic stress disorder.

Keywords: CA1; agranular retrosplenial cortex; contextual fear memory; granular retrosplenial cortex; memory retrieval; remote memory.


Figures

Figure 1.
Figure 1.
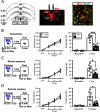
The RSC is required for the acquisition and retrieval of recent and remote CFMs. A, Left, Schematic coronal sections (between bregma −2.30 and −1.82 mm) showing the intra-RSC injection sites of vehicle (Veh; gray circle) and muscimol-bodipy (Mus; red circle) for mice tested. Middle, A representative image of Mus expression in the RSC. Scale bar, 200 µm. Right, Magnification of boxed area (left) showing overlap between Mus (red) and NeuN (green). Scale bar, 20 µm. B, Left, Schematic representation of the experimental design. Mice were bilaterally injected into the RSC with Veh (PBS, 0.5 µl/side) or Mus (50 ng/0.5 µl/side) 15 min before CFC training (3 CS × US paired training). Middle, The learning curve for three acquisition trials of CFC training for Veh- and Mus-treated mice (Veh, n = 6; Mus, n = 6; interaction (trial × treatment): F(3,40) = 0.28, p = 0.84; trial variable: F(3,40) = 28.43, p < 0.001; treatment variable: F(1,40) = 1.03, p = 0.32; two-way ANOVA). Right, Summary bar graphs depicting the fear memory retention test at 1 d after receiving CFC training in Veh- and Mus-treated mice (t(10) = 5.55, p = 0.0002, unpaired two-tailed Student's t test). The freezing behavior during 3 min of context exposure before training was measured as baseline. C, Left, Schematic representation of the experimental design. Mice were bilaterally injected into the RSC with Veh or Mus 15 min before the retrieval of recent (1 d) CFMs. Middle, The learning curve for three acquisition trials of CFC training in mice receiving Veh or Mus before retrieval test (Veh, n = 7; Mus, n = 7; interaction (trial × treatment): F(3,48) = 0.07, p = 0.97; trial variable: F(3,48) = 19.20, p < 0.001; treatment variable: F(1,48) = 0.22, p = 0.64; two-way ANOVA). Right, Summary bar graphs depicting the fear memory retention test 1 d after CFC training in mice receiving Veh or Mus treatment 15 min before retrieval test (t(12) = 2.49, p = 0.029, unpaired two-tailed Student's t test). D, Left, Schematic representation of the experimental design. Mice were bilaterally injected into the RSC with Veh or Mus 15 min before the retrieval of remote (14 d) CFMs. Middle, The learning curve for three acquisition trials of CFC training in mice receiving Veh or Mus before retrieval test (Veh, n = 7; Mus, n = 7; interaction (trial × treatment): F(3,48) = 0.48, p = 0.70; trial variable: F(3,48) = 18.78, p < 0.001; treatment variable: F(1,48) = 0.46, p = 0.50; two-way ANOVA). Right, Summary bar graphs depicting the fear memory retention test 14 d after CFC training in mice receiving Veh or Mus treatment 15 min before retrieval test (t(12) = 3.04, p = 0.01, unpaired two-tailed Student's t test). Data are presented as mean ± SEM; *p < 0.05 and ***p < 0.001.
Figure 2.
Figure 2.
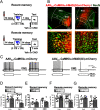
c-fos Expression in the RSG following the retrieval of recent and remote CFMs. A, Left, Schematic representation of the experimental design. Right, Summary bar graphs depicting the fear memory retention test in unshocked control and pairing groups 1 d after CFC training (unshocked, n = 5; pairing, n = 5; t(8) = 19.46, p < 0.001, unpaired two-tailed Student's t test). B, Left, Schematic representation of the experimental design. Right, Summary bar graphs depicting the fear memory retention test in unshocked control and pairing groups 14 d after CFC training (unshocked, n = 5; pairing, n = 5; t(8) = 13.45, p < 0.001, unpaired two-tailed Student's t test). C, Representative images of c-fos labeling in RSG layer 5 neurons from unshocked control and pairing mice 90 min after remote (14 d) memory retrieval test. Scale bar, 200 µm. Right, Magnification of boxed area (left) showing c-fos-expressing RSG cells colocalized with a neuronal marker, NeuN. Scale bar, 20 µm. D, Summary graphs depicting the percentage of c-fos+/NeuN+ cells in the RSG from unshocked control and pairing mice 90 min after recent (1 d) memory retrieval test (unshocked, n = 5; pairing, n = 5; t(8) = 4.34, p = 0.003, unpaired two-tailed Student's t test). E, Summary graphs depicting the percentage of c-fos+/NeuN+ cells in the RSG from unshocked control and pairing mice 90 min after remote memory retrieval test (unshocked, n = 5; pairing, n = 5; t(8) = 4.17, p = 0.003, unpaired two-tailed Student's t test). Data indicate mean ± SEM; **p < 0.01 and ***p < 0.001.
Figure 3.
Figure 3.
Inactivation of the RSG impairs the retrieval of remote CFMs. A, Schematic representation of the experimental design. Two weeks after stereotaxic injection of AAVDJ-hSyn-hM4D(Gi)-mCherry or AAVDJ-hSyn-mCherry into the RSG or RSA, mice were trained in a CFC paradigm, and memory retention was tested 1 d (recent) or 14 d (remote) after training. Mice were injected intraperitoneally with vehicle (Veh) or CNO (3 mg/kg) 30 min before the retrieval test. B, Schematic coronal sections (between bregma −2.54 and −1.82 mm) showing the intra-RSG and intra-RSA injection sites of viral vectors for mice tested. C, Representative images showing the expression of hSyn-hM4D(Gi)-mCherry in the RSG and RSA. Scale bars: 200 µm (top); 20 µm (rectangle amplification, bottom). D, Representative traces showing responses of uninfected (hM4D(Gi)) and infected (hM4D(Gi)+) neurons to depolarizing current pulse (200 pA) under whole-cell current clamp before and after bath application of CNO (50 μm) in the ex vivo RSG slices. E, Summary of experiments showing the effects of systemic Veh and CNO injections on the retrieval of recent CFMs in mice that received bilateral injections of AAVDJ-hSyn-hM4D(Gi)-mCherry or AAVDJ-hSyn-mCherry into the RSG (hM4D(Gi) + Veh, n = 8; mCherry + CNO, n = 8; hM4D(Gi) + CNO, n = 8; F(2,21) = 3.17, p = 0.06, one-way ANOVA). F, Summary of experiments showing the effects of systemic Veh and CNO injections on the retrieval of recent CFMs in mice that received bilateral injections of AAVDJ-hSyn-hM4D(Gi)-mCherry or AAVDJ-hSyn-mCherry into the RSA (hM4D(Gi) + Veh, n = 9; mCherry + CNO, n = 8; hM4D(Gi) + CNO, n = 10; F(2,24) = 1.92, p = 0.17, one-way ANOVA). G, Summary of experiments showing the effects of systemic Veh and CNO injections on the retrieval of remote CFMs in mice that received bilateral injections of AAVDJ-hSyn-hM4D(Gi)-mCherry or AAVDJ− hSyn-mCherry into the RSG (hM4D(Gi) + Veh, n = 8; mCherry + CNO, n = 8; hM4D(Gi) + CNO, n = 8; F(2,21) = 23.30, p < 0.0001, one-way ANOVA followed by Bonferroni's post hoc test). H, Summary of experiments showing the effects of systemic Veh and CNO injections on the retrieval of remote CFMs in mice that received bilateral injections of AAVDJ-hSyn-hM4D(Gi)-mCherry or AAVDJ-hSyn-mCherry into the RSA (hM4D(Gi) + Veh, n = 8; mCherry + CNO, n = 8; hM4D(Gi) + CNO, n = 10; F(2,23) = 2.76, p = 0.08, one-way ANOVA). Data indicate mean ± SEM; ***p < 0.001.
Figure 4.
Figure 4.
Validation of CNO/hM4D(Gi)-mediated inhibition of RSG or RSA neurons. A, Representative images of c-fos labeling in RSG layer 5 neurons from AAVDJ-hSyn-mCherry + CNO and AAVDJ-hSyn-hM4D(Gi)-mCherry + CNO mice 90 min after remote memory retrieval test. Scale bar, 200 µm. Right, Augmented figures showing c-fos-expressing RSG neurons in rectangle area. Scale bar, 20 µm. B, Summary graphs depicting the percentages of c-fos+/mCherry+ (left) and mCherry+/NeuN+ (right) cells in the RSG from AAVDJ-hSyn-hM4D(Gi)-mCherry + Veh (n = 5), AAVDJ-hSyn-mCherry + CNO (n = 5), and AAVDJ-hSyn-hM4D(Gi)-mCherry + CNO (n = 5) mice 90 min after recent memory retrieval test (c-fos+/mCherry+: F(2,12) = 20.58, p = 0.0001, one-way ANOVA followed by Bonferroni's post hoc test; mCherry+/NeuN+: F(2,12) = 1.64, p = 0.23, one-way ANOVA). C, Summary graphs depicting the percentages of c-fos+/mCherry+ (left) and mCherry+/NeuN+ (right) cells in the RSA from AAVDJ-hSyn-hM4D(Gi)-mCherry + Veh (n = 5), AAVDJ-hSyn-mCherry + CNO (n = 5), and AAVDJ-hSyn-hM4D(Gi)-mCherry + CNO (n = 5) mice 90 min after recent memory retrieval test (c-fos+/mCherry+: F(2,12) = 7.19, p = 0.009, one-way ANOVA followed by Bonferroni's post hoc test; mCherry+/NeuN+: F(2,12) = 1.90, p = 0.19, one-way ANOVA). D, Summary graphs depicting the percentages of c-fos+/mCherry+ (left) and mCherry+/NeuN+ (right) cells in the RSG from AAVDJ-hSyn-hM4D(Gi)-mCherry + Veh (n = 5), AAVDJ-hSyn-mCherry + CNO (n = 5), and AAVDJ-hSyn-hM4D(Gi)-mCherry + CNO (n = 5) mice 90 min after remote memory retrieval test (c-fos+/mCherry+: F(2,12) = 53.28, p < 0.0001, one-way ANOVA followed by Mann–Whitney U test; mCherry+/NeuN+: F(2,12) = 0.30, p = 0.75, one-way ANOVA). E, Summary graphs depicting the percentages of c-fos+/mCherry+ (left) and mCherry+/NeuN+ (right) cells in the RSA from AAVDJ-hSyn-hM4D(Gi)-mCherry + Veh (n = 5), AAVDJ-hSyn-mCherry + CNO (n = 5), and AAVDJ-hSyn-hM4D(Gi)-mCherry + CNO (n = 5) mice 90 min after remote memory retrieval test (c-fos+/mCherry+: F(2,12) = 12.66, p = 0.001, one-way ANOVA followed by Mann–Whitney U test; mCherry+/NeuN+: F(2,12) = 0.77, p = 0.49, one-way ANOVA). Data indicate mean ± SEM; **p < 0.01 and ***p < 0.001.
Figure 5.
Figure 5.
Chemogenetic silencing of excitatory neurons in the RSG impairs the retrieval of recent and remote CFMs. A, Schematic representation of the experimental design. Two weeks after stereotaxic injection of AAVDJ-CaMKIIα-hM4D(Gi)-mCherry or AAVDJ-CaMKIIα-mCherry into the RSG or RSA, mice were trained in a CFC paradigm, and memory retention was tested 1 d (recent) or 14 d (remote) after training. Mice were injected intraperitoneally with vehicle (Veh) or CNO (3 mg/kg) 30 min before the retrieval test. B, Representative images showing the expression of CaMKIIα-hM4D(Gi)-mCherry in the RSG and RSA. Scale bars: 200 µm (top); 20 µm (rectangle amplification, bottom). C, Representative traces showing responses of uninfected (hM4D(Gi)) and infected (hM4D(Gi)+) neurons to depolarizing current pulse (200 pA) under whole-cell current clamp before and after bath application of CNO (50 μm) in the ex vivo RSG slices. D, Summary of experiments showing the effects of systemic Veh and CNO injections on the retrieval of recent CFMs in mice that received bilateral injections of AAVDJ-CaMKIIα-hM4D(Gi)-mCherry or AAVDJ-CaMKIIα-mCherry into the RSG [mCherry + Veh, n = 7; hM4D(Gi) + Veh, n = 7; mCherry + CNO, n = 7; hM4D(Gi) + CNO, n = 7; interaction (treatment × drug): F(1,24) = 5.72, p = 0.025; treatment variable: F(1,24) = 8.12, p = 0.009; drug variable: F(1,24) = 2.48, p = 0.13; two-way ANOVA followed by Bonferroni's post hoc test]. E, Summary of experiments showing the effects of systemic Veh and CNO injections on the retrieval of recent CFMs in mice that received bilateral injections of AAVDJ-CaMKIIα-hM4D(Gi)-mCherry or AAVDJ-CaMKIIα-mCherry into the RSA [mCherry + Veh, n = 8; hM4D(Gi) + Veh, n = 8; mCherry + CNO, n = 8; hM4D(Gi) + CNO, n = 8; interaction (treatment × drug): F(1,28) = 0.4499, p = 0.51; treatment variable: F(1,28) = 1.48, p = 0.23; drug variable: F(1,28) = 0.96, p = 0.33; two-way ANOVA]. F, Summary of experiments showing the effects of systemic Veh and CNO injections on the retrieval of remote CFMs in mice that received bilateral injections of AAVDJ-CaMKIIα-hM4D(Gi)-mCherry or AAVDJ-CaMKIIα-mCherry into the RSG [mCherry + Veh, n = 11; hM4D(Gi) + Veh, n = 13; mCherry + CNO, n = 13; hM4D(Gi) + CNO, n = 11; interaction (treatment × drug): F(1,44) = 10.66, p = 0.002; treatment variable: F(1,44) = 14.36, p < 0.001; drug variable: F(1,44) = 2.62, p = 0.11; two-way ANOVA followed by Bonferroni's post hoc test]. G, Summary of experiments showing the effects of systemic Veh and CNO injections on the retrieval of remote CFMs in mice that received bilateral injections of AAVDJ-CaMKIIα-hM4D(Gi)-mCherry or AAVDJ-CaMKIIα-mCherry into the RSA [mCherry + Veh, n = 8; hM4D(Gi) + Veh, n = 8; mCherry + CNO, n = 8; hM4D(Gi) + CNO, n = 8; interaction (treatment × drug): F(1,28) = 0.003, p = 0.95; treatment variable: F(1,28) = 2.70, p = 0.11; drug variable: F(1,28) = 2.15, p = 0.15; two-way ANOVA]. Data indicate mean ± SEM; *p < 0.05, **p < 0.01, and ***p < 0.001.
Figure 6.
Figure 6.
Validation of CNO/hM4D(Gi)-mediated inhibition of RSG or RSA CaMKIIα-expressing excitatory neurons. A, Representative images of c-fos labeling in RSG layer 5 CaMKIIα-expressing excitatory neurons from AAVDJ-CaMKIIα-mCherry + CNO and AAVDJ-CaMKIIα- hM4D(Gi)-mCherry + CNO mice 90 min after remote memory retrieval test. Scale bar, 200 µm. Right, Augmented figures showing c-fos-expressing RSG neurons in rectangle area. Scale bar, 20 µm. B, Summary graphs depicting the percentages of c-fos+/mCherry+ (left) and mCherry+/NeuN+ (right) cells in the RSG from AAVDJ-CaMKIIα-mCherry + CNO (n = 5) and AAVDJ-CaMKIIα-hM4D(Gi)-mCherry + CNO (n = 5) mice 90 min after recent memory retrieval test (c-fos+/mCherry+: t(8) = 2.9, p = 0.02, unpaired Student's t test; mCherry+/NeuN+: t(8) = 0.4, p = 0.67, unpaired Student's t test). C, Summary graphs depicting the percentages of c-fos+/mCherry+ (left) and mCherry+/NeuN+ (right) cells in the RSA from AAVDJ-CaMKIIα-mCherry + CNO (n = 5) and AAVDJ-CaMKIIα-hM4D(Gi)-mCherry + CNO (n = 5) mice 90 min after recent memory retrieval test (c-fos+/mCherry+: t(8) = 8.2, p < 0.0001, unpaired Student's t test; mCherry+/NeuN+: t(8) = 1.8, p = 0.10, unpaired Student's t test). D, Summary graphs depicting the percentages of c-fos+/mCherry+ (left) and mCherry+/NeuN+ (right) cells in the RSG from AAVDJ-CaMKIIα-mCherry + CNO (n = 5) and AAVDJ-CaMKIIα-hM4D(Gi)-mCherry + CNO (n = 5) mice 90 min after remote memory retrieval test (c-fos+/mCherry+: t(8) = 7.3, p < 0.0001, unpaired Student's t test; mCherry+/NeuN+: t(8) = 0.4, p = 0.71, unpaired Student's t test). E, Summary graphs depicting the percentages of c-fos+/mCherry+ (left) and mCherry+/NeuN+ (right) cells in the RSA from AAVDJ-CaMKIIα-mCherry + CNO (n = 5) and AAVDJ-CaMKIIα-hM4D(Gi)-mCherry + CNO (n = 5) mice 90 min after remote memory retrieval test (c-fos+/mCherry+: t(8) = 6.0, p = 0.0003, unpaired Student's t test; mCherry+/NeuN+: t(8) = 0.3, p = 0.80, unpaired Student's t test). Data indicate mean ± SEM; *p < 0.05 and ***p < 0.001.
Figure 7.
Figure 7.
Chemogenetic activation of GABAergic neurons in the RSG impairs the retrieval of remote CFMs. A, Schematic representation of the experimental design. Two weeks after stereotaxic injection of AAVDJ-Dlx-hM3D(Gq)-GFP or AAVDJ-Dlx-GFP into the RSG or RSA, mice were trained in a CFC paradigm, and memory retention was tested 1 d (recent) or 14 d (remote) after training. Mice were injected intraperitoneally with vehicle (Veh) or CNO (3 mg/kg) 30 min before the retrieval test. B, Representative images showing the expression of Dlx-hM3D(Gq)-GFP in the RSG and RSA. Scale bars: 200 µm (top) and 20 µm (rectangle amplification, bottom). C, Representative traces showing responses of uninfected (hM3D(Gq)) and infected (hM3D(Gq)+) neurons to depolarizing current pulse (200 pA) under whole-cell current clamp before and after bath application of CNO (50 μm) in the ex vivo RSG slices. D, Summary of experiments showing the effects of systemic Veh and CNO injections on the retrieval of recent CFMs in mice that received bilateral injections of AAVDJ-Dlx-hM3D(Gq)-GFP or AAVDJ-Dlx-GFP into the RSG [GFP + Veh, n = 8; hM3D(Gq) + Veh, n = 8; GFP + CNO, n = 8; hM3D(Gq) + CNO, n = 8; interaction (treatment × drug): F(1,28) = 0.28, p = 0.60; treatment variable: F(1,28) = 0.003, p = 0.95; drug variable: F(1,28) = 2.15, p = 0.58; two-way ANOVA]. E, Summary of experiments showing the effects of systemic Veh and CNO injections on the retrieval of recent CFMs in mice that received bilateral injections of AAVDJ-Dlx-hM3D(Gq)-GFP or AAVDJ-Dlx-GFP into the RSA [GFP + Veh, n = 8; hM3D(Gq) + Veh, n = 8; GFP + CNO, n = 8; hM3D(Gq) + CNO, n = 8; interaction (treatment × drug): F(1,28) = 0.057, p = 0.81; treatment variable: F(1,28) = 0.70, p = 0.41; drug variable: F(1,28) = 0.14, p = 0.71; two-way ANOVA]. F, Summary of experiments showing the effects of systemic Veh and CNO injections on the retrieval of remote CFMs in mice that received bilateral injections of AAVDJ-Dlx-hM3D(Gq)-GFP or AAVDJ-Dlx-GFP into the RSG [GFP + Veh, n = 9; hM3D(Gq) + Veh, n = 9; GFP + CNO, n = 9; hM3D(Gq) + CNO, n = 9; interaction (treatment × drug): Interaction: F(1,32) = 12.56, p = 0.001; treatment variable: F(1,32) = 7.06, p = 0.012; drug variable: F(1,32) = 2.62, p = 0.12; two-way ANOVA followed by Bonferroni's post hoc test]. G, Summary of experiments showing the effects of systemic Veh and CNO injections on the retrieval of remote CFMs in mice that received bilateral injections of AAVDJ-Dlx-hM3D(Gq)-GFP or AAVDJ-Dlx-GFP into the RSA [GFP + Veh, n = 8; hM3D(Gq) + Veh, n = 8; GFP + CNO, n = 8; hM3D(Gq) + CNO, n = 8; interaction (treatment × drug): F(1,28) = 0.004, p = 0.95; treatment variable: F(1,28) = 5.83, p = 0.023; drug variable: F(1,28) = 0.55, p = 0.46; Two-way ANOVA]. Data indicate mean ± SEM; **p < 0.01 and ***p < 0.001.
Figure 8.
Figure 8.
Validation of CNO/hM3D(Gq)-mediated activation of RSG or RSA Dlx-expressing GABAergic neurons. A, Representative images of c-fos labeling in RSG layer 5 neurons from AAVDJ-Dlx-GFP + CNO and AAVDJ-Dlx-hM3D(Gq)-GFP + CNO mice 90 min after remote memory retrieval test. Scale bar, 200 µm. Augmented figures (right) showing c-fos-expressing neurons in rectangle area. Scale bar, 20 µm. B, Summary graphs depicting the percentages of c-fos+/GFP/DAPI+ (left) and GFP+/DAPI+ (right) cells in the RSG from AAVDJ-Dlx-GFP + CNO (n = 5) and AAVDJ-Dlx-hM3D(Gq)-GFP + CNO (n = 5) mice 90 min after recent memory retrieval test (c-fos+/GFP/DAPI+: p = 0.008, Mann–Whitney U test; GFP+/DAPI+: t(8) = 1.0, p < 0.34, unpaired Student's t test). C, Summary graphs depicting the percentages of c-fos+/GFP/DAPI+ (left) and GFP+/DAPI+ (right) cells in the RSA from AAVDJ-Dlx-GFP + CNO (n = 5) and AAVDJ-Dlx-hM3D(Gq)-GFP + CNO (n = 5) mice 90 min after recent memory retrieval test (c-fos+/GFP/DAPI+: t(8) = 2.0, p = 0.08, unpaired Student's t test; GFP+/DAPI+: t(8) = 1.1, p = 0.31, unpaired Student's t test). D, Summary graphs depicting the percentages of c-fos+/GFP/DAPI+ (left) and GFP+/DAPI+ (right) cells in the RSG from AAVDJ-Dlx-GFP + CNO (n = 5) and AAVDJ-Dlx-hM3D(Gq)-GFP + CNO (n = 5) mice 90 min after remote memory retrieval test (c-fos+/GFP/DAPI+: t(8) = 4.0, p = 0.004, unpaired Student's t test; GFP+/DAPI+: t(8) = 0.5, p = 0.62, unpaired Student's t test). E, Summary graphs depicting the percentages of c-fos+/GFP/DAPI+ (left) and GFP+/DAPI+ (right) cells in the RSA from AAVDJ-Dlx-GFP + CNO (n = 5) and AAVDJ-Dlx-hM3D(Gq)-GFP + CNO (n = 5) mice 90 min after remote memory retrieval test (c-fos+/GFP/DAPI+: t(8) = 2.9, p = 0.02, unpaired Student's t test; GFP+/DAPI+: t(8) = 0.9, p = 0.41, unpaired Student's t test). Data indicate mean ± SEM; *p < 0.05 and **p < 0.01.
Figure 9.
Figure 9.
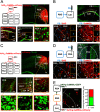
Distinct projection patterns of the RSA and RSG. A, Left, AAVDJ-CaMKIIα-mCherry was injected into the RSG (top). Right, mCherry signals (red) were expressed in RSG neurons under the control of CaMKIIα promoter (top). Scale bar, 200 μm. The mCherry signals of axonal projections were observed in the CA1 SRLM (left and middle, bottom) and RSA layer 2 area (right, bottom). Scale bar, 100 μm. Right, Magnified image of rectangle (bottom). Scale bar, 20 μm. Sections were costained with NeuN (green). SO, Stratum oriens; SP, stratum pyramidale; SR, stratum radiatum; SLM, stratum lacunosum moleculare. Data were replicated in four mice. B, Left, Fluorogold (FG, 4%) was injected into the dorsal CA1 area (top). Right, FG signal (gray) was expressed in pyramidal cell layer of the dorsal CA1 (top). Scale bar, 100 μm. Bottom, The FG + cell bodies (blue and indicated by blue arrow) were found in layer 5 of the RSG and were immunopositive for CaMKIIα (red, indicated by red arrow). Colocalized cells are indicated by white arrow. Scale bar, 20 μm. Data were replicated in four mice. C, Left, AAVDJ-CaMKIIα-EGFP was injected into the RSA (top). Right, mCherry signals (red) were expressed in RSA neurons under the control of CaMKIIα promoter (top). Scale bar, 200 μm. The mCherry signals of axonal projections were observed in the RSG (left, bottom), LA, LEnt (middle, bottom) and POR (right, bottom). Sections were costained with NeuN (green). Scale bar, 100 μm. Data were replicated in four mice. D, Left, FG was injected into the RSA (top). Right, FG signals were expressed in the RSA (top). The FG + cell bodies (gray) were found in layer 5 of the RSA. Scale bar, 100 μm. Bottom, The FG + cell bodies (blue) were found in layer 5 of the RSG and were immunopositive for CaMKIIα (red, indicated by red arrow). Colocalized cells are indicated by white arrow. Scale bar, 20 μm. Data were replicated in four mice. E, AAVrg-CaMKIIα-mCherry was injected into the dorsal CA1 area, and AAVrg-CaMKIIα-EGFP was injected into the RSA to label RSG neurons projecting to these areas. Representative images show RSG neurons projecting to the CA1 (green) and RSA (red). Scale bar, 20 μm. Bar chart shows the average proportion of RSG neurons projecting to the dorsal CA1 and RSA of all labeled RSG neurons. Data were replicated in four mice.
Figure 10.
Figure 10.
The replication examples show distinct projection patterns of the RSA and RSG. A, Left, AAVDJ-CaMKIIα-mCherry was injected into the RSG (top). Right, mCherry signals (red) were expressed in RSG neurons under the control of CaMKIIα promoter (top). Scale bar, 200 μm. The mCherry signals of axonal projections were observed in the CA1 SRLM (left and middle, bottom) and RSA layer 2 area (right, bottom). Scale bar, 100 μm. Right, Magnified image of rectangle (bottom). Scale bar, 20 μm. Sections were costained with NeuN (green). SO, Stratum oriens; SP, stratum pyramidale; SR, stratum radiatum; SLM, stratum lacunosum moleculare. B, Left, Fluorogold (FG, 4%) was injected into the dorsal CA1 area (top). Right, FG signal (gray) was expressed in pyramidal cell layer of the dorsal CA1 (top). Scale bar, 100 μm. Bottom, The FG + cell bodies (blue and indicated by blue arrow) were found in layer 5 of the RSG and were immunopositive for CaMKIIα (red, indicated by red arrow). Colocalized cells are indicated by white arrow. Scale bar, 20 μm. C, Left, AAVDJ-CaMKIIα-EGFP was injected into the RSA (top). Right,: mCherry signals (red) were expressed in RSA neurons under the control of CaMKIIα promoter (top). Scale bar, 200 μm. The mCherry signals of axonal projections were observed in the RSG (left, bottom), LA, LEnt (middle, bottom) and POR (right, bottom). Sections were costained with NeuN (green). Scale bar, 100 μm. D, Left, FG was injected into the RSA (top). Right, FG signal were expressed in the RSA (top). The FG + cell bodies (gray) were found in layer 5 of the RSA. Scale bar, 100 μm. Bottom, The FG + cell bodies (blue) were found in layer 5 of the RSG and were immunopositive for CaMKIIα (red, indicated by red arrow). Colocalized cells indicated by white arrow. Scale bar, 20 μm. E, AAVrg-CaMKIIα-mCherry was injected into the dorsal CA1 area, and AAVrg-CaMKIIα-EGFP was injected into the RSA to label RSG neurons projecting to these areas. Representative images show RSG neurons projecting to the CA1 (green) and RSA (red). Scale bar, 20 μm.
Figure 11.
Figure 11.
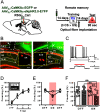
Optogenetic inhibition of RSGγCA1 projection impairs the retrieval of remote CFMs. A, Schematic representation of the experimental design. Two weeks after stereotaxic injection of AAVDJ-CaMKIIα-eNpHR3.0-EYFP or AAVDJ-CaMKIIα-EGFP into the RSG, mice were trained in a CFC paradigm, and memory retention was tested 14 d after training. Optic fibers were implanted 7 d after training. Mice were subjected to constant red light illumination (625 nm) onto the CA1 during the retrieval test. B, EYFP signals were expressed in the RSG, and EYFP signals of axonal projections were observed in strata radiatum (left) and lacunosum moleculare (right) of the CA1 area. Scale bar, 100 μm. Right, Magnified image of rectangle (bottom). Scale bar, 20 μm. SO, Stratum oriens; SP, stratum pyramidale; SR, stratum radiatum; SLM, stratum lacunosum moleculare. C, Top, Representative whole-cell current-clamp recording showing red-light-mediated (625 nm, 300 ms) inhibition of evoked spike firing in eNpHR3.0+ RSG neurons held at −70 mV. The square pulse below the voltage trace indicates the timing of current injection through the patch pipette that was sufficient to induce action potential firing. The red line above the voltage trace indicates time of 300 ms activation of eNpHR3.0. Bottom, Representative whole-cell voltage-clamp recording showing outward photocurrent in a eNpHR3.0+ RSG neuron exposed to a 200 ms, 625 nm light pulse. D, The learning curve for three acquisition trials of contextual fear conditioning training in mice with EGFP or NpHR before retrieval test [EGFP, n = 9; NpHR, n = 9; interaction (trial × treatment): F(3, 64) = 0.12, p = 0.95; trial variable: F(3,64) = 21.65, p < 0.001; treatment variable: F(1,64) = 0.047, p = 0.83; two-way ANOVA]. E and F, Optogenetic inhibition of RSGγCA1 projection decreased freezing levels in mice expressing eNpHR3.0-EYFP. E, Summary of experiments showing the effect of optogenetic inhibition of RSGγCA1 projection on the retention of remote CFMs in mice that received bilateral injections of AAVDJ-CaMKIIα-eNpHR3.0-EYFP or AAVDJ-CaMKIIα-EGFP into the RSG [EGFP, n = 9; NpHR, n = 9; interaction (treatment × light): F(2, 48) = 3.25, p = 0.05; treatment variable: F(1,48) = 1.03, p = 0.31; light variable: F(2,48) = 3.34, p = 0.04; two-way ANOVA followed by Bonferroni's post hoc test]. F, Summary bar graphs depicting the fear memory retention test at 14 d after receiving contextual fear conditioning training in mice receiving red light off or on during retrieval test [EGFP, n = 9; NpHR, n = 9; interaction (treatment × light): F(1, 32) = 4.84, p = 0.04; treatment variable: F(1,32) = 5.47, p = 0.03; light variable: F(1,32) = 2.58, p = 0.12; two-way ANOVA followed by Bonferroni's post hoc test]. Data indicate mean ± SEM; *p < 0.05 and **p < 0.01.
Figure 12.
Figure 12.
Optogenetic inhibition of RSGγRSA projection does not affect the retrieval of remote CFMs. A, Schematic representation of the experimental design. Two weeks after stereotaxic injection of AAVDJ-CaMKIIα-EGFP or AAVDJ-CaMKIIα-eNpHR3.0-EYFP into the RSG, mice were trained in a CFC paradigm, and memory retention was tested 14 d after training. Optic fibers were implanted 7 d after training. Mice were subjected to constant red light illumination (625 nm) onto the RSA during the retrieval test. B, EYFP signals were expressed in the RSG, and EYFP signals of axonal projections were observed in layer 2 of the RSA. Scale bar, 100 μm. Right, Magnified image of rectangle (bottom). Scale bar, 20 μm. C, The learning curve for three acquisition trials of contextual fear conditioning training in mice with EGFP or NpHR before retrieval test [EGFP, n = 7; NpHR, n = 7; interaction (trial × treatment): F(3, 48) = 1.68, p = 0.18; trial variable: F(3,48) = 82.12, p < 0.001; treatment variable: F(1,48) = 0.33, p = 0.57; two-way ANOVA]. D, Optogenetic inhibition of RSGγRSA projection did not affect freezing levels in mice expressing eNpHR3.0-EYFP. Summary of experiments showing the effect of optogenetic inhibition of RSGγRSA projection on the retention of remote CFMs in mice that received bilateral injections of AAVDJ-CaMKIIα-eNpHR3.0-EYFP or AAVDJ-CaMKIIα-EGFP into the RSG [EGFP, n = 7; NpHR, n = 7; interaction (treatment × light): F(2, 36) = 0.07, p = 0.93; treatment variable: F(1,36) = 1.53, p = 0.22; light variable: F(2,36) = 0.07, p = 0.93; two-way ANOVA]. E, Summary bar graphs depicting the fear memory retention test at 14 d after receiving contextual fear conditioning training in mice receiving red light off or on during retrieval test [EGFP, n = 7; NpHR, n = 7; interaction (treatment × light): F(1, 24) = 0.14, p = 0.71; treatment variable: F(1,24) = 0.13, p = 0.72; light variable: F(1,24) = 0.41, p = 0.52; two-way ANOVA]. Data indicate mean ± SEM.
Figure 13.
Figure 13.
Chemogenetic silencing of RSGγCA1 projection impairs fear memory retention 28 d after CFC training. A, Schematic representation of the experimental design. Two weeks after stereotaxic injection of AAVDJ-CaMKIIα-mCherry or AAVDJ-CaMKIIα-hM4D(Gi)-mCherry into the RSG, mice were trained in a CFC paradigm, and fear memory retention was tested 28 d after training. Cannulas were implanted over dorsal CA1 2 weeks after CFC training to allow local and selectively delivery of vehicle (Veh) or CNO to achieve specific silencing of RSG projections to the dorsal CA1. Veh (1% DMSO in PBS, 0.5 µl) or CNO (1.4 µg/µl, 0.5 µl) was bilaterally infused into the dorsal CA1 through cannulas 30 min before the retrieval test. B, Representative images of mCherry and NeuN overlap in the RSG of mouse injected previously with AAVDJ-CaMKIIα-hM4D(Gi)-mCherry. Scale bar, 100 μm. Right, Magnified image of rectangle. Scale bar, 20 μm. C, Summary graphs depicting the percentages of mCherry+/DAPI+ cells in the RSG from AAVDJ-CaMKIIα-mCherry + CNO (n = 5) and AAVDJ-CaMKIIα-hM4D(Gi)-mCherry + CNO (n = 5; t(8) = 1.25, p = 0.25, unpaired Student's t test). D, Representative images of mCherry-labeled RSG axonal projections (red) in the dorsal CA1 of mouse injected previously with AAVDJ-CaMKIIα-hM4D(Gi)-mCherry. Scale bar, 100 μm. Right, Magnified image of rectangle. Scale bar, 20 μm. SO, Stratum oriens; SP, stratum pyramidale; SR, stratum radiatum; SLM, stratum lacunosum moleculare. E, Summary of experiments showing the effects of Veh or CNO infusion into the dorsal CA1 on the retrieval of 28-d-old CFMs in mice injected previously with AAVDJ-CaMKIIα-hM4D(Gi)-mCherry or AAVDJ-CaMKIIα-mCherry into the RSG [mCherry + Veh, n = 5; hM4D(Gi) + Veh, n = 5; mCherry + CNO, n = 6; hM4D(Gi) + CNO, n = 8; interaction: F(1,20) =24.29, p < 0.001 interaction (treatment × light): F(1,20) =24.29, p < 0.001; treatment variable: F(1,20) = 0.32, p = 0.58; light variable: F(1,20) = 17.94, p < 0.001; two-way ANOVA followed by Bonferroni's post hoc test]. Data indicate mean ± SEM; *p < 0.05 and ***p < 0.001.
Figure 14.
Figure 14.
Monosynaptic rabies tracing of excitatory inputs from the RSG to the CA1. A, Schematic depiction of viral injection. AAV5-FLEX-TVA-GFP, AAV5-FLEX-RG and EnvA-ΔG-mCherry were unilaterally injected into the dorsal CA1. Three weeks after stereotaxic injection of AAV5-FLEX-TVA-GFP and AAV5-FLEX-RG, EnvA-ΔG-mCherry was injected into the dorsal CA1 region of either CaMKIIα-Cre or Vgat-Cre mice. Ten days later, mice were killed and perfused, and slices were prepared for fluorescence microscopy. B, Left, Representative images (top) of mCherry+ presynaptic cells in layer 5 of the RSG with expression of excitatory marker CaMKIIα in CaMKIIα-Cre mice. Right, Representative images (top) of AAV5-helper virus-infected starter cell (yellow) in the CA1 region. Scale bar, 100 μm. Bottom, Higher magnification images of the dashed white box (top). Scale bar, 20 µm. Left, White arrowhead (bottom) indicates cell doubled for CaMKIIα (green) and mCherry (red). Right, White arrowheads (bottom) indicate cell doubled for GFP (green) and mCherry (red). Data were replicated in five mice. C, Left, Representative images (top) of mCherry+ presynaptic cells in layer 5 of the RSG with expression of excitatory marker CaMKIIα in Vgat-Cre mice. Right, Representative images(top) of AAV5-helper virus-infected starter cell (yellow) in the CA1 region. Scale bar, 100 μm. Bottom, Higher magnification images of the dashed white box (top). Scale bar, 20 µm. Left, White arrowhead (bottom) indicates cell doubled for CaMKIIα (green) and mCherry (red). Right, White arrowheads (bottom) indicate cell doubled for GFP (green) and mCherry (red). SO, Stratum oriens; SP, stratum pyramidale; SR, stratum radiatum; SLM, stratum lacunosum moleculare. Data were replicated in four mice.

Similar articles

Cited by

References

    1. Albo Z, Gräff J (2018) The mysteries of remote memory. Phil Trans R Soc Lond B Biol Sci 373:20170029. 10.1098/rstb.2017.0029 - DOI - PMC - PubMed
    1. Armbruster BN, Li X, Pausch MH, Herlitze S, Roth BL (2007) Evolving the lock to fit the key to create a family of G protein-coupled receptors potently activated by an inert ligand. Proc Natl Acad Sci U S A 104:5163–5168. 10.1073/pnas.0700293104 - DOI - PMC - PubMed
    1. Barry DN, Maguire EA (2019) Remote memory and the hippocampus: a constructive critique. Trends Cogn Sci 23:128–142. 10.1016/j.tics.2018.11.005 - DOI - PubMed
    1. Blum S, Runyan JD, Dash PK (2006) Inhibition of prefrontal protein synthesis following recall does not disrupt memory for trace fear conditioning. BMC Neurosci 7:67. 10.1186/1471-2202-7-67 - DOI - PMC - PubMed
    1. Bouton ME, Todd TP (2014) A fundamental role for context in instrumental learning and extinction. Behav Processes 104:13–19. 10.1016/j.beproc.2014.02.012 - DOI - PMC - PubMed

Publication types

LinkOut - more resources