. 2022 Feb 2;42(5):804-816.
doi: 10.1523/JNEUROSCI.0838-21.2021. Epub 2021 Dec 7.

Taste Bud Connectome: Implications for Taste Information Processing

Affiliations

Taste Bud Connectome: Implications for Taste Information Processing

Courtney E Wilson et al. J Neurosci. .

Abstract

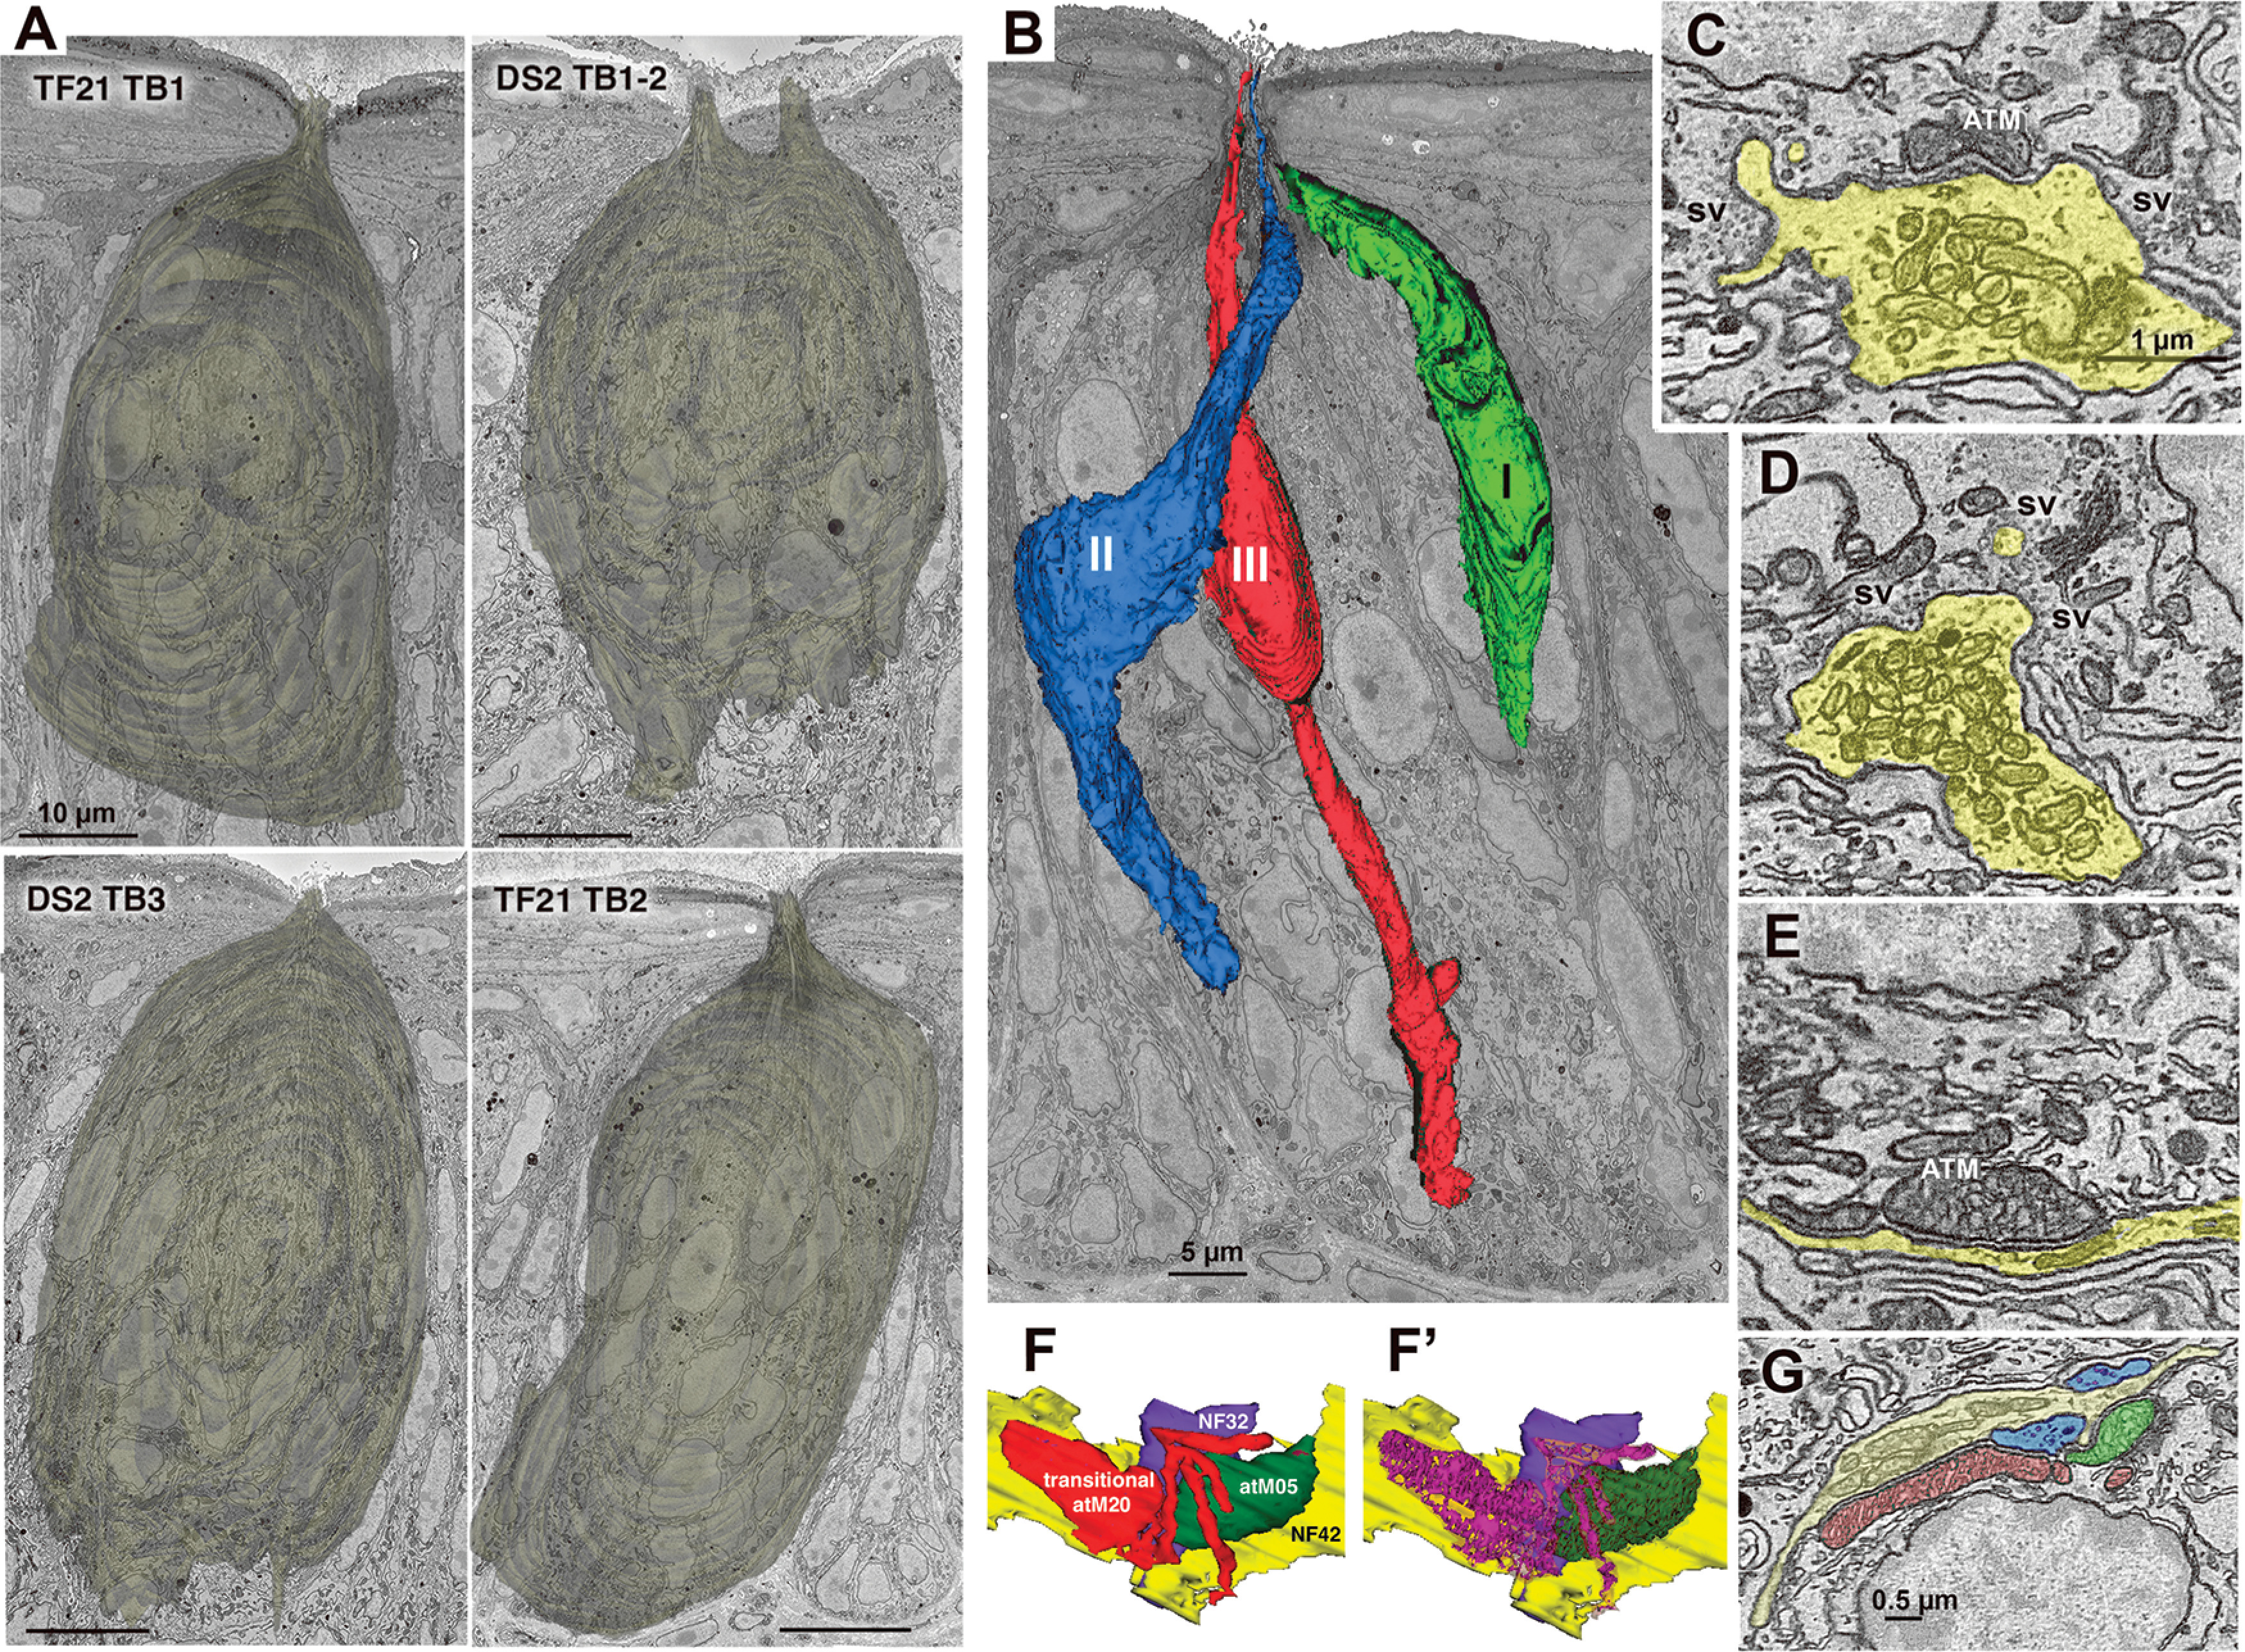
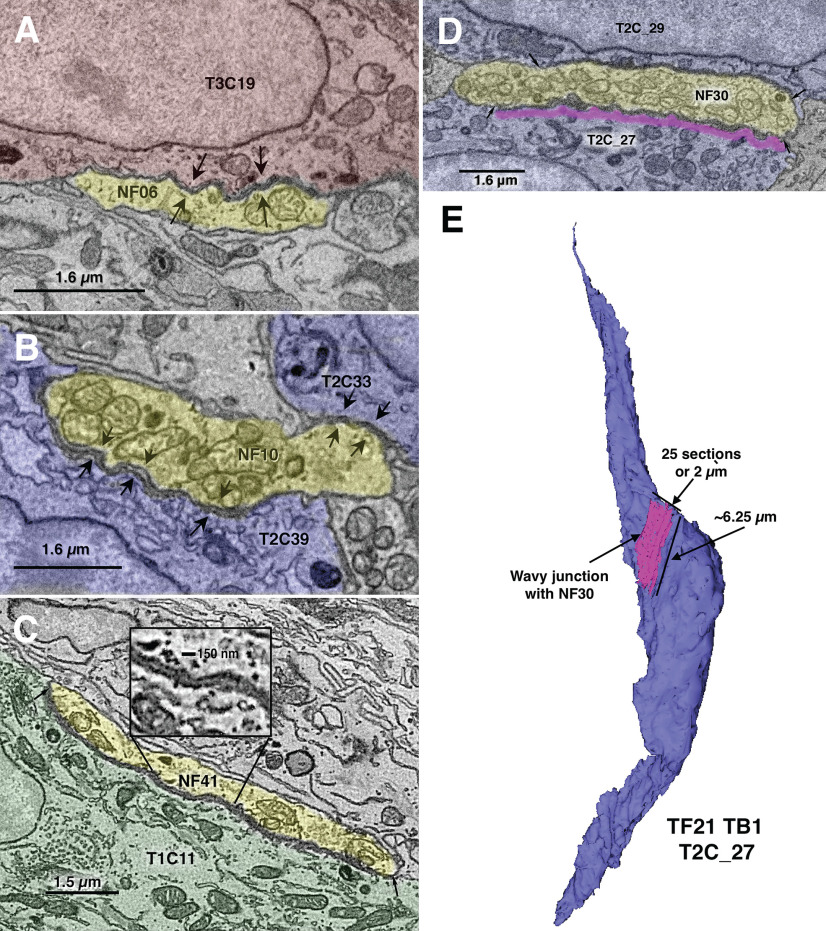
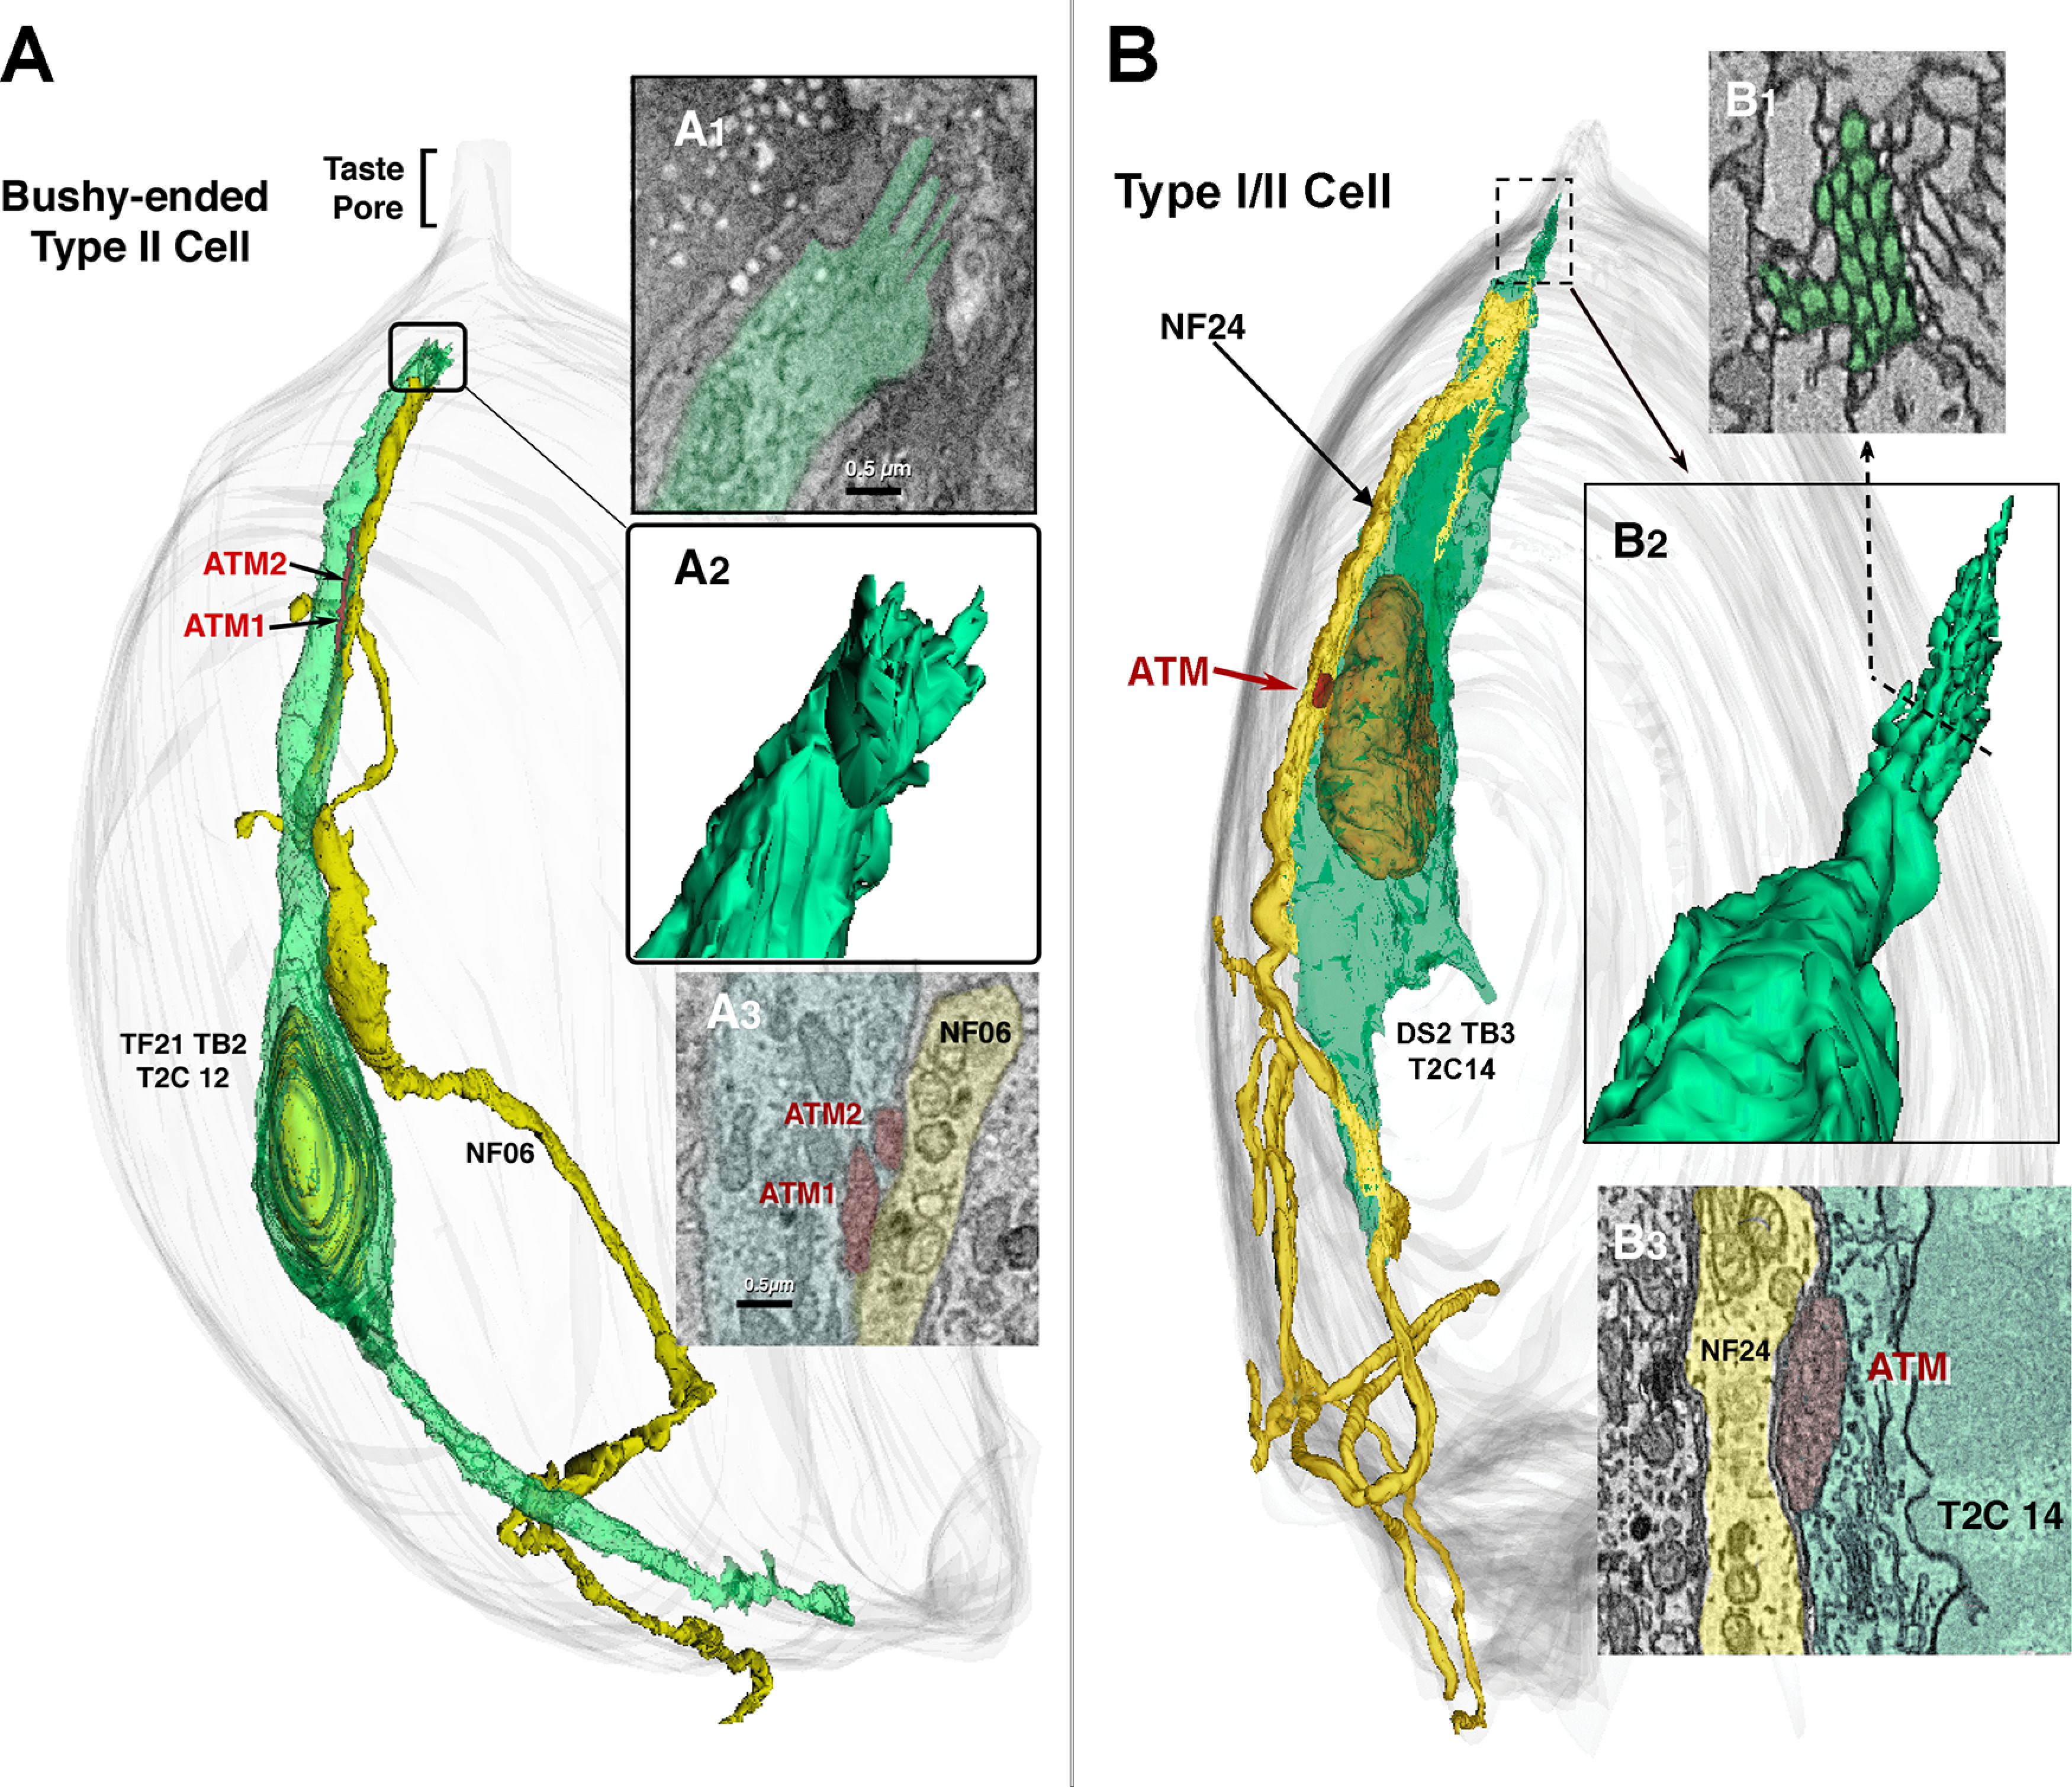
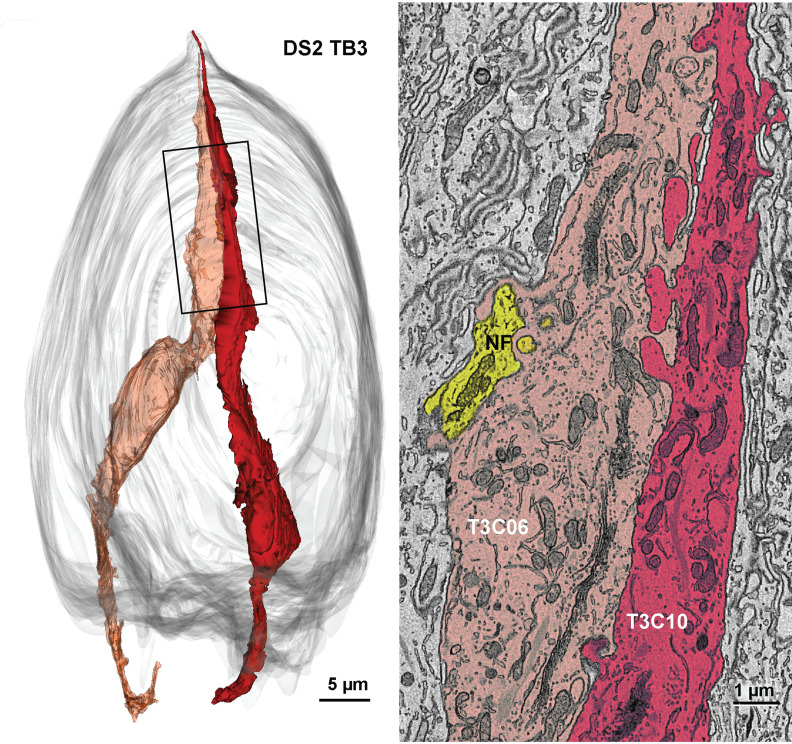
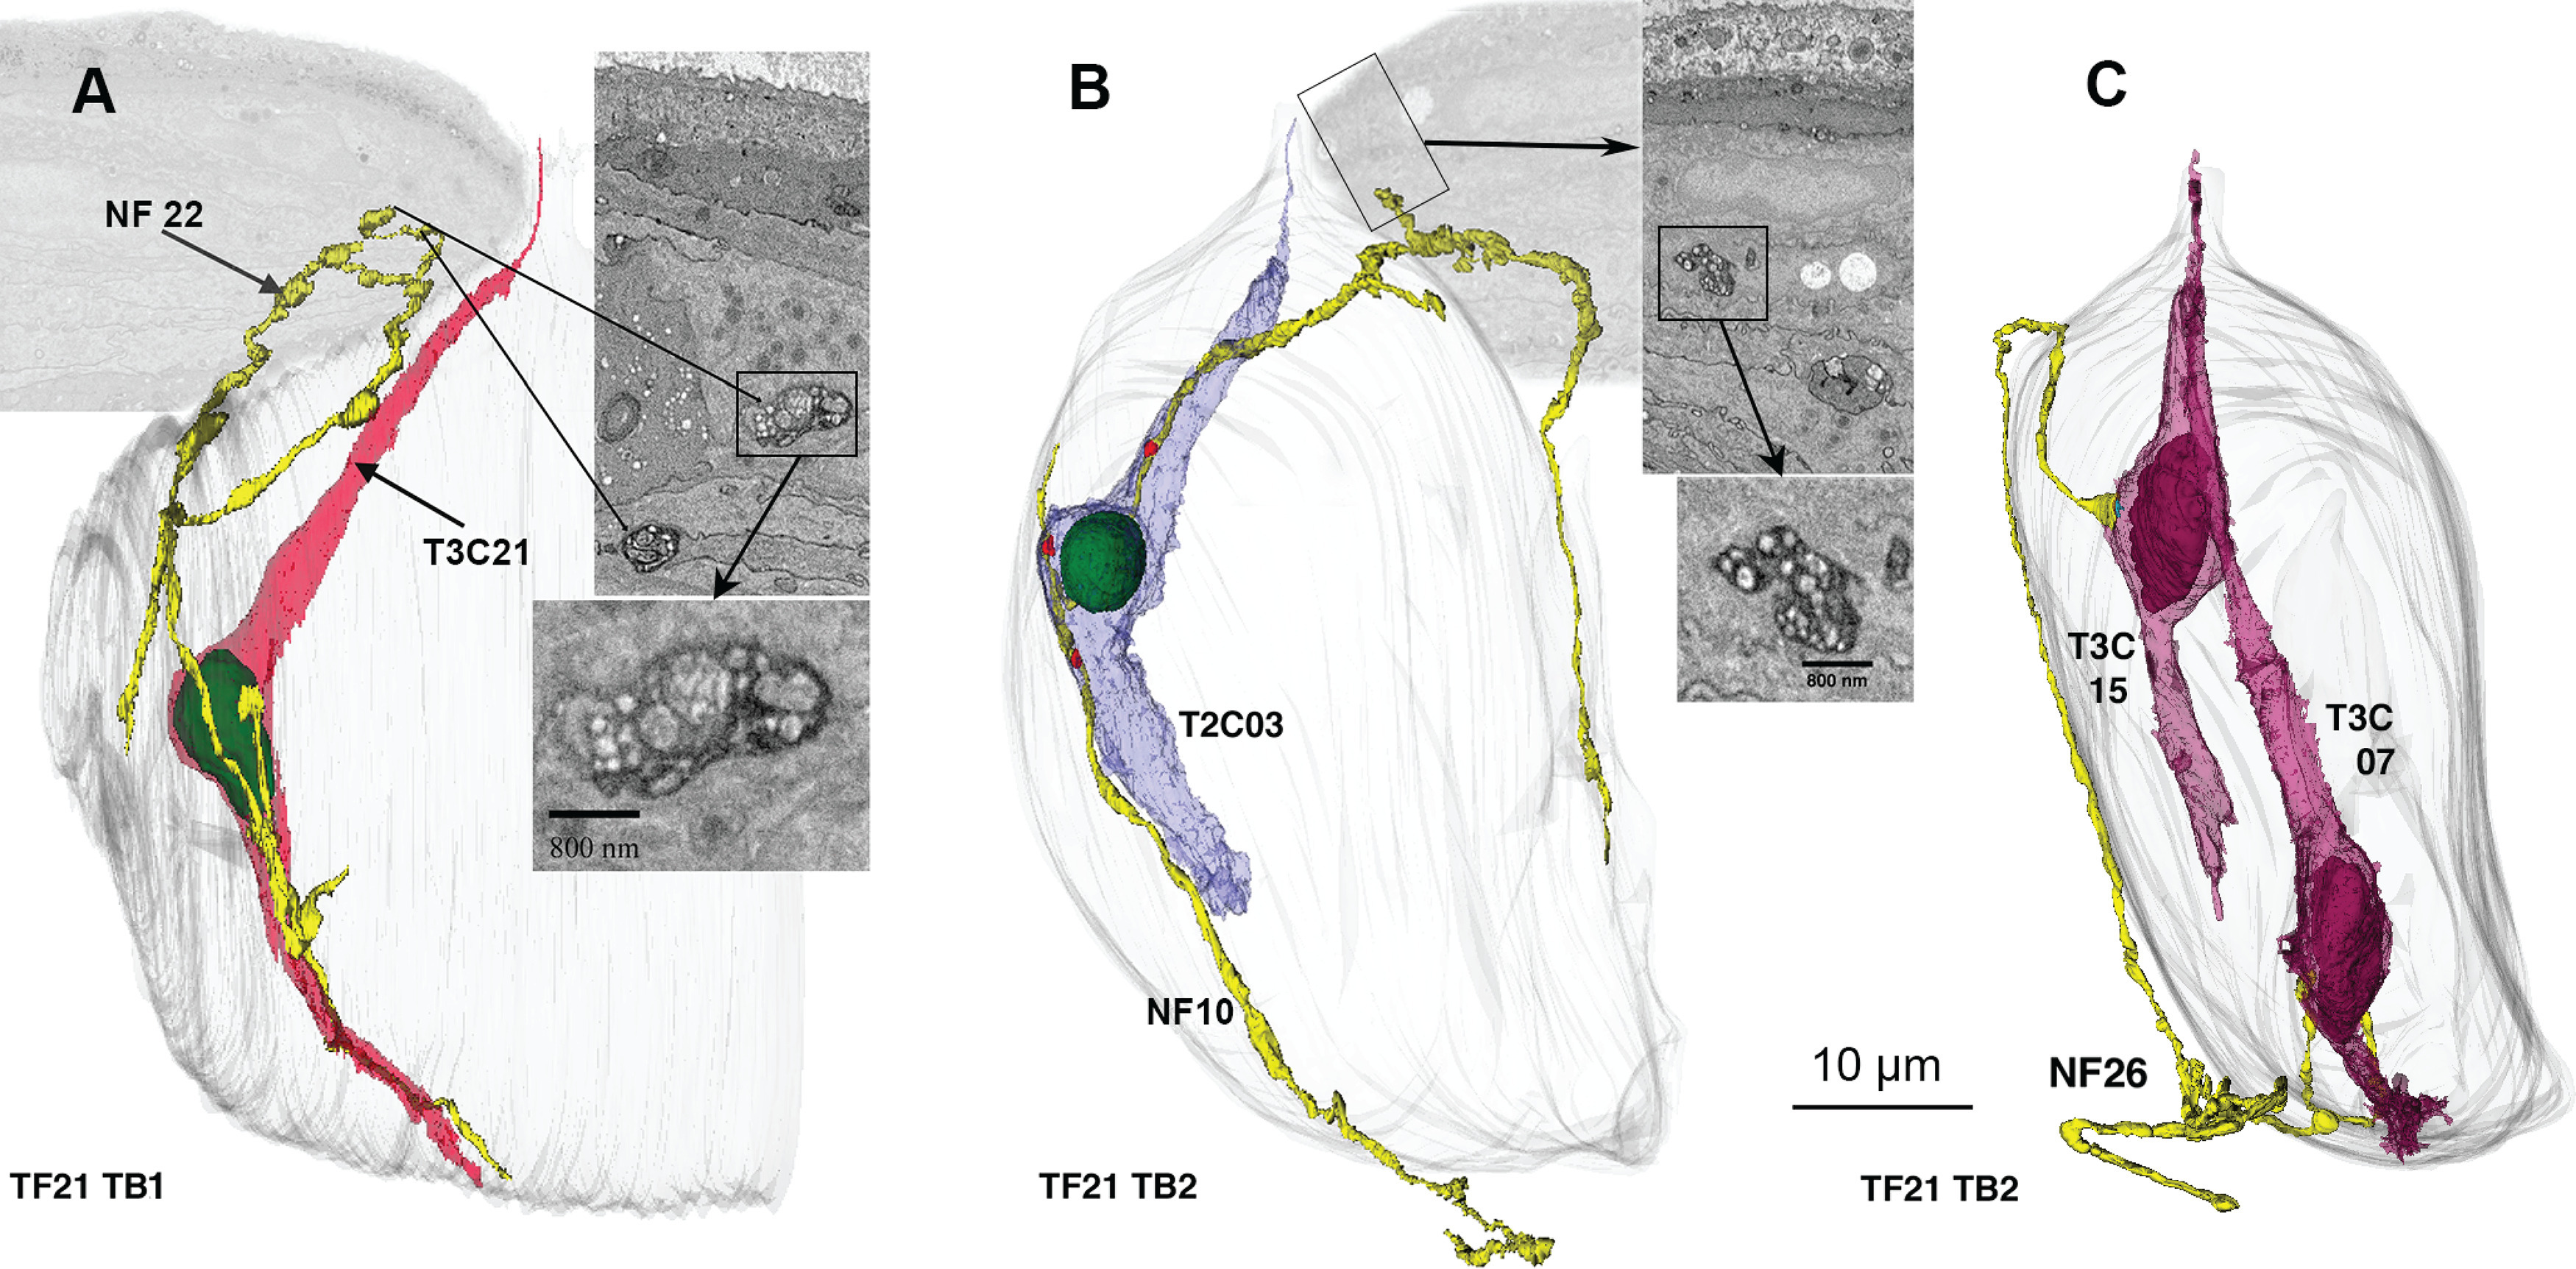
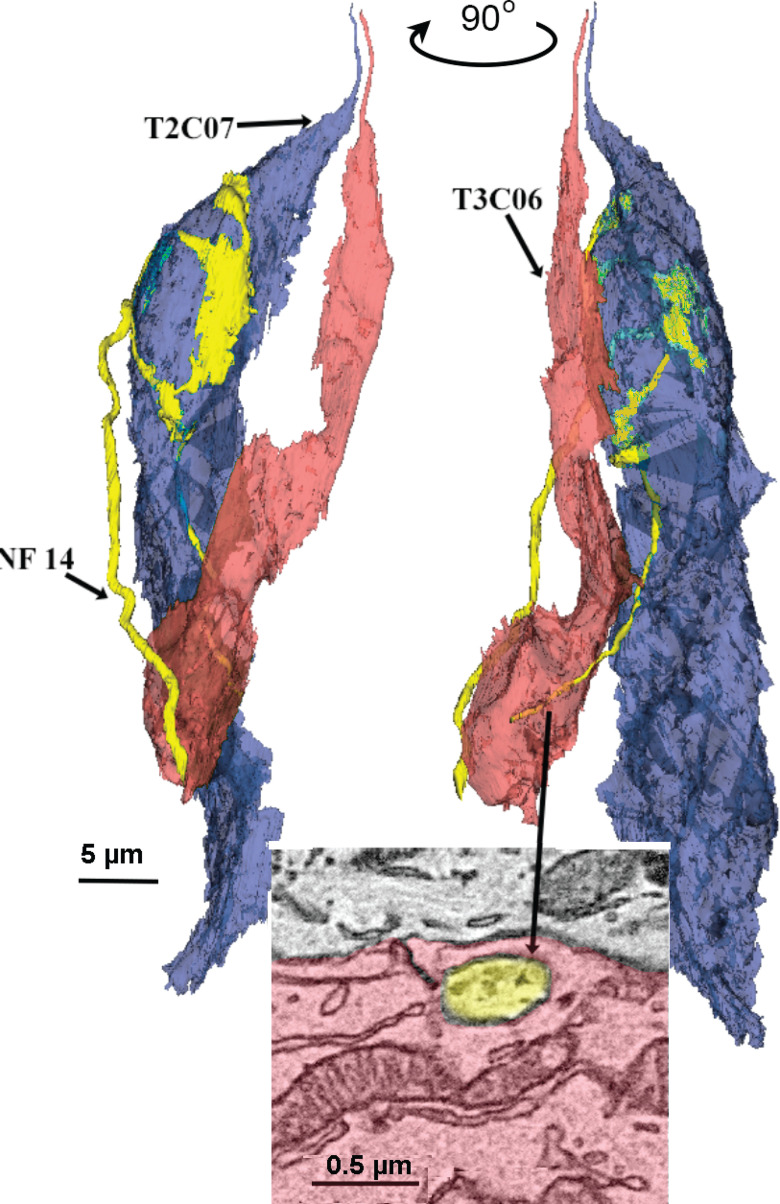
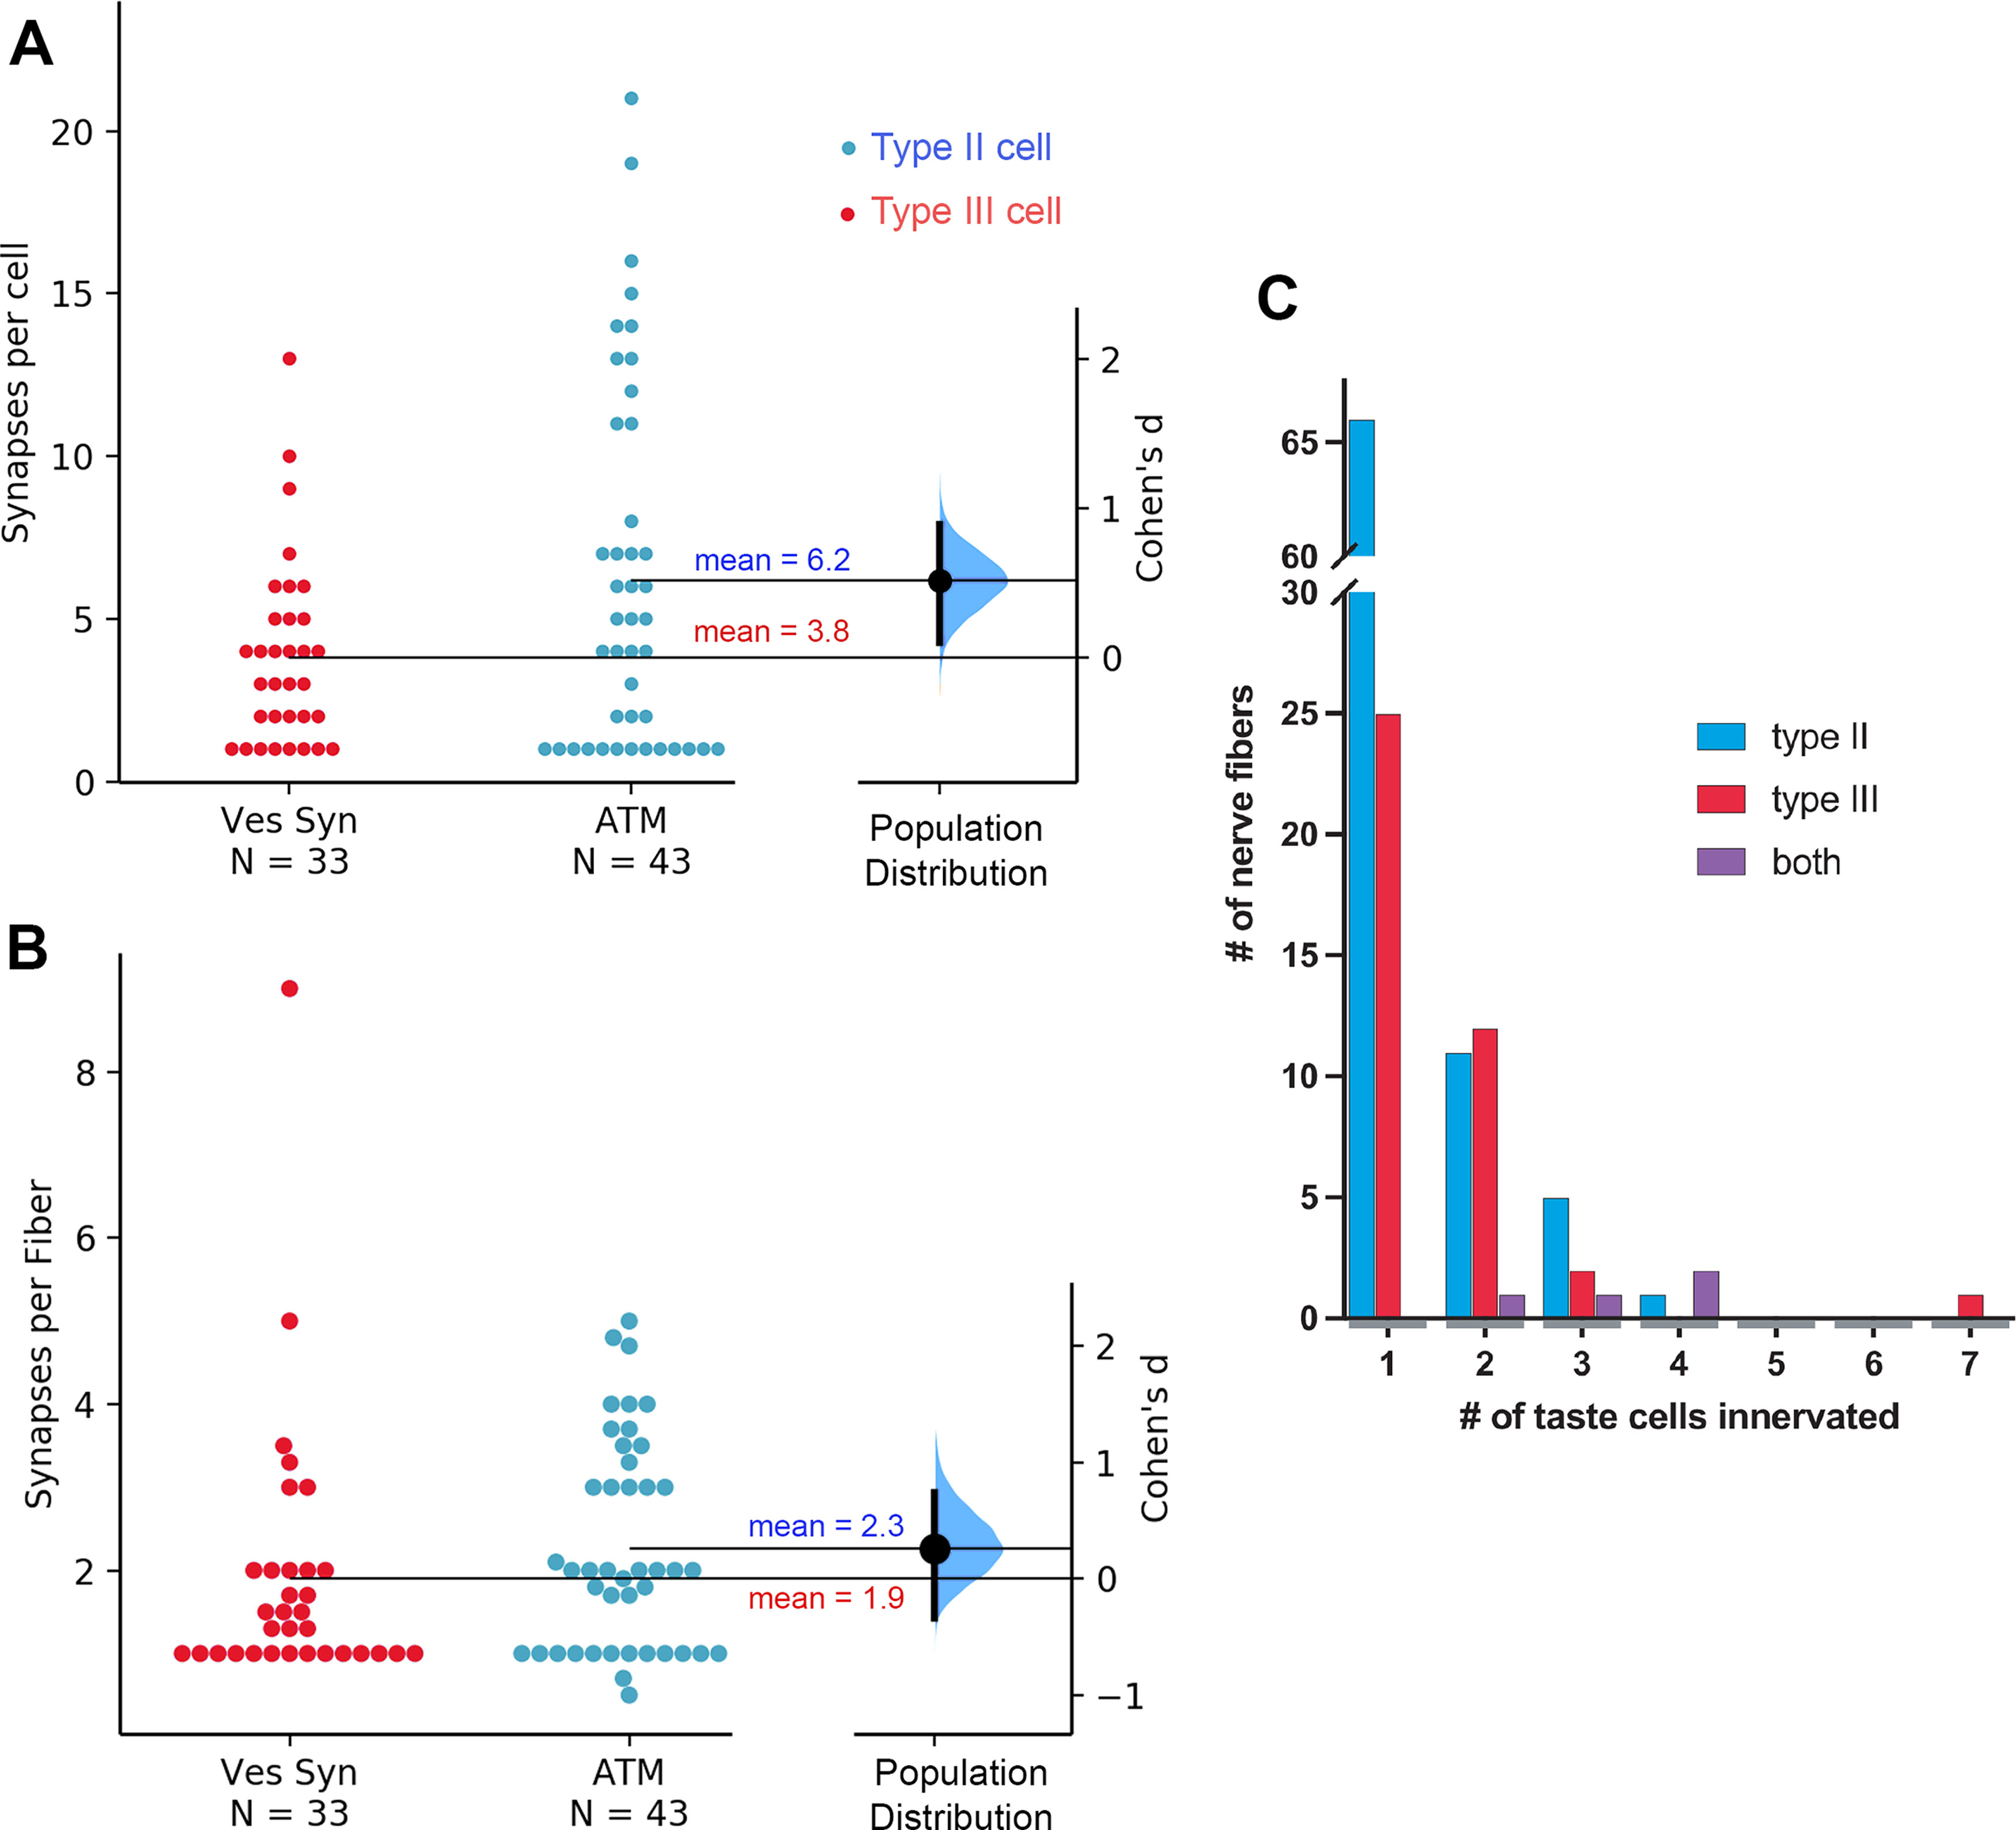
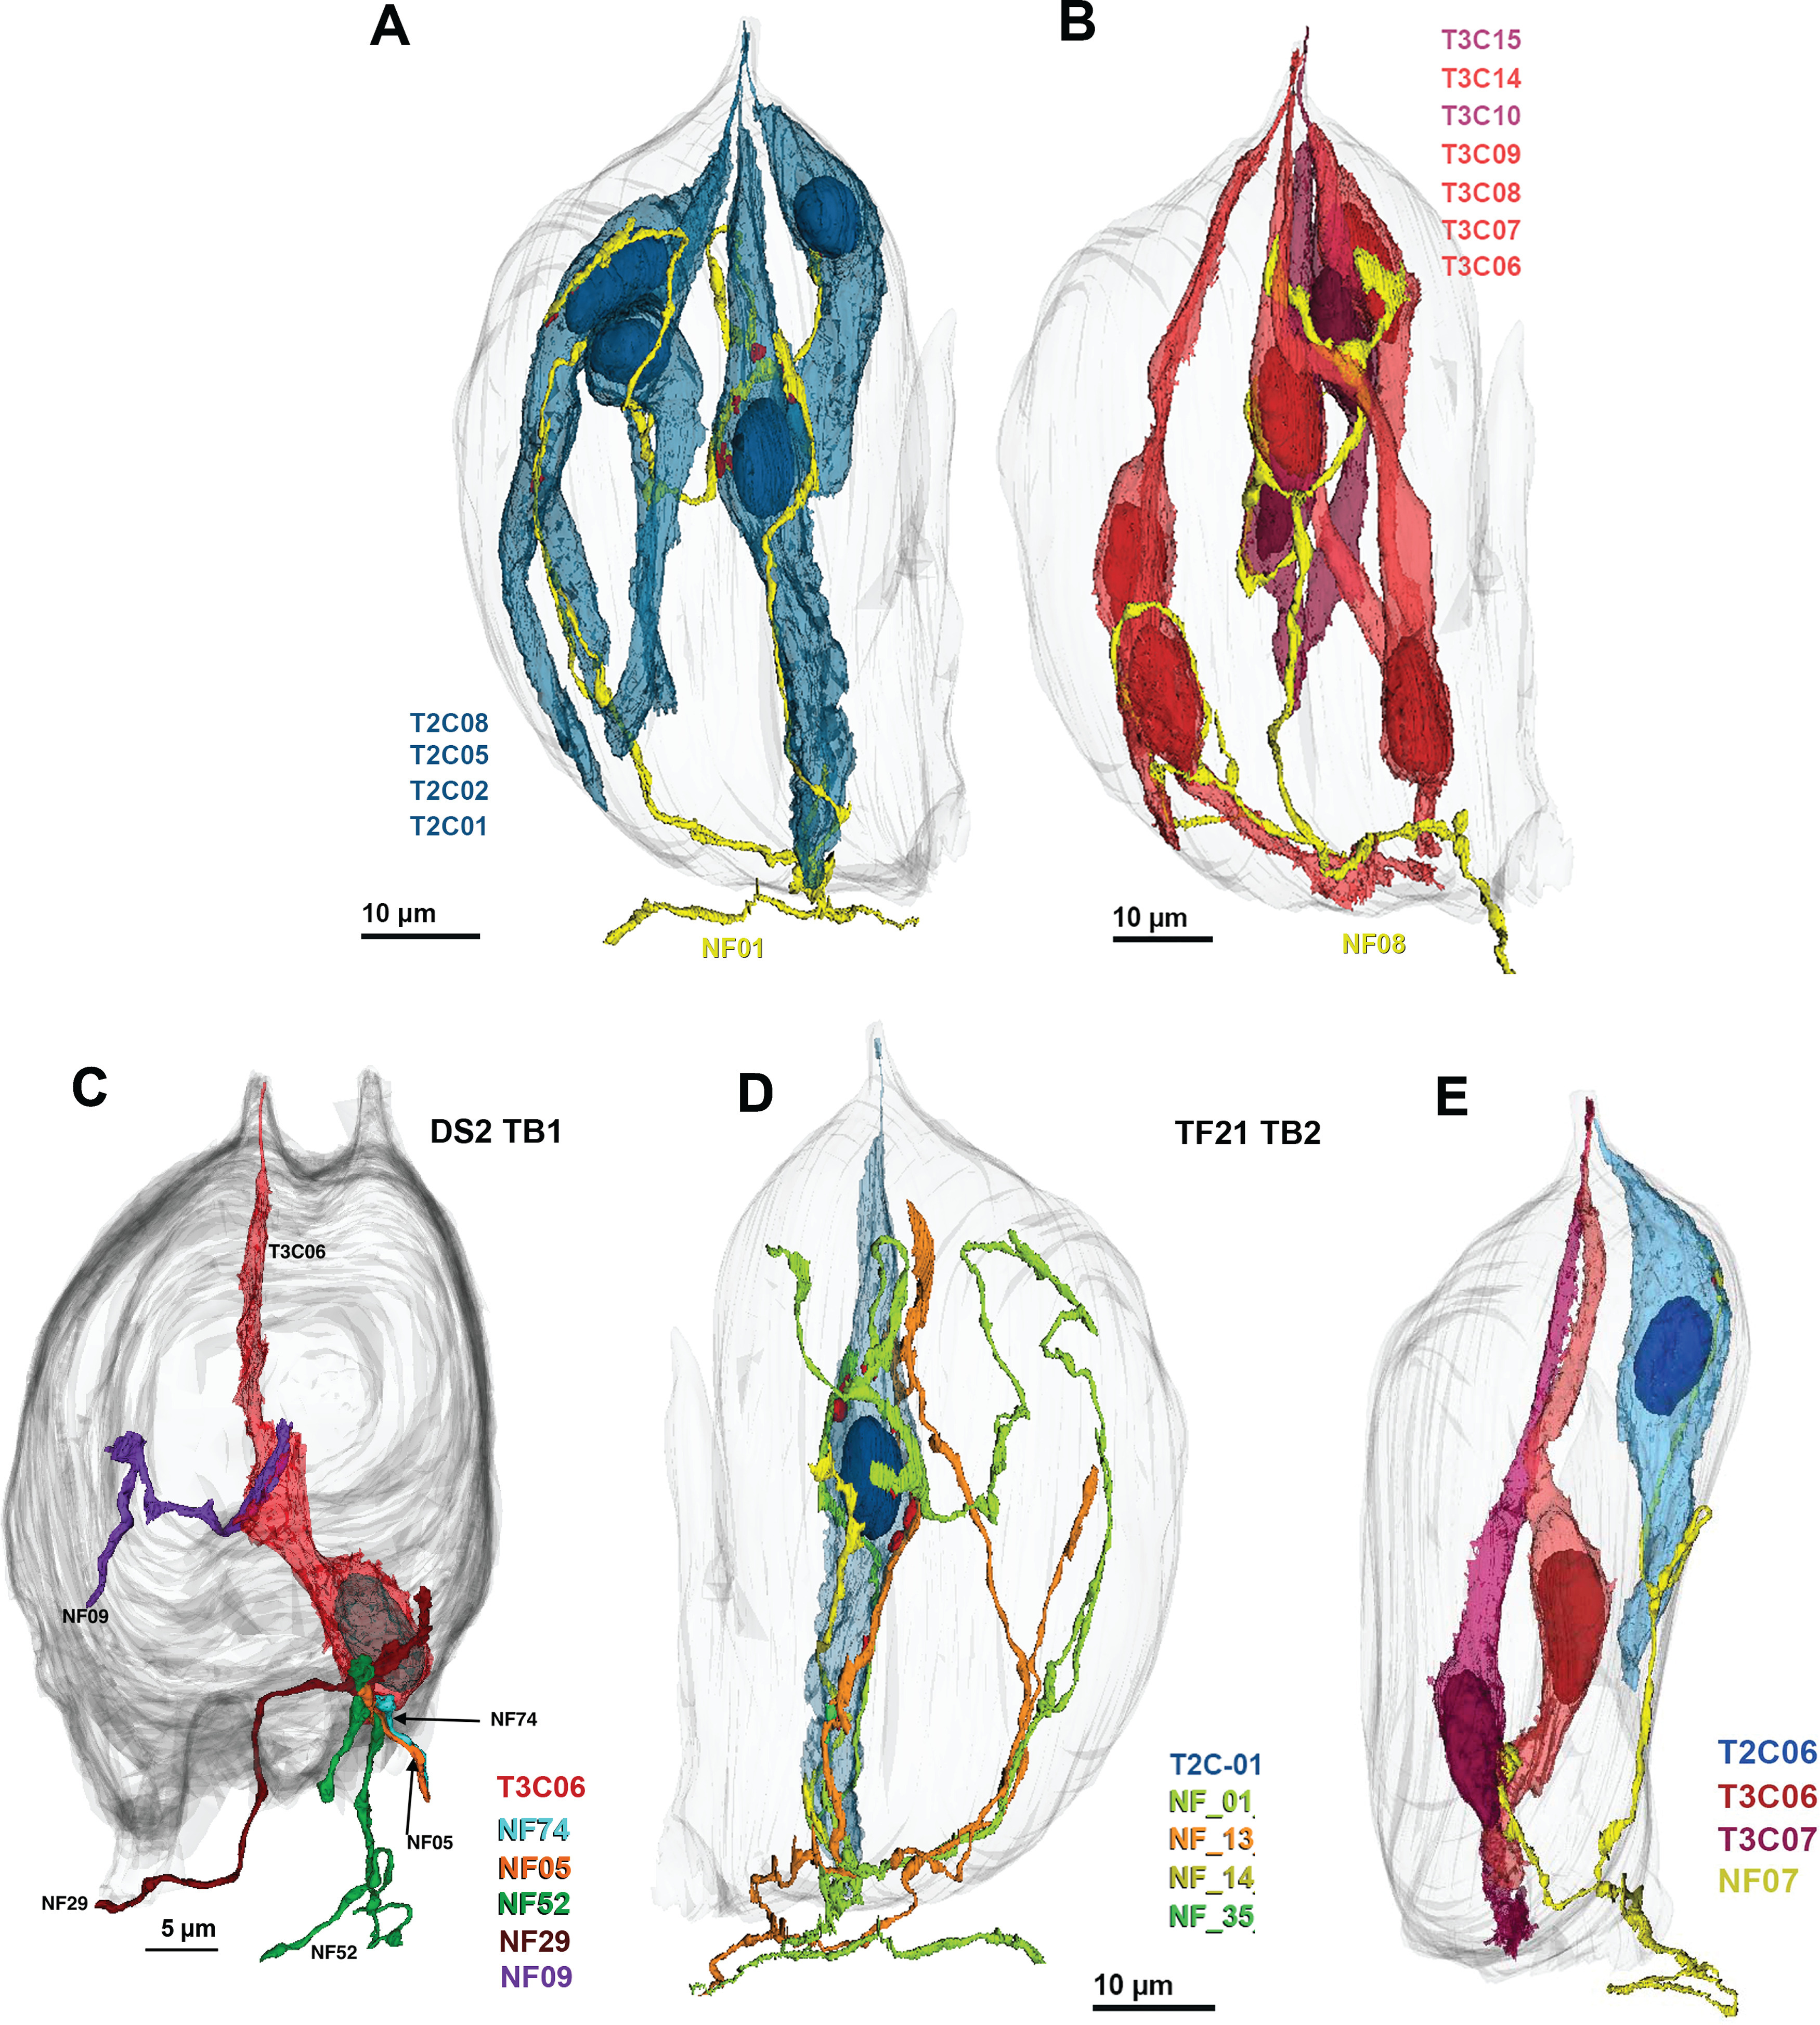
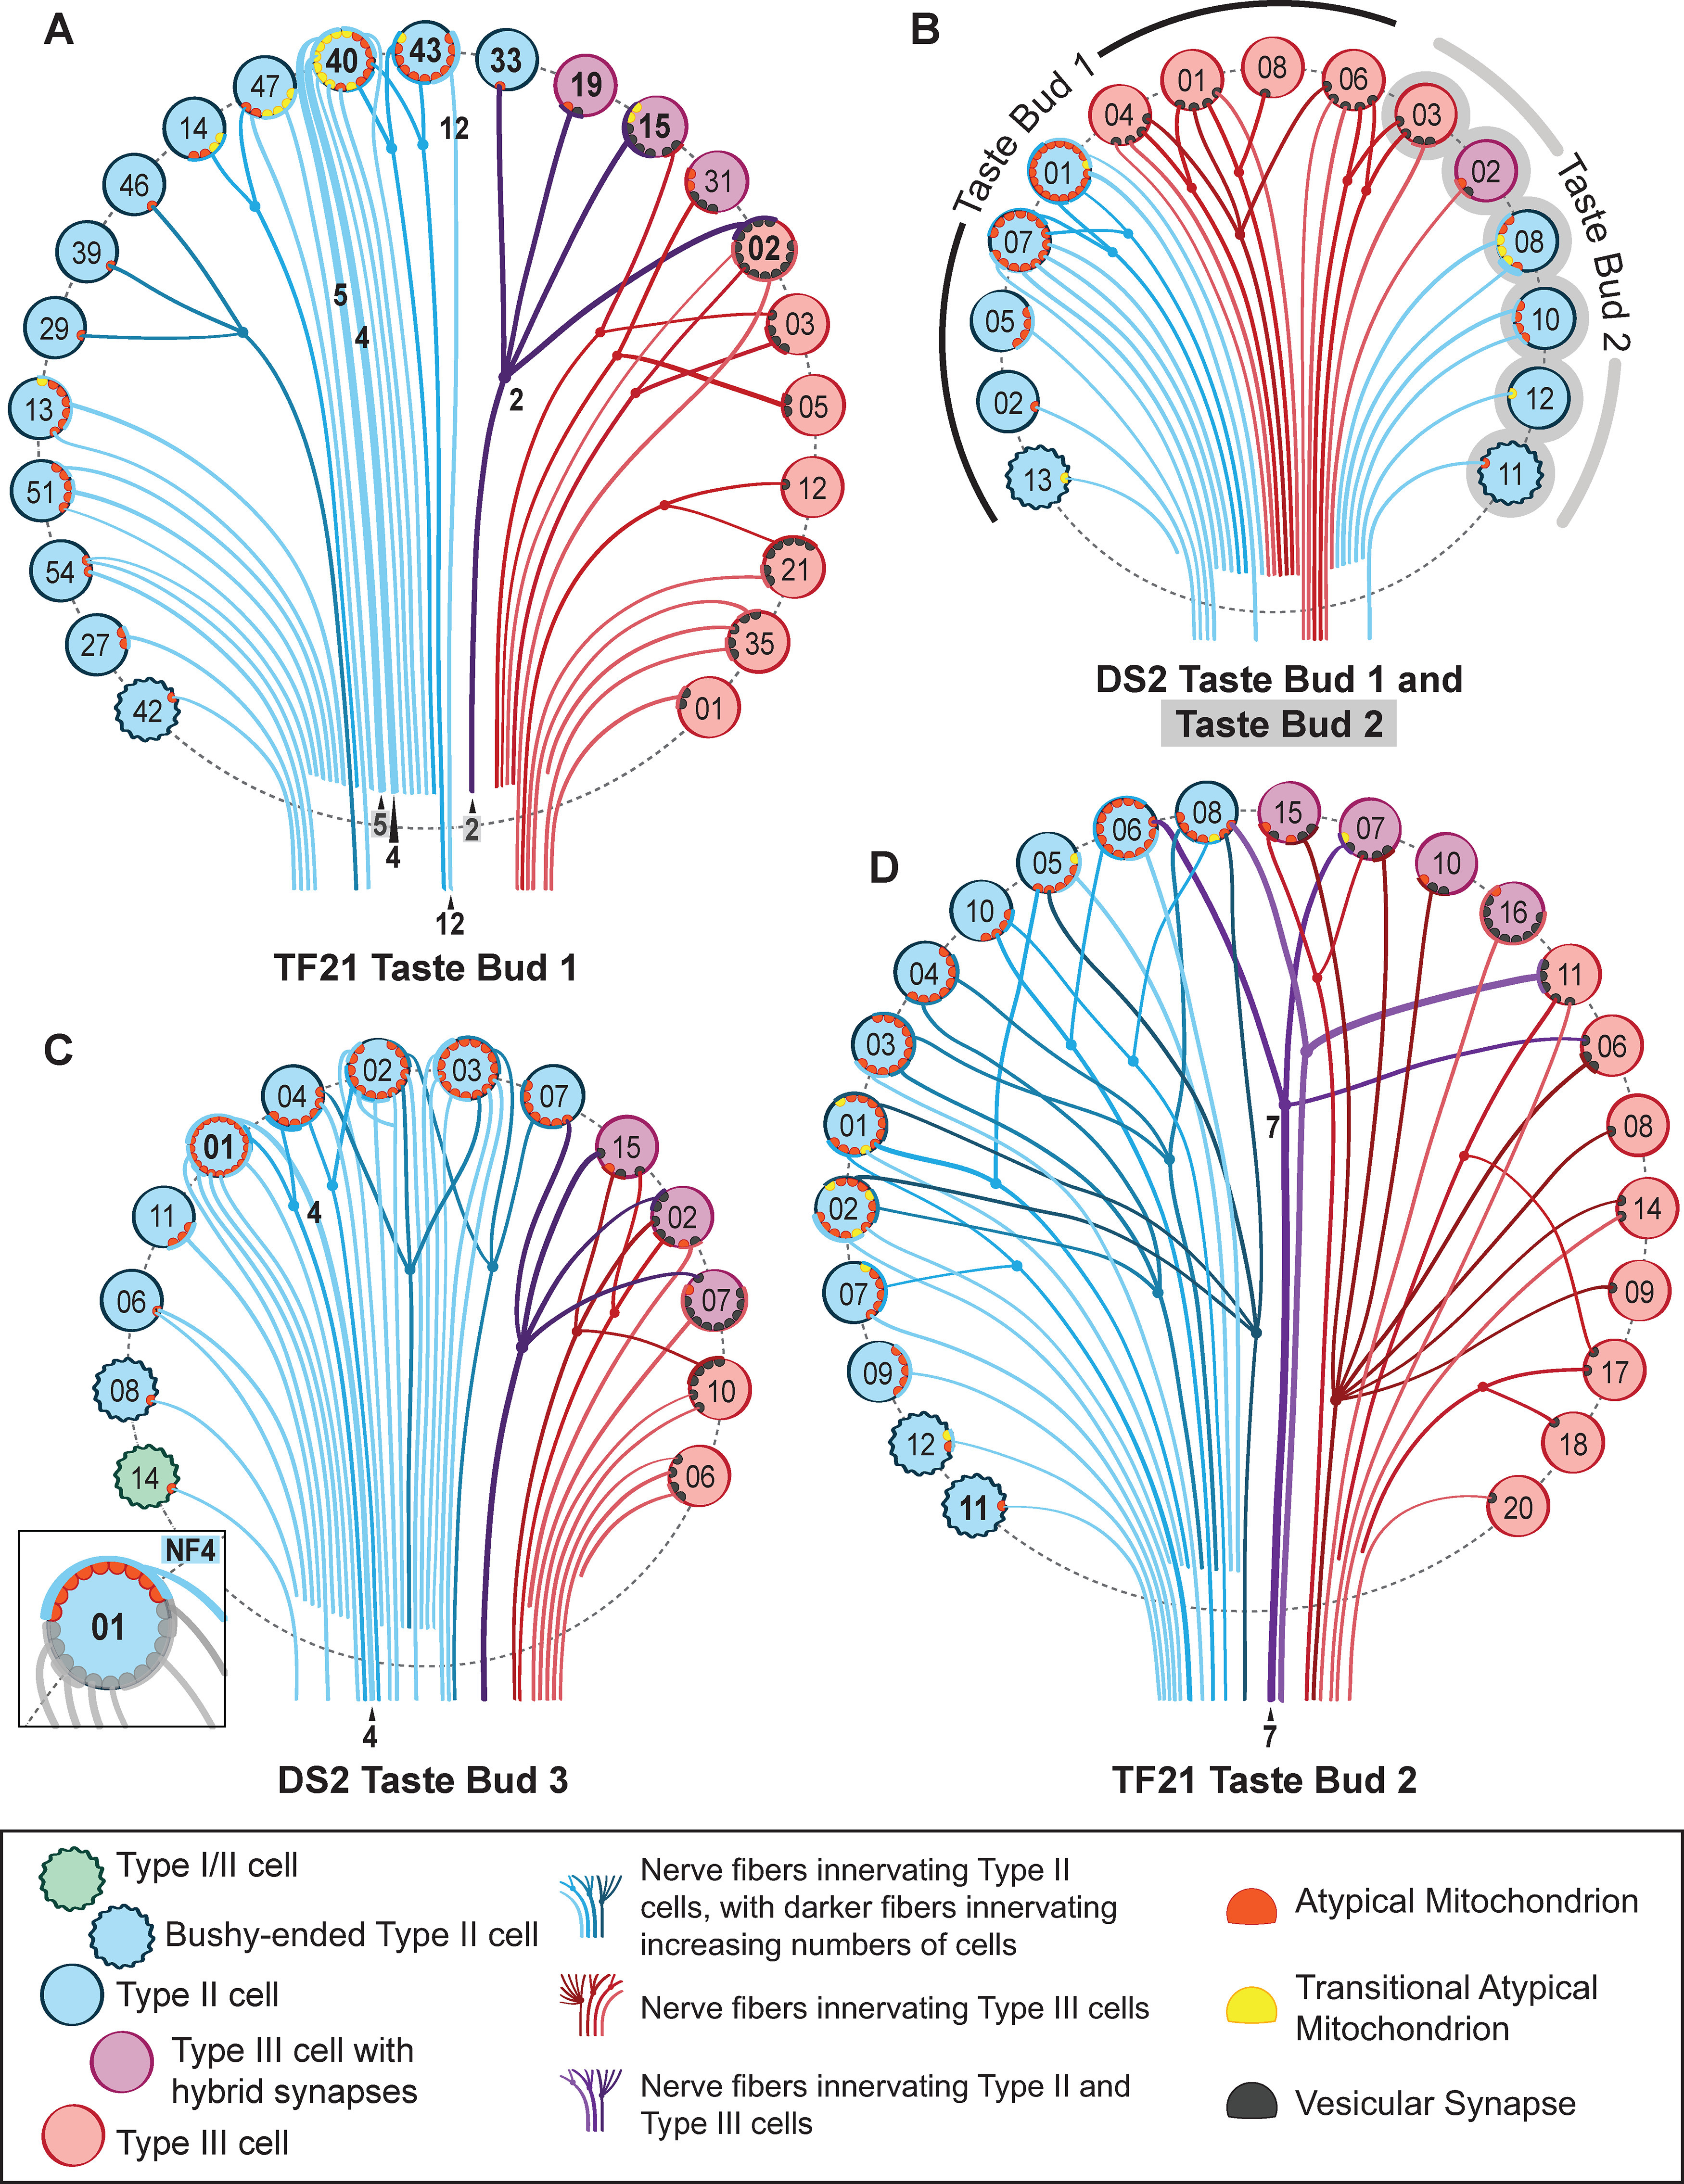
Taste buds contain multiple cell types, two of which mediate transduction of specific taste qualities: Type III cells transduce sour while Type II cells transduce either sweet, or bitter or umami. In order to discern the degree of interaction between different cell types and specificity of connectivity with the afferent nerve fibers (NFs), we employed serial blockface scanning electron microscopy (sbfSEM) through five circumvallate mouse taste buds. Points of contact between Type II and Type III cells are rare and lack morphologically identifiable synapses, suggesting that interaction between these cell types does not occur via synapses. Of the 127 NFs that make synaptic contacts with taste cells in the sampling volume, ∼70% (n = 91) synapse with only one taste cell while 32 fibers synapse exclusively with multiple Type II cells or multiple Type III cells. Our data do not rule out multimodal fibers innervating Type II cells of separate taste qualities. Notably, four fibers (∼3%) synapse with both Type II and Type III cells, forming both mitochondrial and vesicular synapses on the different cell types. Since Type II and Type III cells transduce different taste qualities, these dual connected fibers are not consistent with a absolute labeled-line encoding system. Further, our data reveal considerable variation in both the number of synapses per cell/nerve pair and the number of innervating NFs per taste cell, both of which likely have consequences for encoding taste quality and concentration. Finally, we identify a subset of Type II cells which may represent an immature stage.SIGNIFICANCE STATEMENT Taste buds, the sensory end organs for the sense of taste, contain multiple types of sensory cells, with each responding to one of the primary tastes: salt, sweet, sour, bitter, and umami. In order to determine the degree of interaction between cell types and specificity of connectivity to afferent nerves, we employed serial blockface electron microscopy (EM) of mouse circumvallate taste buds. We find no synapses between cell types within the taste bud suggesting that any interactions are indirect. While the majority of nerve fibers (NFs) connect to a single type of taste cell, 3.1% of the fibers branch to receive input from taste cells of different specificities. Thus, taste cannot entirely be carried along NFs dedicated to single taste qualities.

Keywords: CALHM1; electron microscopy; labeled line; nerve fibers; synapse; taste buds.


Conflict of interest statement

The authors declare no competing financial interests.

Figures

Figure 1.
Figure 1.
Taste buds, cell types, and synapses. A, Reconstructions of the appearance of the five segmented taste buds in the connectome dataset. The upper right image (DS2_TB1-2) shows the conjoined taste buds with two distinct apical pores. Scale bars: 10 µm. B, Taste bud TF21_TB2 showing representatives of the three elongate cell types. C, Hybrid type synapse showing both an ATM and a cluster of synaptic vesicles (sv) at the region of contact between the NF (yellow) and Type III taste cell. D, Vesicular synapse characteristic of Type III taste cells. Numerous, densely packed conventional mitochondria are contained within the nerve process (yellow). E, Channel synapse characteristic of Type II cells with ATM apposed to the plasma membrane at the region of contact with the NF. F, F', 3D reconstructions of a transitional mitochondrion at a synapse between a Type II cell and two NFs (blue and yellow). The transitional mitochondrion (red) with mixed lamellar and tubular cristae (magenta, F') is adjacent to an ATM (green, F) containing only tubular cristae (dark green, F'). G, EM image of the mitochondrial complex reconstructed in panel F.
Figure 2.
Figure 2.
Examples of wavy junctions between NFs (yellow) and diverse cells of taste buds. A, From TF21_TB2: wavy junction between a NF (NF06, yellow) and a Type III cell (T3C19, red). Arrows mark the extent of the contact, in this case ∼3 μm. B, From TF21_TB1: wavy junction between a NF (NF10, yellow) and two Type II cells, T2C39 and T2C33, blue. Arrows mark the extent of the contacts, in this case ∼1 μm for T2C33 and ∼3.5 μm for T2C39. C, From DS2_TB3: wavy junction between a NF (NF41, yellow) and a Type I cell (T1C11, green). The inset shows an enlargement of the gap region of ∼40–50 nm. Arrows mark the extent of the contact, in this case ∼8 μm. D, A large wavy junction from TF21_TB1 cell T2C27. Magenta shows the extent of the wavy junction with NF30. E, Reconstruction of cell T2C27 and its wavy junction with NF30 corresponding to the single plane image in D.
Figure 3.
Figure 3.
Unconventional Type II cells. A, A bushy-ended Type II cell forms an apparent channel type synapse with two ATMs with NF06 (A3). The apex of this cell (A1, A2) ends below the taste pore region in an irregular group of stubby microvilli. B, A Type I/II cell shows features typical of both Type I and Type II cells. The nuclear structure and presence of apparent channel synapse with ATM (B3) are indicative of Type II cells but the tuft of apical microvilli (B1, B2) is typical of Type I cells.
Figure 4.
Figure 4.
Interdigitating contact between two Type III cells. Left, 3D reconstruction of the two Type III cells that form an extensive contact in the apical region of the taste bud. Right, Colorized EM image of the region of contact also showing the presence of a NF (yellow) near the line of contact.
Figure 5.
Figure 5.
Examples of limited regions of contact between Type II and Type III cells. A, Contact between apical processes in the taste pore. B, Apical contact below the taste pore. C, Contact in the basal region of the taste bud.
Figure 6.
Figure 6.
Examples of NFs (yellow) that both synapse with taste cells and traverse perigemmal space. A, 3D reconstruction of a fiber that starts as a an intragemmal fiber, synapses with a Type III cell, then exits the taste bud to run in perigemmal space. Inserts at right show EM morphology as indicated. B, Similar NF that synapses with a Type II cell. Adjacent EM images illustrate the nature of the synapses and free endings in the perigemmal epithelium. C, An example of a fiber that starts as a perigemmal fiber and then enters the taste bud to form a synapse with two Type III cells.
Figure 7.
Figure 7.
NFs that contact taste cells do not always form synapses. In this example, showing two views rotated ∼90°, the NF (yellow) synapses with a Type II cell (blue) and then runs downward to become fully surrounded by a Type III cell (see inset below), but without forming a specialized contact with that cell.
Figure 8.
Figure 8.
A, The mean number of synapses per cell is larger for Type II cells (ATM) than for Type III cells (Ves Syn). The Cohen's d between Ves Syn and ATM is shown in this Gardner–Altman estimation plot. Both groups are plotted on the left axes; the mean difference is plotted on a floating axis on the right as a bootstrap sampling distribution. The mean difference is depicted as a large dot; the 95% confidence interval is indicated by the ends of the vertical error bar. B, Similar plot showing no significant difference between average number of synapses per fiber for Type II (ATM) and Type III (Ves Syn) cell synapses. C, Histogram showing how many NFs innervate different numbers of taste cells. Number of NFs innervating Type II cells are in blue, those innervating Type III cells are in red, and those innervating both Type II and Type III cells are in purple.
Figure 9.
Figure 9.
Examples of different patterns of innervation. A, B, Individual NFs may connect to many cells of the same type. A, Network of four Type II cells (blue) connected to a single NF (yellow). ATM in red. B, Network of seven Type III cells connected to a single NF. C, D, Individual taste cells innervated by multiple NFs. C, Type III cell synapsing with five different NFs. D, Type II cell forming synapses with four distinct NFs. E, Example of a single NF (yellow; NF07) receiving synapses from different cell types. The Type II (blue; T2C06) cell forms channel synapses while the Type III cells (red; T3C06 and T3C07) form vesicular synapses onto the same fiber.
Figure 10.
Figure 10.
A connectome diagram for the taste buds characterized in this report. TF21 taste bud 1 (A), DS2 taste bud 1 and taste bud 2 (conjoined; B), DS2 taste bud 3 (C), and TF21 taste bud 2 (D). Taste cells are denoted by colored circles as follows: green, wavy circle = Type I/II cell; teal, wavy circles = bushy-ended Type II cells; blue circles = Type II cells; purple circles = Type III cells with hybrid synapses; red circles = Type III cells with vesicular synapses. Each line denotes a single NF color coded: red fibers innervate Type III cells, blue fibers innervate Type II cells, purple fibers innervate both Type II and Type III cells. Multiply-connected fibers are shown by dots and forked connections. NF lines deepen in color for nerves that innervate increasing numbers of taste cells. Nerve processes that could not be traced to exit the taste bud are illustrated as not extending below the dashed line outlining each taste bud. ATMs are denoted by red semicircles, while “transitional” ATMs are denoted by yellow semicircles. Vesicular synapses are denoted by black semicircles. Those cells mentioned in the text are denoted by bolded lettering, and NFs mentioned in the text are labeled. The inset in C emphasizes a single NF that contacts nine ATMs in T2C01, other features of this cell are greyed out to emphasize NF4.

Similar articles

Cited by

References

    1. Akisaka T, Oda M (1978) Taste buds in the vallate papillae of the rat studied with freeze-fracture preparation. Arch Histol Jpn 41:87–98. 10.1679/aohc1950.41.87 - DOI - PubMed
    1. Araque A, Carmignoto G, Haydon PG, Oliet SH, Robitaille R, Volterra A (2014) Gliotransmitters travel in time and space. Neuron 81:728–739. 10.1016/j.neuron.2014.02.007 - DOI - PMC - PubMed
    1. Barretto RP, Gillis-Smith S, Chandrashekar J, Yarmolinsky DA, Schnitzer MJ, Ryba NJ, Zuker CS (2015) The neural representation of taste quality at the periphery. Nature 517:373–376. 10.1038/nature13873 - DOI - PMC - PubMed
    1. Caicedo A, Kim KN, Roper SD (2002) Individual mouse taste cells respond to multiple chemical stimuli. J Physiol 544:501–509. 10.1113/jphysiol.2002.027862 - DOI - PMC - PubMed
    1. Chandrashekar J, Hoon MA, Ryba NJ, Zuker CS (2006) The receptors and cells for mammalian taste. Nature 444:288–294. 10.1038/nature05401 - DOI - PubMed

Publication types

LinkOut - more resources