

Automated Segmentation of Kidney Cortex and Medulla in CT Images: A Multisite Evaluation Study
- PMID: 34876489
- PMCID: PMC8819990
- DOI: 10.1681/ASN.2021030404
Automated Segmentation of Kidney Cortex and Medulla in CT Images: A Multisite Evaluation Study
Abstract
Background: In kidney transplantation, a contrast CT scan is obtained in the donor candidate to detect subclinical pathology in the kidney. Recent work from the Aging Kidney Anatomy study has characterized kidney, cortex, and medulla volumes using a manual image-processing tool. However, this technique is time consuming and impractical for clinical care, and thus, these measurements are not obtained during donor evaluations. This study proposes a fully automated segmentation approach for measuring kidney, cortex, and medulla volumes.
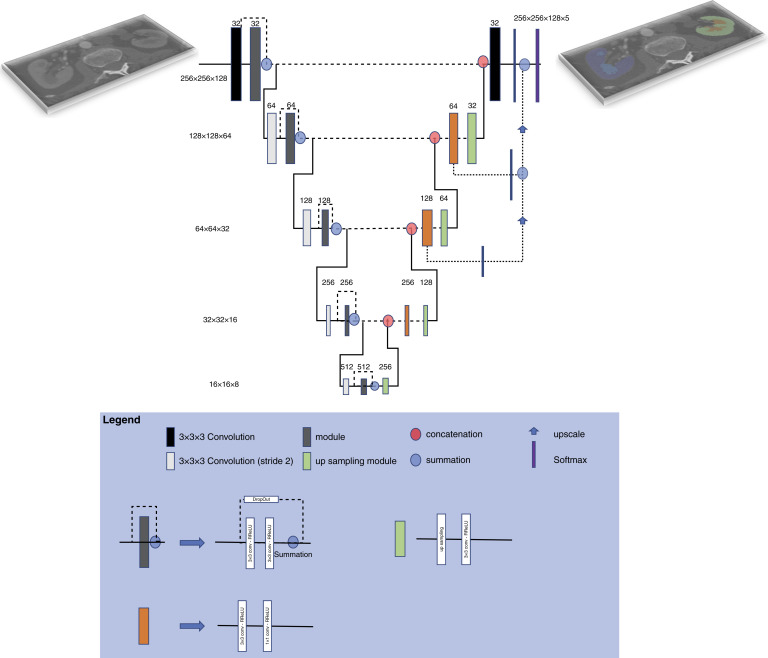
Methods: A total of 1930 contrast-enhanced CT exams with reference standard manual segmentations from one institution were used to develop the algorithm. A convolutional neural network model was trained (n=1238) and validated (n=306), and then evaluated in a hold-out test set of reference standard segmentations (n=386). After the initial evaluation, the algorithm was further tested on datasets originating from two external sites (n=1226).
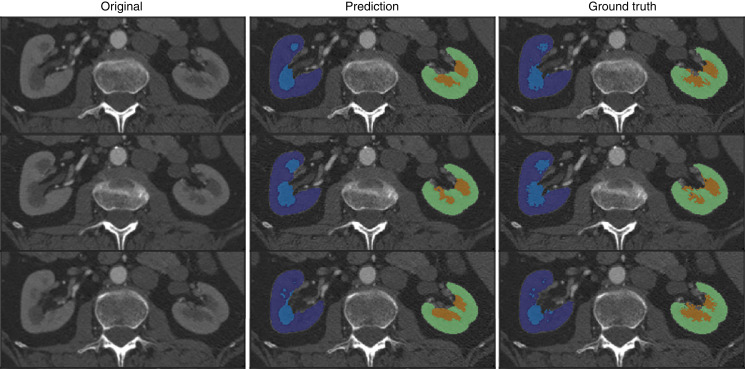
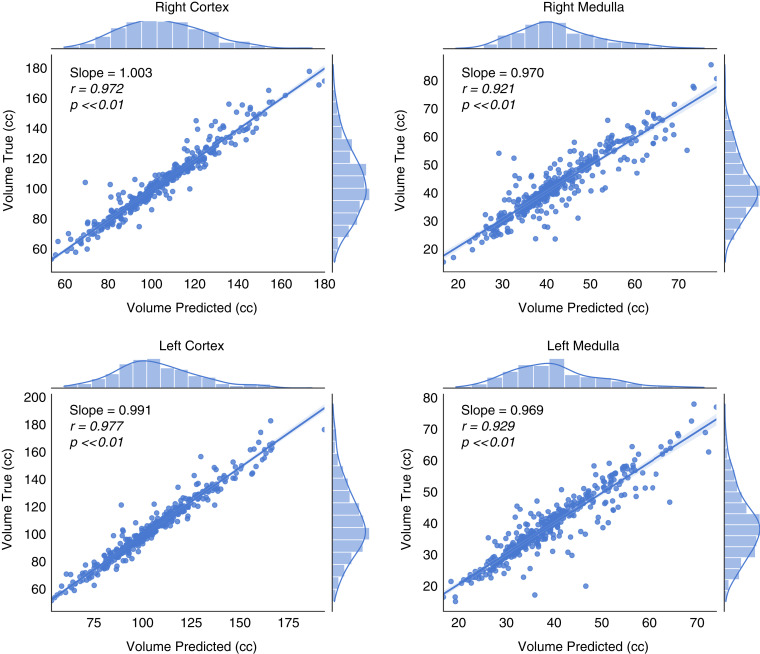
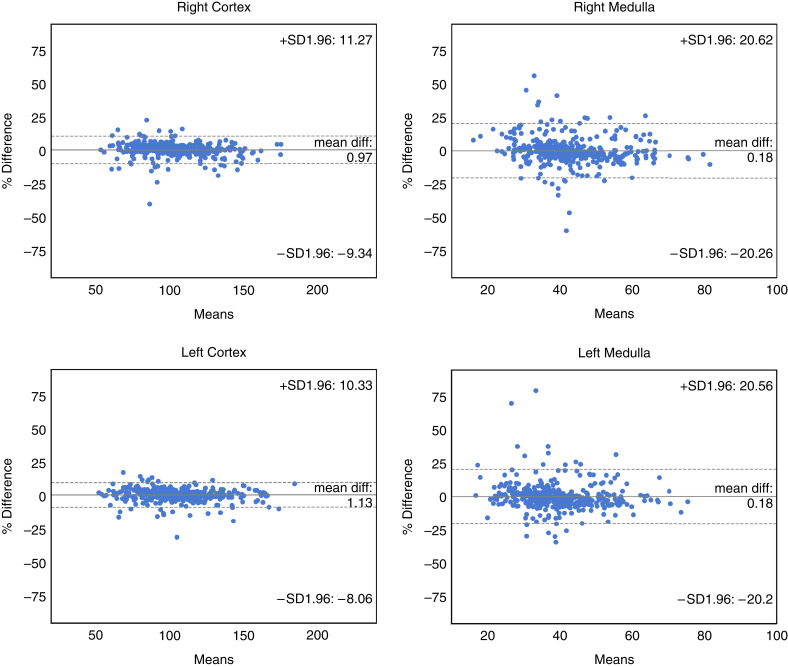
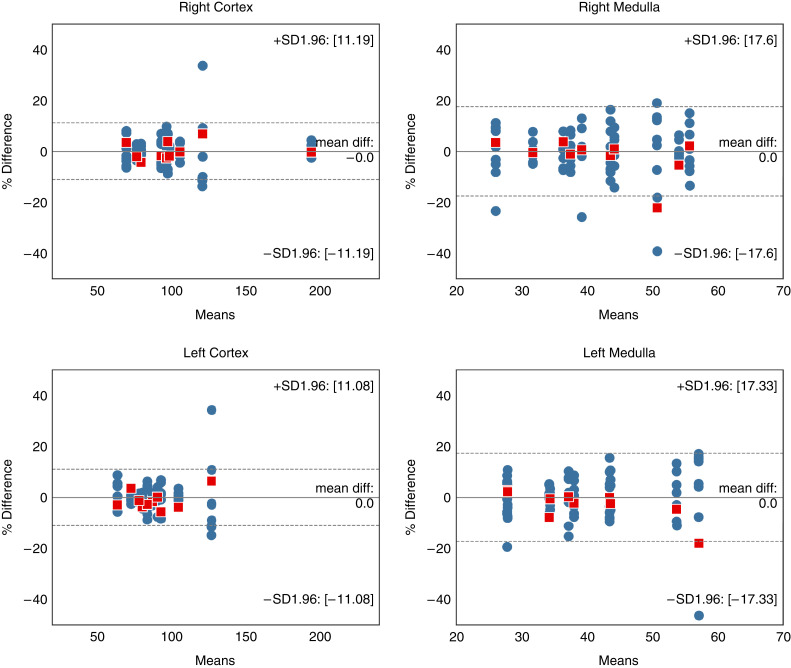
Results: The automated model was found to perform on par with manual segmentation, with errors similar to interobserver variability with manual segmentation. Compared with the reference standard, the automated approach achieved a Dice similarity metric of 0.94 (right cortex), 0.90 (right medulla), 0.94 (left cortex), and 0.90 (left medulla) in the test set. Similar performance was observed when the algorithm was applied on the two external datasets.
Conclusions: A fully automated approach for measuring cortex and medullary volumes in CT images of the kidneys has been established. This method may prove useful for a wide range of clinical applications.
Keywords: computed tomography; deep learning; kidney cortex; kidney medulla; kidney volume; machine learning collection; segmentation.
Copyright © 2022 by the American Society of Nephrology.
Figures
References
-
- Liebau MC, Serra AL: Looking at the (w)hole: Magnet resonance imaging in polycystic kidney disease. Pediatr Nephrol 28: 1771–1783, 2013 - PubMed
-
- Fick-Brosnahan GM: Endothelial dysfunction and angiogenesis in autosomal dominant polycystic kidney disease. Curr Hypertens Rev 9: 32–36, 2013 - PubMed
-
- Grantham JJ, Torres VE, Chapman AB, Guay-Woodford LM, Bae KT, King BF Jr, et al. ; CRISP Investigators : Volume progression in polycystic kidney disease. N Engl J Med 354: 2122–2130, 2006 - PubMed
-
- Dias J, Malheiro J, Almeida M, Dias L, Silva-Ramos M, Martins LS, et al. : CT-based renal volume and graft function after living-donor kidney transplantation: Is there a volume threshold to avoid? Int Urol Nephrol 47: 851–859, 2015 - PubMed
Publication types
MeSH terms
Substances
Grants and funding
LinkOut - more resources
Full Text Sources
Medical
