. 2021 Dec 14;118(50):e2102140118.
doi: 10.1073/pnas.2102140118.

Inequality, identity, and partisanship: How redistribution can stem the tide of mass polarization

Affiliations

Inequality, identity, and partisanship: How redistribution can stem the tide of mass polarization

Alexander J Stewart et al. Proc Natl Acad Sci U S A. .

Abstract

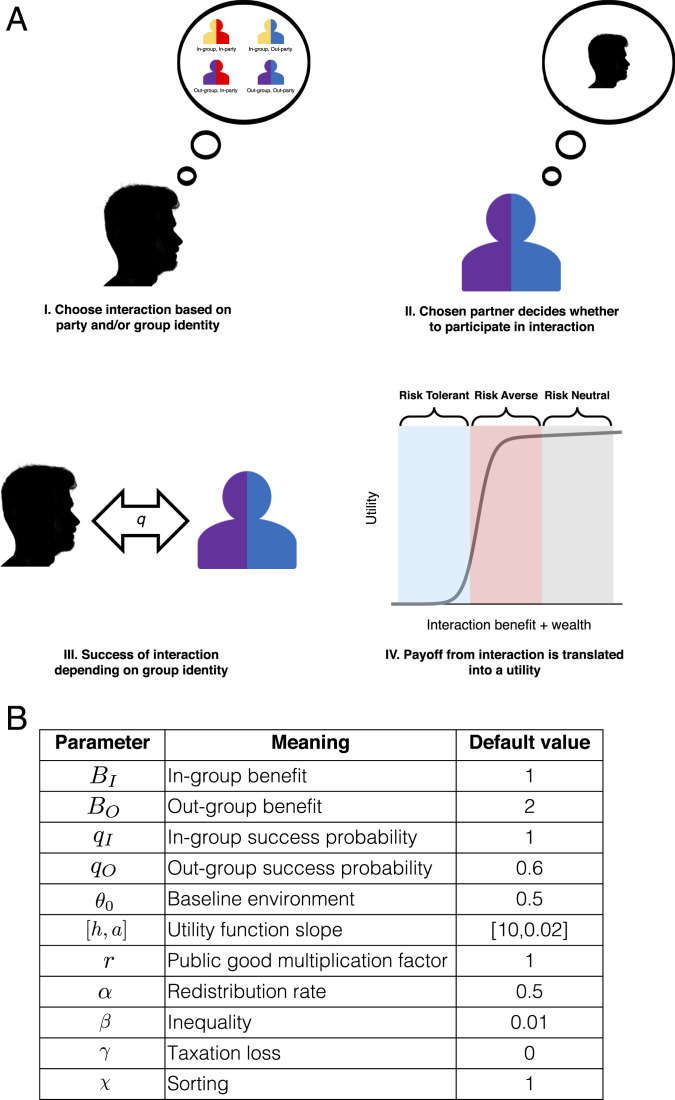
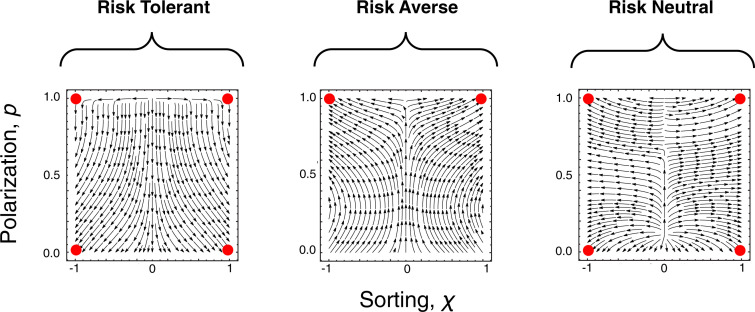
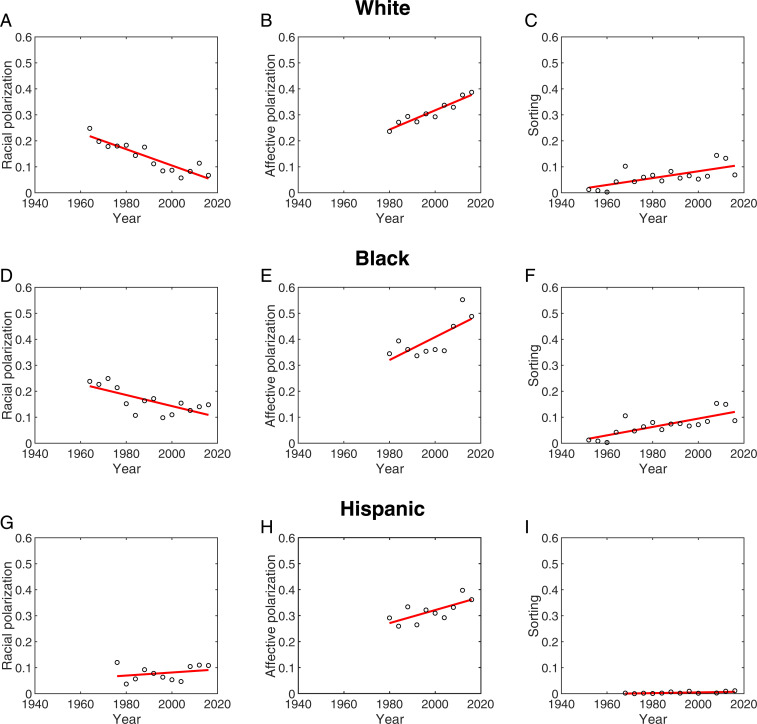
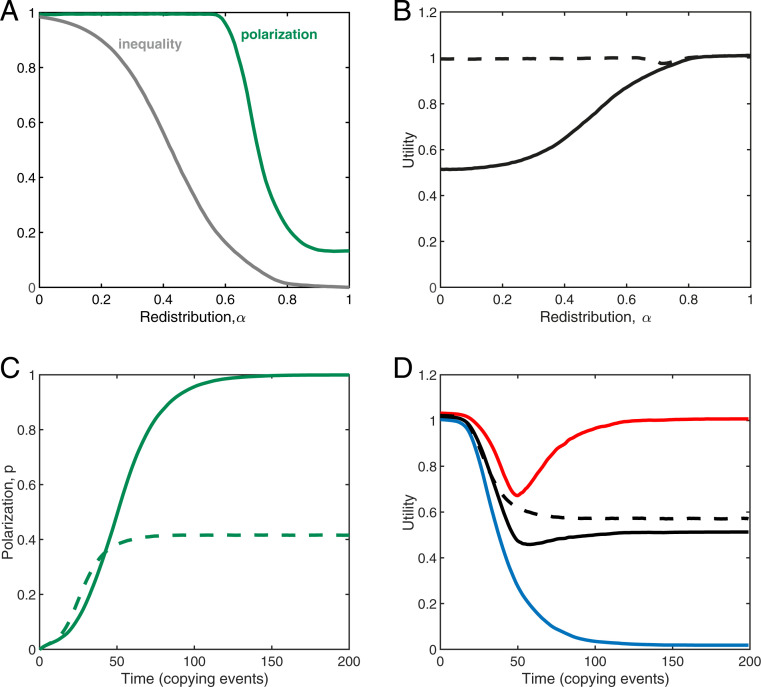
The form of political polarization where citizens develop strongly negative attitudes toward out-party members and policies has become increasingly prominent across many democracies. Economic hardship and social inequality, as well as intergroup and racial conflict, have been identified as important contributing factors to this phenomenon known as "affective polarization." Research shows that partisan animosities are exacerbated when these interests and identities become aligned with existing party cleavages. In this paper, we use a model of cultural evolution to study how these forces combine to generate and maintain affective political polarization. We show that economic events can drive both affective polarization and the sorting of group identities along party lines, which, in turn, can magnify the effects of underlying inequality between those groups. But, on a more optimistic note, we show that sufficiently high levels of wealth redistribution through the provision of public goods can counteract this feedback and limit the rise of polarization. We test some of our key theoretical predictions using survey data on intergroup polarization, sorting of racial groups, and affective polarization in the United States over the past 50 y.

Keywords: cultural evolution; inequality; polarization; risk aversion.


Conflict of interest statement

The authors declare no competing interest.

Figures

Fig. 1.
Fig. 1.
Model of social interaction and identity. (A) A focal individual (black) engages in beneficial economic interactions. (I) He first chooses a target for interaction (Table 1). In general, this decision may be based on both party and group identity. (II) The chosen target may then agree to engage or not, based on the identity of the focal individual. (III) If the pair interacts, the interaction is successful with probability qI if they share the same identity group, or qO if they belong to different identity groups. (IV) The benefit of a successful interaction is translated into a level of utility that depends on the underlying economic environment (denoted “wealth”) experienced by the focal individual. Depending on that environment, the agent’s utility function may be risk neutral (gray region), risk averse (red region), or risk tolerant (blue region), as described in Eq. 2. (B) The table shows default parameters for our analysis, although we vary these systematically in SI Appendix and show that our results are robust to parameter choice.
Fig. 2.
Fig. 2.
Polarization and sorting. Phase portraits illustrate the dynamics of polarization p and degree of sorting χ under our model of economic interactions and party switching, with fixed identity groups. Arrows indicate the average selection gradient experienced by a local mutant against a monomorphic background (see Materials and Methods). Red dots indicate stable equilibria. (Left) When the decision process for social interactions considers group or party identity, both high and low polarization states are stable, but sorting is always high |χ|=1. (Center) However, when the environment is risk averse, only high polarization and high sorting are stable. (Right) And finally, when the environment is risk neutral, the system returns to bistable polarization with high sorting. These plots show dynamics for BI=1, BO=2, qI=1.0, qO=0.6, h=10, and a=0.02. The phase portraits here show the selection gradient experienced by a monomorphic population in which parties and groups are of equal size. Dynamics under alternate decision processes (Table 1) and different parameter choices are shown in SI Appendix.
Fig. 3.
Fig. 3.
Increasing salience of party identity in the United States. We looked at (A, D, and G) in-group favorability and (B, E, and H) affective polarization among White, Black, and Hispanic respondents in ANES data at each presidential election over the past eight decades. While in-group favorability toward racial in-group versus racial out-group declines over time among (A) White (p<0.01,  t=7.3) and (D) Black (p<0.01,  t=3.5) respondents, there is no significant change among Hispanic respondents (H). Affective polarization increases among (B) White (p<0.01,  t=8.2), (E) Black (p=0.016,  t=3.1), and (H) Hispanic (p=0.021,  t=2.9) respondents, indicating a relative decline in the salience of racial identity and an increase in party identity among both the White and the Black groups, and a correspondingly weaker change among the Hispanic group. Sorting of racial groups along party lines has increased among (C) White (p<0.01,  t=3.7) and (F) Black (p<0.01,  t=4.7) respondents, but shows a much weaker change among (I) Hispanic respondents (p=0.047,  t=2.2). Sorting is measured by the variance in party preference explained by racial identity.
Fig. 4.
Fig. 4.
Redistribution and inequality. (A and B) Ensemble mean equilibria and (C and D) time trajectories for a population initialized in a low-polarization state, from individual-based simulations in the presence of wealth redistribution (Eq. 4). We show results in the case of no underlying economic inequality, β=0.5 (dashed lines), as well the case of high underlying inequality, β=0.01 (solid lines). Results shown here arise from a decision process that attends to group or party identity, and sorting is fixed exogenously at χ=1. (A) When public goods are not multiplicative (r=1 and θ0=0.5), and redistribution is absent (α=0), overall inequality (gray line, measured as the relative difference in utility; see SI Appendix) and polarization (green line) are high. With increasing rates of redistribution, first, overall inequality and, then, polarization decline to zero. (B) Increasing redistribution increases overall utility toward the level achieved when underlying inequality is absent. (C) When public goods increase overall utility (r=10 and θ0=5.4), redistribution (here α=0.5) can act to magnify both polarization and inequality over time, compared to a fixed environment without feedback via redistribution. (D) Overall inequality initially has a relatively small impact on population mean utility in a population initialized in a low-polarization state (black lines), but redistribution is seen to magnify the effects of underlying inequality, with the richer group (red line) experiencing a transient decline in utility as polarization evolves before returning to a value close to maximum, while the poorer group (blue line) suffers an irreversible decline toward utility close to zero. Plots show ensemble mean values across 104 replicate simulations, for groups of 1,000 individuals each. Success probabilities and benefits are fixed at BI=1, BO=2, qI=1.0, qO=0.6 with h=10 and a=0.02, while γ=0. Evolution occurs via the copying process (see Materials and Methods) with selection strength σ=10, mutation rate μ=103, and mutation size Δ=0.01.
Fig. 5.
Fig. 5.
Recovering from polarization. We numerically calculated the size of the basin of attraction for the high-polarization state, which determines the escape frequency—that is, the proportion of the population that must simultaneously adopt a low-polarization behavior to escape the high-polarization equilibrium. We show the escape frequency as a function of the baseline environment, θ0, and the (fixed) degree of sorting, χ. For intermediate values of theta, risk aversion means that it becomes increasingly difficult to reverse polarization (higher escape frequency, darker colors). However, when the environment is very bad, and risk tolerance dominates, or if the environment is very good, it becomes possible to reverse polarization through the coordinated behavior of small frequency of low-polarization individuals. When the environment is good and sorting is low, polarization is easiest to reverse without entering a highly deleterious environment. Other parameters are set to BI=1, BO=2, qI=1.0, qO=0.6 with h=10 and a=0.02, while γ=0, β=0.5, θ0=0.5, and r=1 unless otherwise stated.

References

    1. Mudde C., Kaltwasser C. R., Populism: A Very Short Introduction (Oxford University Press, 2017).
    1. Ahler D. J., The group theory of parties: Identity politics, party stereotypes, and polarization in the 21st century. Forum 16, 3–22 (2018).
    1. Mason L., Kalmoe N. P., What you need to know about how many Americans condone political violence — and why. The Washington Post, 11 January 2021. https://www.washingtonpost.com/politics/2021/01/11/what-you-need-know-ab.... Accessed 13 August 2021.
    1. Fiorina M. P., Abrams S. J., Pope J. C., Culture War? The Myth of a Polarized America (Pearson Longman, New York, 2005).
    1. Abramowitz A., The Disappearing Center: Engaged Citizens, Polarization, and American Democracy (Yale University Press, 2010).

LinkOut - more resources