. 2021 Dec 14;118(50):e2110281118.
doi: 10.1073/pnas.2110281118.

Microtopographical guidance of macropinocytic signaling patches

Affiliations

Microtopographical guidance of macropinocytic signaling patches

Gen Honda et al. Proc Natl Acad Sci U S A. .

Abstract

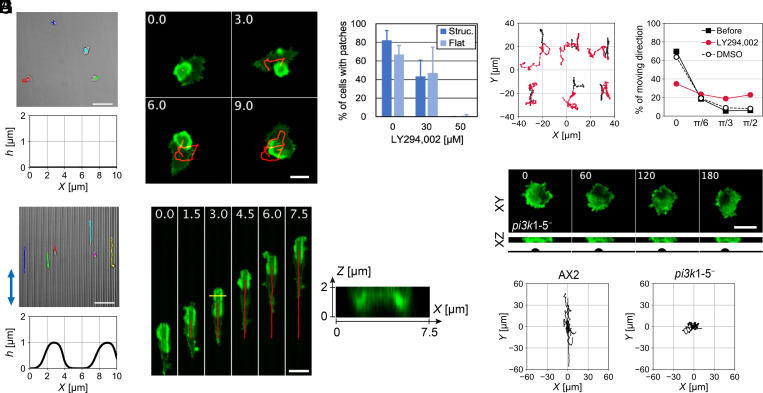
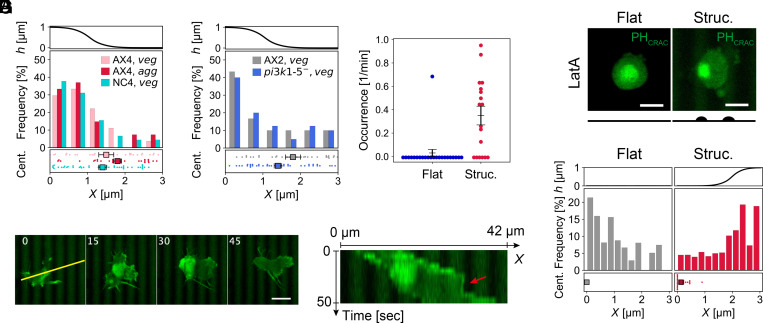
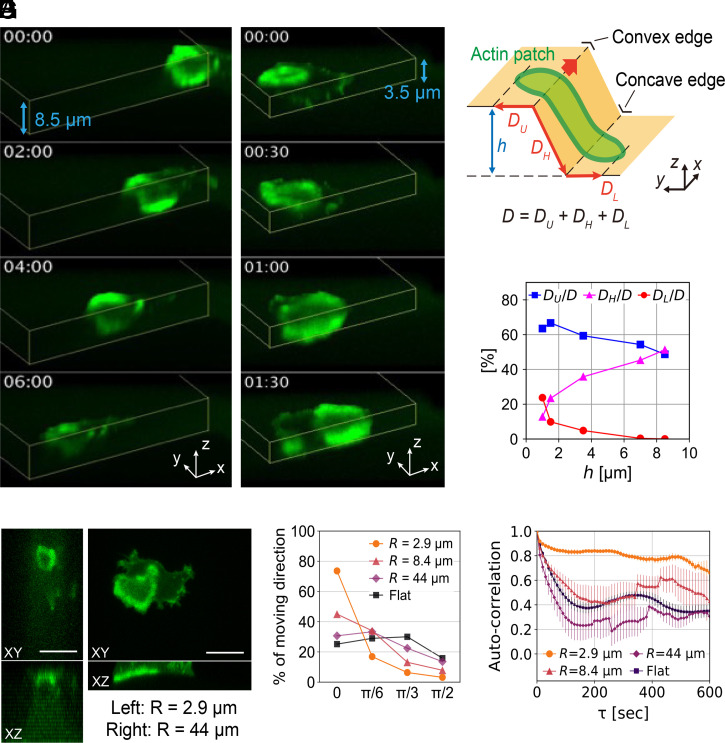
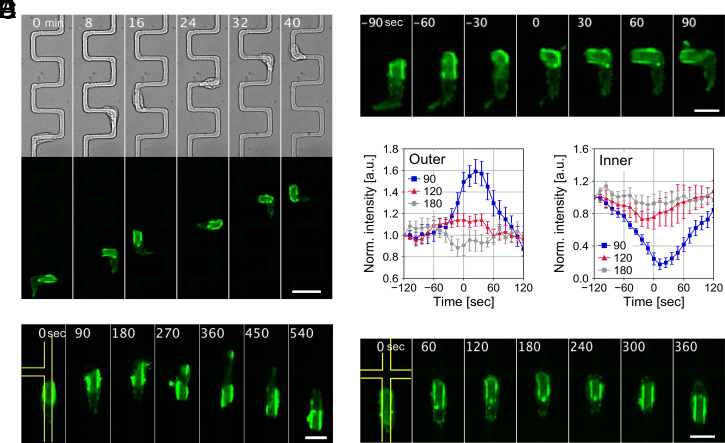
In fast-moving cells such as amoeba and immune cells, dendritic actin filaments are spatiotemporally regulated to shape large-scale plasma membrane protrusions. Despite their importance in migration, as well as in particle and liquid ingestion, how their dynamics are affected by micrometer-scale features of the contact surface is still poorly understood. Here, through quantitative image analysis of Dictyostelium on microfabricated surfaces, we show that there is a distinct mode of topographical guidance directed by the macropinocytic membrane cup. Unlike other topographical guidance known to date that depends on nanometer-scale curvature sensing protein or stress fibers, the macropinocytic membrane cup is driven by the Ras/PI3K/F-actin signaling patch and its dependency on the micrometer-scale topographical features, namely PI3K/F-actin-independent accumulation of Ras-GTP at the convex curved surface, PI3K-dependent patch propagation along the convex edge, and its actomyosin-dependent constriction at the concave edge. Mathematical model simulations demonstrate that the topographically dependent initiation, in combination with the mutually defining patch patterning and the membrane deformation, gives rise to the topographical guidance. Our results suggest that the macropinocytic cup is a self-enclosing structure that can support liquid ingestion by default; however, in the presence of structured surfaces, it is directed to faithfully trace bent and bifurcating ridges for particle ingestion and cell guidance.

Keywords: actin waves; cell migration; contact guidance; macropinocytosis; topography.


Conflict of interest statement

The authors declare no competing interest.

Figures

Fig. 1.
Fig. 1.
The ventral actin patch travels along a micrometer-scale ridge and guides cell movement. (AD) Cell trajectories and the ventral actin patch dynamics in aggregation-stage AX4 cells on flat (A and B) and structured SU-8 surface (C and D). (A and C, Upper) Transmitted-light images of a representative field of view. Colored lines: trajectories of individual cells for 20 min (Scale bars, 50 µm). (A and C, Lower) Representative surface geometry. (B and D) Time-lapse confocal images of the actin patch. Green: GFP-Lifeact; z-slice near the SU-8 surface (z = 0) (B), and maximum intensity projection (MIP) from z = 0 to 2 µm (D, Left) and the cross-section along the yellow line (D, Right). Red lines: centroid trajectories of the actin patch. Time in min (Scale bars, 10 µm). (E) Fraction of patch-positive cells after LY294,002 treatment (mean ± SE, >13 cells per condition). (F) Cell trajectories before (black, time duration 5 min) and after (red, time duration 13 min) LY294,002 application. (G) Angular distribution of cell displacement relative to the ridges before (black solid line; n = 14 cells) and after LY294,002 application (red line; n = 6 cells). DMSO mock control (black broken line; n = 8 cells). (H) GFP-Lifeact/pi3k1-5 cell (MIP from z = 0 (near the substrate) to 2 µm on XY- (Upper) and XZ plane (Lower). Time in s (Scale bar, 10 µm). (I) Trajectories of patch(+) AX2 and pi3k1-5 cells (time duration 10 min; n = 11 and 13 cells) on the structured SU-8 surface.
Fig. 2.
Fig. 2.
Ras-GTP patch is preferentially initiated at the ridge independent of PI3K/F-actin. (A and B) Distribution of F-actin (A) and Ras-GTP (B) patch nucleation along the x-axis (Upper: the ridge z-profile) for (A) aggregation-stage (agg) AX4 cells, vegetative (veg) AX4 and NC4 cells, and (B) vegetative AX2 and pi3k1-5 cells (Middle). Cell position at the time of patch nucleation (Bottom, mean ± SE, n = 28 (AX4, veg), 27 (AX4, agg), 45 (NC4, veg), 30 (AX2, veg), and 40 patches (pi3k1-5, veg), each dot represents a unique cell). (C) Frequency of ventral actin patch nucleation in vegetative NC4 cells [mean ± SE, n = 23 (Flat) and 18 cells (Structured), each dot presents a unique cell]. (D) Lifeact-GFP/NC4 on ridges (green: Lifeact-GFP; MIP from z = 0 to 3 µm). Time in s (Scale bar, 10 µm). (E) A kymograph along the yellow line in D. The image is enlarged eight times in time axis by pixel interpolation for visibility. (F) Representative snapshots from confocal images of vegetative NC4 cells expressing PHCRAC-GFP that are treated with 3 µM LatA on flat (Left) and microstructured (Right) surfaces (green: PHCRAC-GFP; MIP from z = 0 to 3 µm, the Lower schematic indicates ridge positions) (Scale bars, 5 µm). (G) Distribution of PHCRAC patch nucleation in LatA-treated NC4 cells; flat (Left, n = 75 patches) and structured (Right, n = 118 patches) surface (Middle). x = 0 is set to cell centroid for flat surface and the trough for structured surface (Upper: surface z-profile). Cell position at the time of patch nucleation (Bottom, mean ± SE, each dot represents a unique cell).
Fig. 3.
Fig. 3.
Patch propagation is directed along the convex edge and stalled at the concave edge. (A and B) 3D time-lapse images of patch-positive cells on plateaus of 8.5 µm (A) and 3.5 µm (B) height (green: GFP-Lifeact; MIP in the direction 60 degrees from the z-axis, yellow: plateau contour). Time in min:s. (C) A schematic of parameters DU, DH, DL, D, and h. (D) The height dependence of DU/D, DH/D, DL/D in AX4 cells. (EG) Curvature dependence of patch propagation. (E) Patch-positive cells on triangular ridges with curvature radius R = 2.9 µm (Left) and R = 44 µm (Right) (green: GFP-Lifeact and SU-8 fluorescence; MIP from z = 0 to 20 µm (R = 2.9 µm) and z = 0 to 7 µm (R = 44 µm) into the XY (Upper) and XZ (Lower) plane) (Scale bar, 10 µm). (F) Angular distribution of centroid displacement of patch-positive cells relative to the ridge direction. (G) Autocorrelations of patch positions in the XZ plane (shown in E, Lower) on the ridges with various curvature (mean ± SE, n = 4, 5, 5, and 9 cells).
Fig. 4.
Fig. 4.
Topographical dependence of patch propagation guides cells along zig-zag and bifurcating ridges. (A and B) Zig-zag ridges with 90-degree corners. (A, Upper) Transmitted-light images. (A, Lower and B) GFP-Lifeact; MIP from z = 0 to 2 µm. Zoom-up images of turning at the corner (B). (C and D) Change in the GFP-Lifeact intensity along the outer (C) and inner corners (D) with angles 90 (blue), 120 (red), and 180 (gray) degrees (mean ± SE, n = 16, 21, and 11 events). The patch centroid reached the corner at t = 0. (E and F) Patch reversal at a T-junction (E) and a X-junction (F). Yellow lines indicate the ridge contours. Time in min (A) and s (B, E, F) [Scale bars, 20 µm (A) and 10 µm (B, E, F)]. Ridge dimension: 1.5-µm height, 4-µm width.
Fig. 5.
Fig. 5.
Three-dimensional simulations of the macropinocytic cup dynamics recapitulate the topographical guidance. (AC) Representative snapshots from the simulations with a flat substrate (A) and with a ridge (height = 1.5 µm and width = 3.0 µm) (B and C). Surface tension was η  = 0.7 nN/μm (A and B) and 0.55  nN/μm (C). The signaling patch (red; Aψ>0), the inhibitor molecule (blue; Iψ>0) and the membrane (green; ψ>0) [merged images; side view (Left), birds-eye view (Middle), and the cross-section along the plane parallel to the surface (Right)]. Other parameters are: dx = 0.2 µm, dt = 2×10⁴  s, ε=1.2 µm, MV= 5.0 nN/µm5, τ = 10.0 nN s/µm3, F = 2.6 nN/μm2, β = 100.0, θ = 0.105, k1= 0.05 s-1, k2 = 0.5 s-1, at = 1.6, Da = 0.17 µm2/s, Di = 0.13 µm2/s for (A) and Di = 0.1 µm2/s for (B and C), K1 = 0.05, and K2 = 0.04.

Similar articles

Cited by

References

    1. Champion J. A., Mitragotri S., Role of target geometry in phagocytosis. Proc. Natl. Acad. Sci. U.S.A. 103, 4930–4934 (2006). - PMC - PubMed
    1. Clarke M., et al. , Curvature recognition and force generation in phagocytosis. BMC Biol. 8, 154 (2010). - PMC - PubMed
    1. Ray A., et al. , Anisotropic forces from spatially constrained focal adhesions mediate contact guidance directed cell migration. Nat. Commun. 8, 14923 (2017). - PMC - PubMed
    1. Kim D.-H., et al. , Mechanosensitivity of fibroblast cell shape and movement to anisotropic substratum topography gradients. Biomaterials 30, 5433–5444 (2009). - PMC - PubMed
    1. Reig G., Pulgar E., Concha M. L., Cell migration: From tissue culture to embryos. Development 141, 1999–2013 (2014). - PubMed

Publication types

LinkOut - more resources