. 2021 Dec 14;118(50):e2111267118.
doi: 10.1073/pnas.2111267118.

Intersection of regulatory pathways controlling hemostasis and hemochorial placentation

Affiliations

Intersection of regulatory pathways controlling hemostasis and hemochorial placentation

Masanaga Muto et al. Proc Natl Acad Sci U S A. .

Abstract

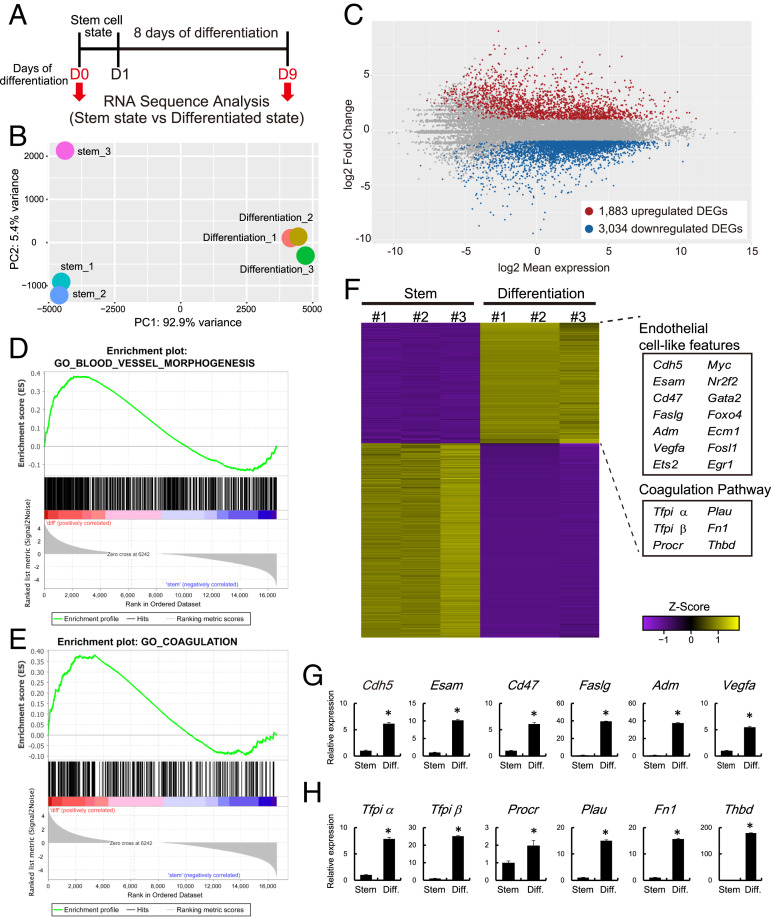
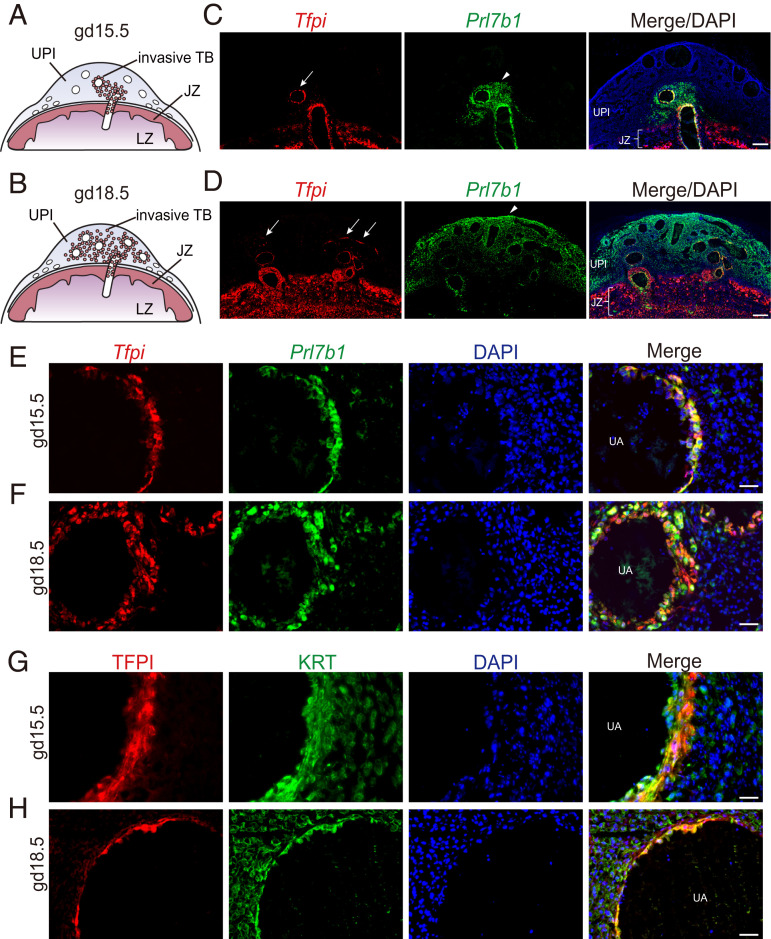
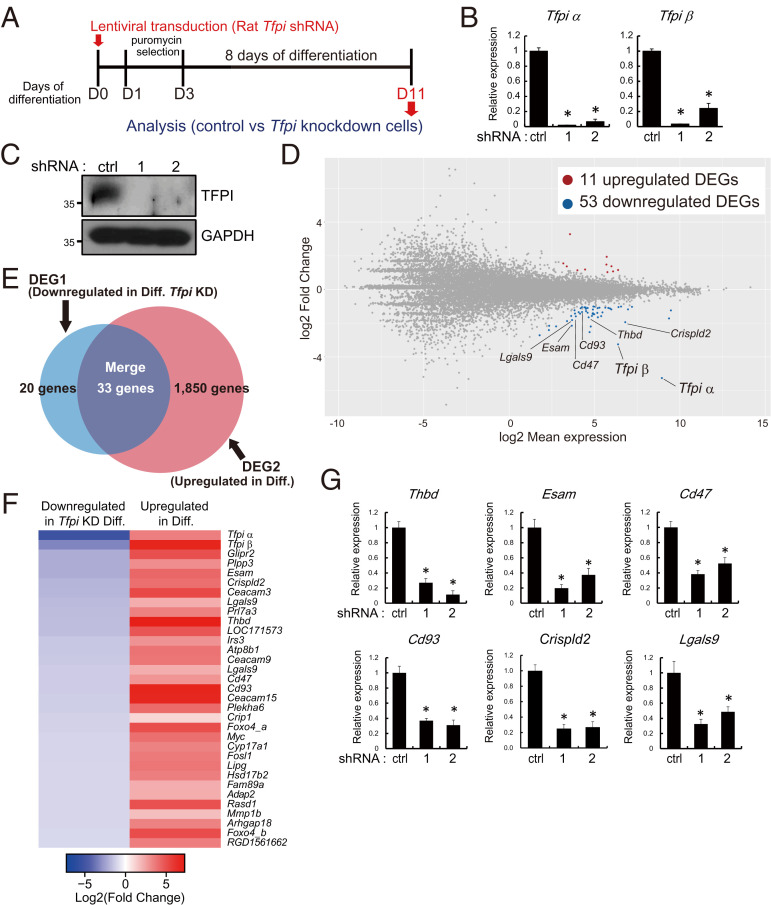
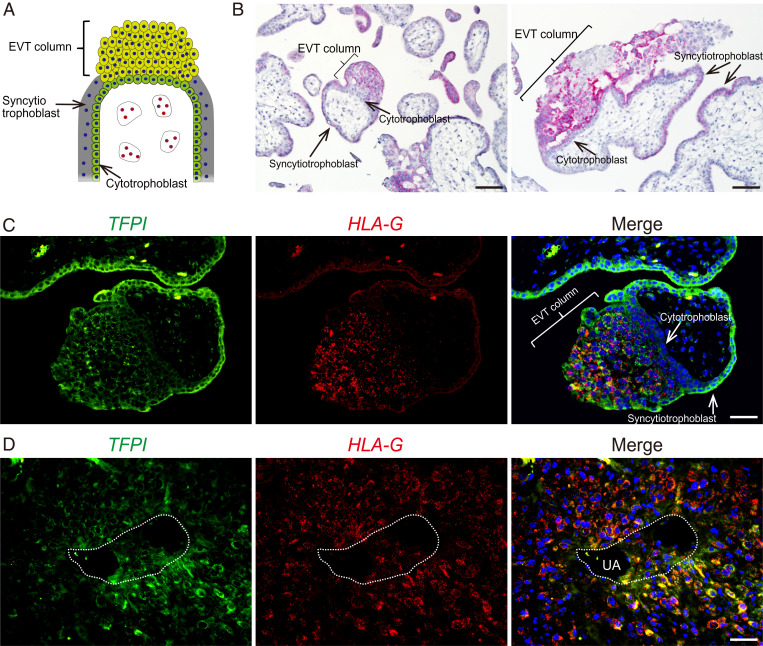
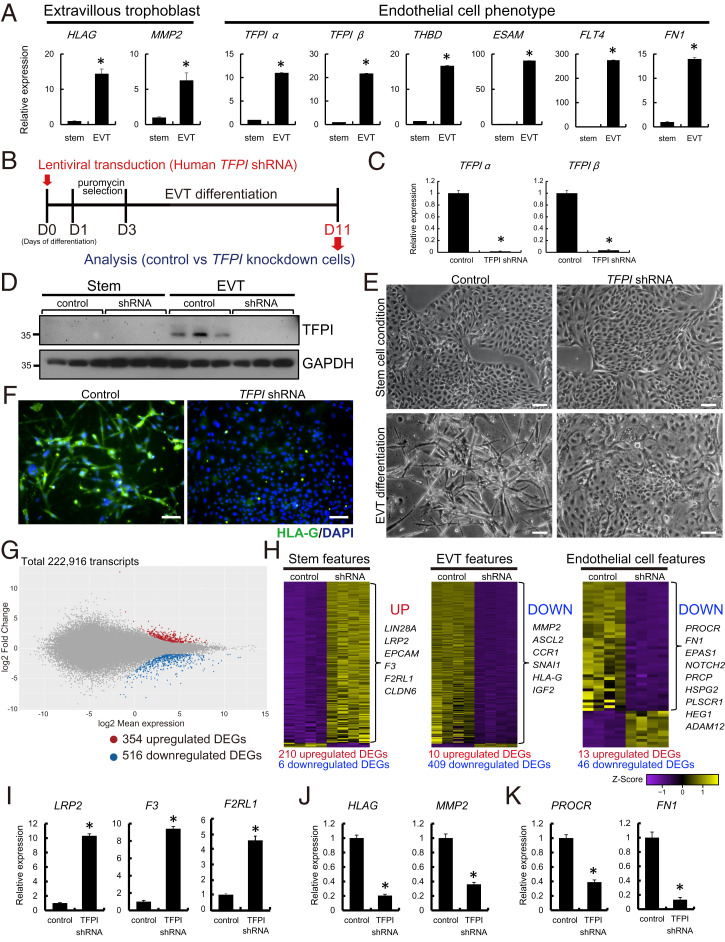
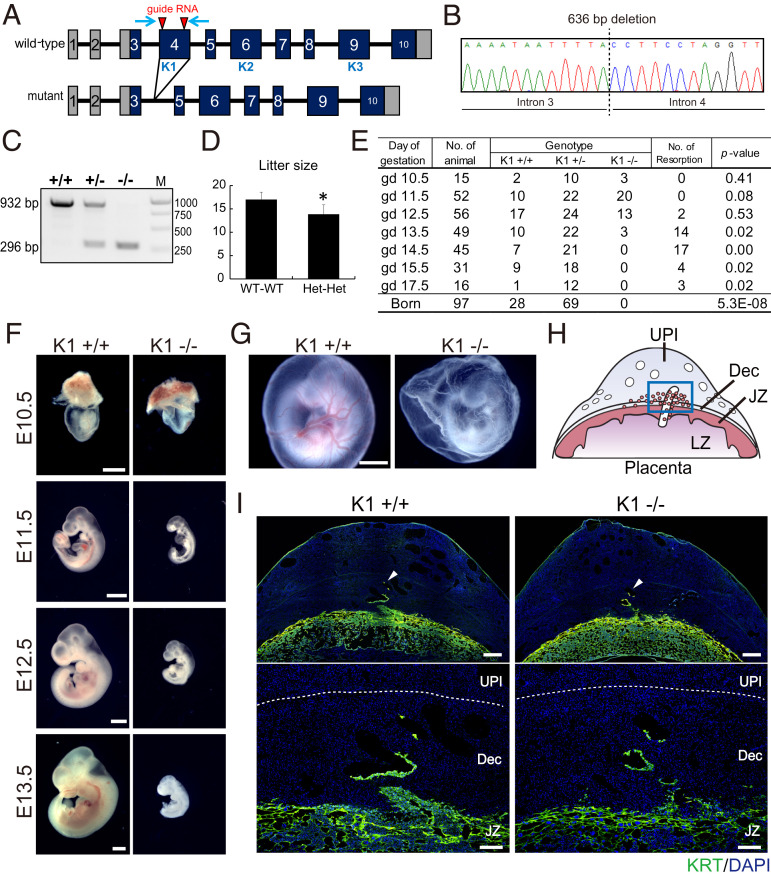
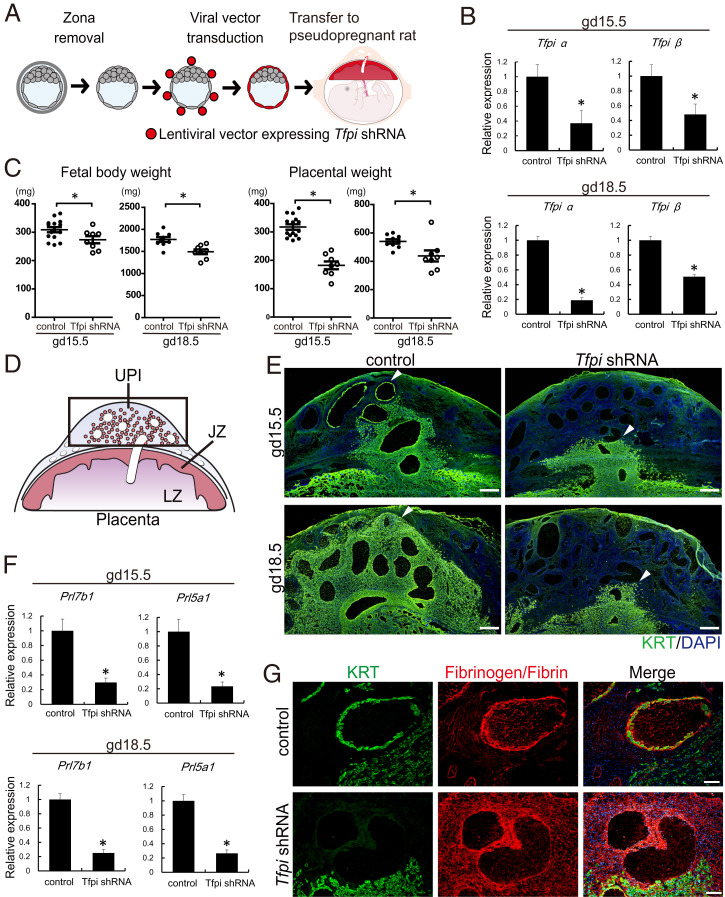
Hemochorial placentation is characterized by the development of trophoblast cells specialized to interact with the uterine vascular bed. We utilized trophoblast stem (TS) cell and mutant rat models to investigate regulatory mechanisms controlling trophoblast cell development. TS cell differentiation was characterized by acquisition of transcript signatures indicative of an endothelial cell-like phenotype, which was highlighted by the expression of anticoagulation factors including tissue factor pathway inhibitor (TFPI). TFPI localized to invasive endovascular trophoblast cells of the rat placentation site. Disruption of TFPI in rat TS cells interfered with development of the endothelial cell-like endovascular trophoblast cell phenotype. Similarly, TFPI was expressed in human invasive/extravillous trophoblast (EVT) cells situated within first-trimester human placental tissues and following differentiation of human TS cells. TFPI was required for human TS cell differentiation to EVT cells. We next investigated the physiological relevance of TFPI at the placentation site. Genome-edited global TFPI loss-of-function rat models revealed critical roles for TFPI in embryonic development, resulting in homogeneous midgestation lethality prohibiting analysis of the role of TFPI as a regulator of the late-gestation wave of intrauterine trophoblast cell invasion. In vivo trophoblast-specific TFPI knockdown was compatible with pregnancy but had profound effects at the uterine-placental interface, including restriction of the depth of intrauterine trophoblast cell invasion while leading to the accumulation of natural killer cells and increased fibrin deposition. Collectively, the experimentation implicates TFPI as a conserved regulator of invasive/EVT cell development, uterine spiral artery remodeling, and hemostasis at the maternal-fetal interface.

Keywords: hemostasis; placenta; trophoblast cell; uterine spiral artery.


Conflict of interest statement

The authors declare no competing interest.

Figures

Fig. 1.
Fig. 1.
Transcriptome analysis of rat TS cells maintained in stem and differentiation states. (A) Schematic representation of RNA-seq analysis for stem and differentiated rat TS cells. Differentiation was induced by mitogen withdrawal. (B) PCA plot of stem and differentiated rat TS cells. (C) Bland-Altman plot showing the global transcriptomic changes in differentiated rat TS cells. Colored dots indicate DEGs (≥2-fold with a false discovery rate of P < 0.05; red: up-regulated, blue: down-regulated). (D and E) GSEA of DEGs associated with rat TS cells in the stem and differentiated states. Results for “Blood vessel morphogenesis” (D) and the “Coagulation” (E) gene sets are shown. (F) Heatmap showing the expression patterns of stem and differentiated rat TS cells. These DEGs are the same genes as those shown in C. Z score-transformed RPKM are shown. The endothelial cell–associated genes and the coagulation regulatory factors were up-regulated in differentiated rat TS cells. (G) RT-qPCR transcript validation for endothelial cell–associated genes. (H) RT-qPCR transcripts validation for coagulation regulatory factors. Asterisks in G and H denote P < 0.05.
Fig. 2.
Fig. 2.
Localization of TFPI within the rat uterine-placental interface (UPI). (A and B) Schematic representations of gd 15.5 (A) and 18.5 (B) placentation sites, consisting of the junctional zone (JZ), the labyrinth zone (LZ), the UPI, and invasive trophoblast cells (TB). (C and D) Detection of Tfpi (red) and Prl7b1 (green) transcripts by in situ hybridization within gd 15.5 (C) and 18.5 (D) placentation sites. (Scale bar: 500 μm.) DAPI marks cell nuclei (blue). Arrows in the Tfpi images show localization associated with uterine spiral arterioles, and arrowheads in the Prl7b1 images demarcate the depth of intrauterine trophoblast cell invasion. (E and F) Higher-magnification images of Tfpi (red) and Prl7b1 (green) transcripts detected by in situ hybridization at the gd 15.5 (E) and 18.5 (F) uterine–placental interface. (Scale bar: 50 μm.) (G and H) Immunohistochemical detection of TFPI (red) and cytokeratin (KRT, green) proteins within endovascular trophoblast cells of gd 15.5 (G) and 18.5 (H) placentation sites. (Scale bar: 50 μm.)
Fig. 3.
Fig. 3.
TFPI is an intrinsic regulator of the trophoblast endothelial cell–like phenotype. (A) Schematic representation of lentiviral vector-mediated TFPI knockdown on differentiated rat TS cells. (B and C) Efficiency of Tfpi shRNA treatment (shRNA-1 and 2) efficiency was determined by RT-qPCR (B) and Western blotting (C). (D) MA plot showing the global transcriptomic changes in differentiated rat TS cells exposed to control or Tfpi-specific shRNAs. Colored dots indicate DEGs (≥2-fold with an FDR of P < 0.05; red: up-regulated, blue: down-regulated). Transcripts characteristic of an endothelial cell–like phenotype were down-regulated. (E) Venn diagram showing the number of down-regulated transcripts associated with the control shRNA (Ctrl) versus TFPI knockdown (KD, DEG1, red) and up-regulated transcripts associated with stem state versus differentiated (Diff) state (DEG2, blue). DEG1 and DEG2 datasets overlapped (33 of 53 transcripts). (F) Heatmap showing the 33 DEGs shared in the DEG1 and DEG2 datasets. Left column shows the Log2 (fold change) of transcripts down-regulated by TFPI knockdown, whereas the right column shows the Log2 (fold change) of transcripts up-regulated in differentiated trophoblast cells (ascending order). (G) RT-qPCR validation of selected down-regulated transcripts in Tfpi shRNA–treated cells. Comparisons were performed on control versus Tfpi-specific shRNA-exposed cells. Asterisks denote P < 0.05.
Fig. 4.
Fig. 4.
TFPI is expressed in human placentation sites. (A) Schematic diagram of the structure of a human villous. (B) Two images showing localization of TFPI transcripts (red) to the EVT column and syncytiotrophoblast in the first-trimester human placenta. (C and D) Duplex in situ hybridization of TFPI (green) and HLA-G (red) in the first-trimester human placenta (C) and in first-trimester EVT cells associated with a uterine spiral arteriole (UA) (D). Note that TFPI is expressed in HLA-G–positive EVT cells, HLA-G–positive endovascular trophoblast cells, and syncytiotrophoblast cells. (Scale bar: 50 μm.)
Fig. 5.
Fig. 5.
TFPI is a regulator of human TS cell differentiation into EVT cells. (A) RT-qPCR analysis of stem cell and differentiated EVT cell states of human TS cells. Endothelial cell–associated transcripts, including TFPI alpha and beta, were significantly up-regulated in EVT cells. (B) Schematic representation of lentiviral vector-mediated TFPI knockdown on human TS cells and analysis on EVT cell differentiated state. (C and D) Efficiency of TFPI shRNA (#1) treatment was determined by RT-qPCR for TFPI alpha and beta (C) and Western blotting for TFPI (D). (E) Representative phase contrast images of stem state human TS cells and differentiated EVT cells transduced with lentivirus containing control or TFPI shRNA. (Scale bar: 200 μm.) (F) Immunocytochemistry of HLA-G expression (green) of differentiated EVT cells treated with control and TFPI shRNAs. (Scale bar: 100 μm.) DAPI marks cell nuclei (blue). (G) MA plot showing the global transcriptomic changes in differentiated human EVT cells exposed to control or TFPI-specific shRNAs. Colored dots indicate DEGs (≥2-fold with a false discovery rate of P < 0.05; red: up-regulated, blue: down-regulated). (H) Heatmap representation of Z-score–transformed RPKM values of transcripts predominantly expressed in the stem cell state (Stem features, Left), differentiated EVT cell state (EVT features, Middle). Classification of stem and EVT cell features were based on RNA-seq analysis of human TS cells in the stem and differentiated EVT cell states (17). Endothelial cell–associated transcripts (Endothelial cell features, Right) were determined from “Blood vessel morphogenesis” and “Coagulation” gene sets extracted from GO:0050817 and GO:0048514. (IK) RT-qPCR validation of selected up- or down-regulated transcripts, including stem cell (I), EVT cell (J), and endothelial cell (K) characteristic transcripts in EVT cells transduced with control or TFPI shRNAs. Asterisks denote P < 0.05.
Fig. 6.
Fig. 6.
Phenotypic analysis of Kunitz domain 1 (K1) Tfpi mutant rat. (A) Schematic representation of the rat Tfpi gene and the disruption of the K1 domain using CRISPR-Cas9 system. The red arrowheads indicate target sites for the guide RNAs used in genome editing. The blue arrows indicate positioning of the primer set used to amplify the Tfpi K1 domain. K1, Kunitz domain 1; K2, Kunitz domain 2; K3, Kunitz domain 3. (B) DNA sequence analysis showing a 636-bp deletion within the Tfpi locus, resulting in the deletion of the entire Exon 4, leading to a deletion of the K1 domain and an in-frame mutation. (C) Genotyping of wild type (+/+), heterozygous (+/−), and homozygous mutant (−/−) Tfpi alleles. The wild-type allele (932 bp) and mutant allele (296 bp) were detected by PCR. M denotes molecular size markers. (D) Litter sizes from Tfpi K1 heterozygous intercrosses. *P < 0.05. (E) Table showing the Mendelian ratios for gd 10.5 through 17.5 and postdelivery. (F and G) Macroscopic analysis of wild-type and K1 homozygous mutant embryos at E10.5, E11.5, E12.5, and E13.5 (F) and yolk sac at E11.5 (G). (Scale bar: 1 mm.) (H) Schematic representation of a midgestation placentation site, consisting of the uterine–placental interface (UPI), junctional zone (JZ), and labyrinth zone (LZ). The blue box in H corresponds to the uterine–placental interface for I. (I) Cytokeratin (KRT) immunohistochemical analysis for wild-type and Tfpi K1 mutant placentas (gd 12.5). The lower panels are high-magnification images of the upper panels. Arrowheads in the upper panels demarcate the depth of intrauterine trophoblast cell invasion. The demarcation of the decidua (Dec) and UPI is shown as a dashed white line. (Scale bars of upper panels: 500 µm. Scale bars of lower panels: 200 µm.)
Fig. 7.
Fig. 7.
Effects of trophoblast-specific Tfpi knockdown on the uterine–placental interface (UPI). (A) Schematic diagram of in vivo lentiviral vector-mediated trophoblast-specific Tfpi knockdown. Rat blastocysts were transduced with lentivirus-expressing control or Tfpi shRNAs and subsequently transferred to pseudopregnant animals. (B) Efficiency of the Tfpi knockdown in the junctional zone of rat placentation sites were determined by RT-qPCR (gd 15.5 and 18.5). (C) Fetal and placental weights of control and Tfpi shRNA-transduced embryos (gd 15.5 and gd 18.5). (D) Schematic representation of a midgestation placentation site. The black box corresponds to the location of the UPI. (E) Immunohistochemisty of KRT (green) within the metrial gland at gd 15.5 and 18.5 placentation sites. Depth of intrauterine trophoblast cell invasion was decreased in Tfpi shRNA-transduced placentation sites compared to control. (Scale bar: 500 μm.) Arrowheads demarcate the depth of intrauterine trophoblast cell invasion. (F) Quantification of invasive trophoblast cell-specific transcripts (Prl5a1 and Prl7b1) within the UPI (gd 15. 5 and gd 18.5) of control and Tfpi shRNA-exposed placentation sites as measured by RT-qPCR. Asterisks denote P < 0.05. (G) Immunohistochemisty of KRT (green) and fibrinogen (red) within the gd 15.5 UPI of control and Tfpi shRNA-exposed placentation sites. Fibrinogen deposition was observed in placentation sites from blastocysts transduced with Tfpi shRNA. (Scale bar: 100 μm.)

Similar articles

Cited by

References

    1. Burton G. J., Fowden A. L., Thornburg K. L., Placental origins of chronic disease. Physiol. Rev. 96, 1509–1565 (2016). - PMC - PubMed
    1. Roberts R. M., Green J. A., Schulz L. C., The evolution of the placenta. Reproduction 152, R179–R189 (2016). - PMC - PubMed
    1. Kaufmann P., Black S., Huppertz B., Endovascular trophoblast invasion: Implications for the pathogenesis of intrauterine growth retardation and preeclampsia. Biol. Reprod. 69, 1–7 (2003). - PubMed
    1. Pijnenborg R., Vercruysse L., Hanssens M., The uterine spiral arteries in human pregnancy: Facts and controversies. Placenta 27, 939–958 (2006). - PubMed
    1. Harris L. K., Aplin J. D., Vascular remodeling and extracellular matrix breakdown in the uterine spiral arteries during pregnancy. Reprod. Sci. 14, 28–34 (2007). - PubMed

Publication types

Substances