. 2021 Dec 7;9(1):50.
doi: 10.1038/s41413-021-00173-x.

Runx1 protects against the pathological progression of osteoarthritis

Affiliations

Runx1 protects against the pathological progression of osteoarthritis

Chenchen Zhou et al. Bone Res. .

Abstract

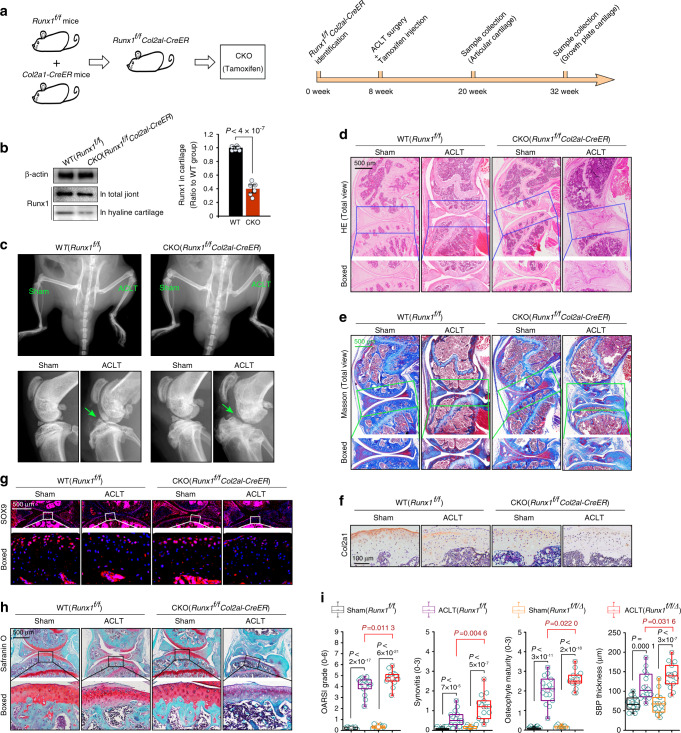
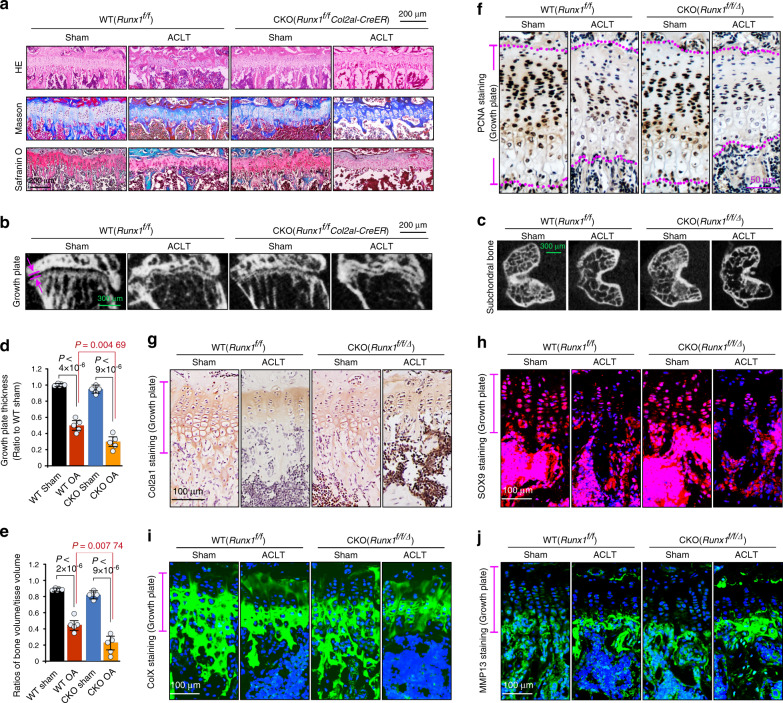
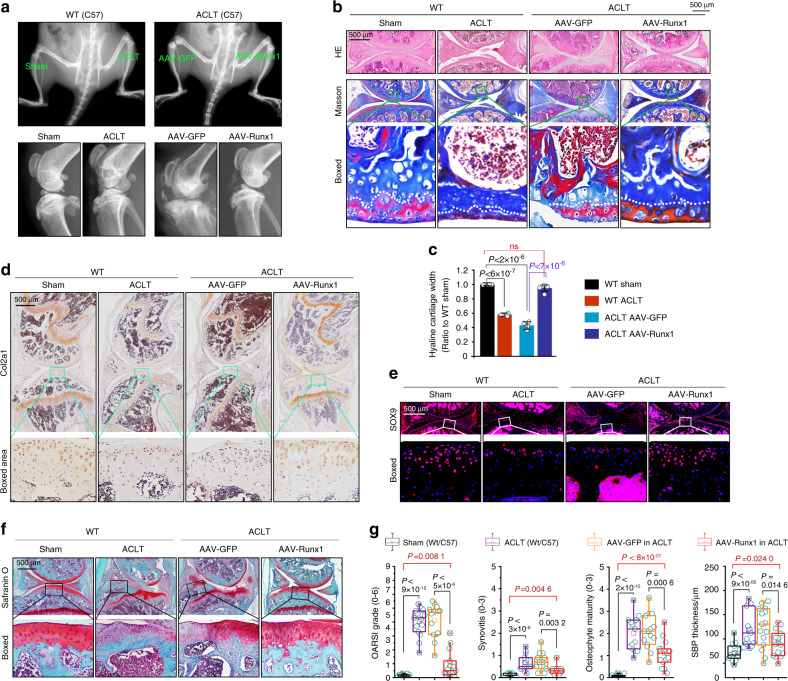
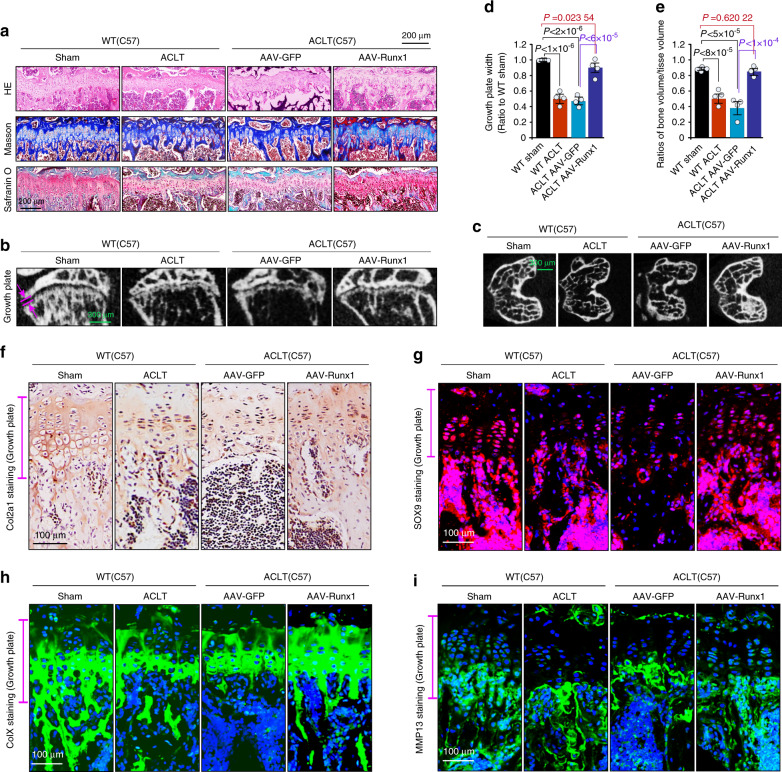
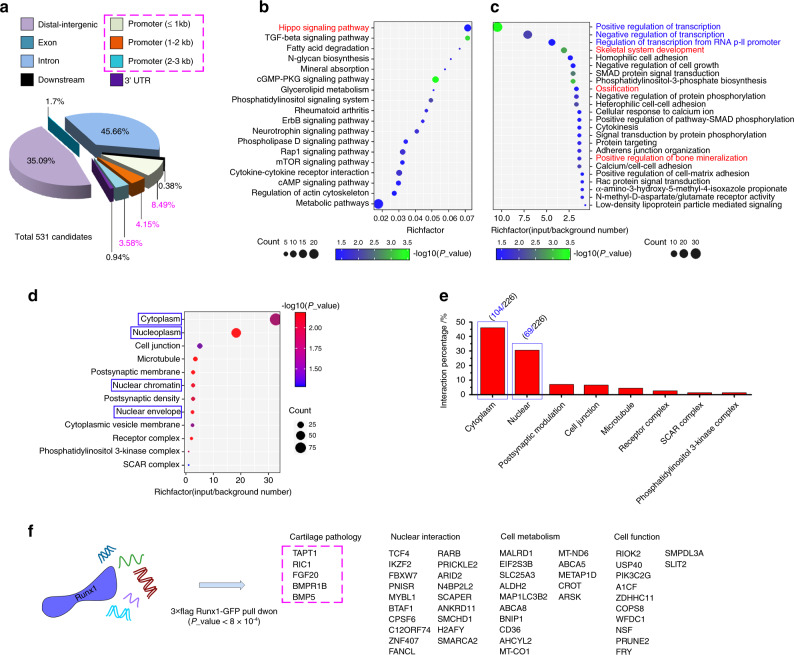
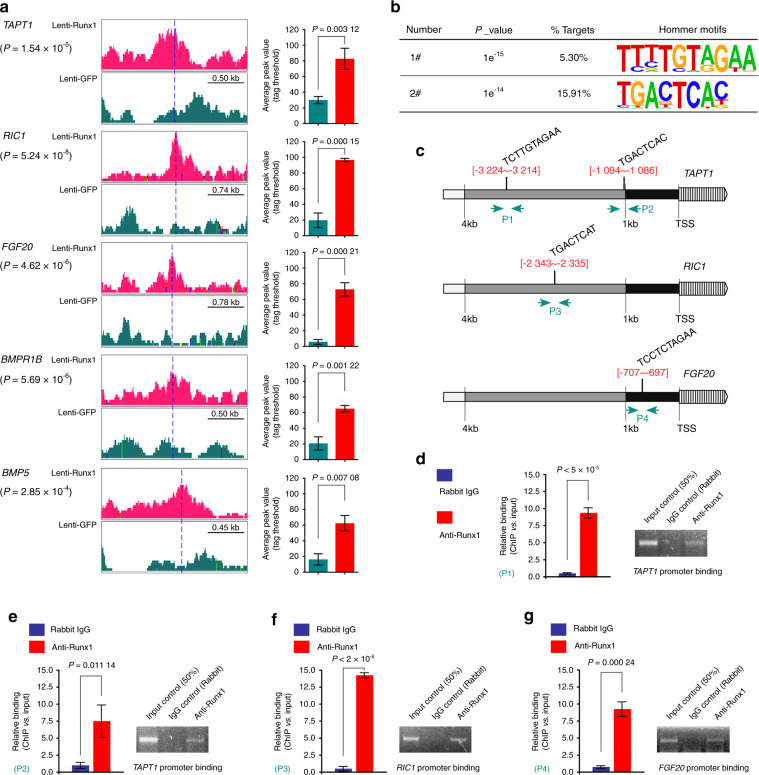
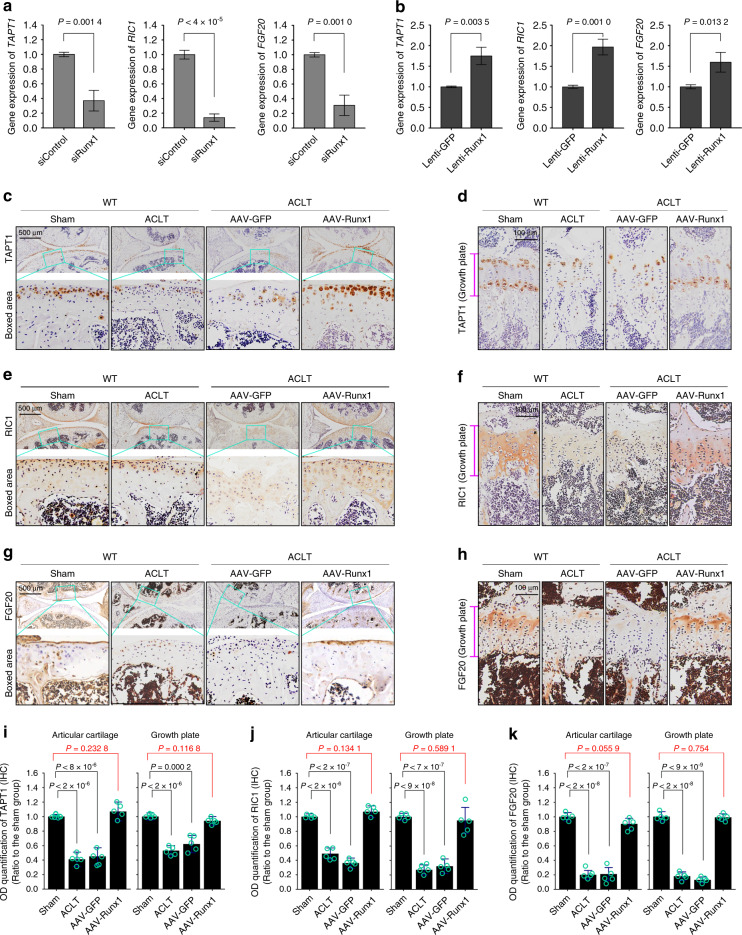
Runt-related transcription factor-1 (Runx1) is required for chondrocyte-to-osteoblast lineage commitment by enhancing both chondrogenesis and osteogenesis during vertebrate development. However, the potential role of Runx1 in joint diseases is not well known. In the current study, we aimed to explore the role of Runx1 in osteoarthritis induced by anterior cruciate ligament transaction (ACLT) surgery. We showed that chondrocyte-specific Runx1 knockout (Runx1f/fCol2a1-Cre) aggravated cartilage destruction by accelerating the loss of proteoglycan and collagen II in early osteoarthritis. Moreover, we observed thinning and ossification of the growth plate, a decrease in chondrocyte proliferative capacity and the loss of bone matrix around the growth plate in late osteoarthritis. We overexpressed Runx1 by adeno-associated virus (AAV) in articular cartilage and identified its protective effect by slowing the destruction of osteoarthritis in cartilage in early osteoarthritis and alleviating the pathological progression of growth plate cartilage in late osteoarthritis. ChIP-seq analysis identified new targets that interacted with Runx1 in cartilage pathology, and we confirmed the direct interactions of these factors with Runx1 by ChIP-qPCR. This study helps us to understand the function of Runx1 in osteoarthritis and provides new clues for targeted osteoarthritis therapy.


Conflict of interest statement

The authors declare no competing interests.

Figures

Fig. 1
Fig. 1
Runx1 knockout aggravates articular cartilage destruction in an ACLT-induced mouse OA model. a Schematic diagram showing the generation of Runx1-knockout mice and the detailed sample collection procedure. We achieved chondrocyte-specific Runx1 knockout by intraperitoneal tamoxifen injection at 3–5 days after recovery from ACLT surgery. We performed intraperitoneal tamoxifen injection twice per week. After 2 weeks of injections, cartilage genotyping was performed to determined whether Runx1 knockout was achieved. b Western blotting and quantification showing the expression of Runx1 in the total joint and articular cartilage of Runx1-knockout mice. c In vivo imaging showing the joint destruction in Runx1-knockout mice at 12 weeks after ACLT surgery. d H&E staining showing pathological changes in articular cartilage in Runx1-knockout mice at 12 weeks after ACLT surgery. e Masson staining showing pathological changes in articular cartilage in Runx1-knockout mice at 12 weeks after ACLT surgery. f IHC staining showing the expression of Col2a1 in articular cartilage in Runx1-knockout mice at 12 weeks after ACLT surgery. g Immunofluorescence showing the expression of SOX9 in articular cartilage in Runx1-knockout mice at 12 weeks after ACLT surgery. h Safranin O staining showing the loss of proteoglycan in articular cartilage in Runx1-knockout mice at 12 weeks after ACLT surgery. i The degree of experimental mouse OA was evaluated by scoring cartilage destruction (Osteoarthritis Research Society International (OARSI) grade), synovitis, osteophyte maturity, and subchondral bone plate (SBP) thickness (suggestive of sclerosis). Runx1f/f/Δ Runx1 knockout. These results are based on at least three independent experiments (n = 3). The standard Mann–Whitney U test was used for the OARSI grade, synovitis, osteophyte maturity and SBP thickness, and the data in i (right) are shown as box (from 25%, 50% to 75%) and whisker (minimum to maximum values) plots. All significance data presented in b and i are based on two-tailed Student’s t-tests
Fig. 2
Fig. 2
Runx1 knockout affects the pathological changes in growth plate cartilage. a Histological staining, including H&E, Masson, and safranin O, showing the changes in growth plate cartilage in Runx1-knockout mice at 24 weeks after ACLT surgery. b μ-CT showing the thickness change in growth plate cartilage in Runx1-knockout mice at 24 weeks after ACLT surgery. c μ-CT showing the changes in subchondral cancellous bone in Runx1-knockout mice at 24 weeks after ACLT surgery. d Quantitative analysis of growth plate width (thickness) in b Runx1 knockout mice at 24 weeks post ACLT surgery. e Quantitative analysis of BV/TV in c in Runx1 knockout mice at 24 weeks post ACLT surgery. f IHC staining showing the proliferative capacity of chondrocytes by characterizing PCNA expression in the growth plate in Runx1-knockout mice at 24 weeks after ACLT surgery. g IHC staining showing the changes in Col2a1 in the growth plate in Runx1-knockout mice at 24 weeks after ACLT surgery. h Immunofluorescence staining showing the changes in SOX9 in the growth plate in Runx1-knockout mice at 24 weeks after ACLT surgery. i Immunofluorescence staining showing the changes in ColX in the growth plate in Runx1-knockout mice at 24 weeks after ACLT surgery. j Immunofluorescence staining showing the changes in MMP13 in the growth plate in Runx1-knockout mice at 24 weeks after ACLT surgery. All these results above are based on at least three independent experiments (n = 3). All significance data presented in d and e are based on two-tailed Student’s t-tests. Runx1f/f/∆ Runx1 knockout
Fig. 3
Fig. 3
AAV-Runx1 overexpression protects against cartilage destruction in an ACLT-induced mouse OA model. a In vivo imaging showing that overexpression of Runx1 in chondrocytes protects against cartilage destruction in an ACLT-induced mouse OA model. b Histological staining including HE, Masson, and safranin O showing the effects of AAV-Runx1 overexpression in articular cartilage at 12 weeks post ACLT surgery. c Quantitative analysis indicating the changes in mature articular cartilage thickness in b. d IHC staining showing the expression of Col2a1 in AAV-Runx1-overexpressing articular cartilage at 12 weeks post ACLT surgery. e Immunofluorescence staining showing the changes in SOX9 in AAV-Runx1-overexpressing articular cartilage at 12 weeks post ACLT surgery. f Safranin O staining showing the changes in proteoglycans in AAV-Runx1-overexpressing articular cartilage at 12 weeks post ACLT surgery. g Cartilage protection effects in AAV-Runx1-overexpressing articular cartilage were evaluated by OARSI grade, synovitis, osteophyte maturity, and SBP thickness. These results are based on at least three independent experiments (n = 3). The standard Mann–Whitney U test was used for the OARSI grade, synovitis, osteophyte maturity and SBP thickness, and the data in g are shown as box (from 25%, 50% to 75%) and whisker (minimum to maximum values) plots. All significance data presented in c and g are based on two-tailed Student’s t-tests
Fig. 4
Fig. 4
AAV-Runx1 overexpression alleviates the pathological changes in growth plate cartilage. a Histological staining, including H&E, Masson, and safranin O, showing the effects of AAV-Runx1 overexpression on growth plate cartilage at 24 weeks after ACLT surgery. b μ-CT results showing changes in the thickness of growth plate cartilage in AAV-Runx1-overexpressing articular cartilage at 24 weeks after ACLT surgery. c μ-CT results showing the changes in subchondral cancellous bone in AAV-Runx1-overexpressing articular cartilage at 24 weeks after ACLT surgery. d Quantitative analysis of the thickness (width) in b in growth plate cartilage in AAV-Runx1-overexpressing mice. e Quantitative analysis of BV/TV in c in AAV-Runx1-overexpressing mice at 24 weeks after ACLT surgery. f IHC staining showing the changes in Col2a1 in the growth plate in AAV-Runx1-overexpressing articular cartilage at 24 weeks after ACLT surgery. g Immunofluorescence staining showing the changes in SOX9 in the growth plate in AAV-Runx1-overexpressing articular cartilage at 24 weeks after ACLT surgery. h Immunofluorescence staining showing the changes in ColX in the growth plate in AAV-Runx1-overexpressing articular cartilage at 24 weeks after ACLT surgery. i Immunofluorescence staining showing the changes in MMP13 in the growth plate in AAV-Runx1-overexpressing articular cartilage at 24 weeks after ACLT surgery. These results are based on at least three independent experiments (n = 3). All significance data presented in d and e are based on two-tailed Student’s t-tests
Fig. 5
Fig. 5
ChIP sequencing identified the key target genes in cartilage pathology. a Pie chart showing the total classification of target DNA fragments pulled down by the 3× Flag-Runx1-GFP tag. b KEGG analysis showing that the DNA fragments in the promoter region (≤3 kb) were enriched in 18 pathways. c Biological process (BP) GO analysis showing that the targets that interact with Runx1 had high proportions in the cytoplasm and nucleus. Red processes show targets related to cartilage pathology. Blue processes show targets in the nucleus. d Cellular component (CC) GO analysis showing the distributions of targets among chondrocyte components. e The specific proportions of targets that interact with Runx1 in chondrocytes. f Gene functional analysis indicating new targets that interact with Runx1 in chondrocytes in addition to the reported conventional binding genes
Fig. 6
Fig. 6
Detailed binding of Runx1 to the promoters of target genes in the context of chondrocyte pathology. a Peak values of target genes in chondrocyte pathology were identified by using IGV analysis. The specific average peak values are shown in the right histograms. b Motif analysis based on Runx1-ChIP-seq (hommer) identified two sequences at the promoter regions of these target genes in the context of chondrocyte pathology. c Bioinformatics analysis indicated the specific locations of these two sequences in the promoters of the TAPT1, RIC1, and FGF20 genes. d ChIP-qPCR confirmed one binding site (−3 224 to −3 214) of Runx1 in the promoter of the TAPT1 gene. Strip diagrams from electrophoretic gels based on ChIP-qPCR products confirmed this result. e ChIP-qPCR confirmed another binding site (−1 094 to −1 086) of Runx1 in the promoter of the TAPT1 gene. Strip diagrams from electrophoretic gels based on ChIP-qPCR products confirmed this result. f ChIP-qPCR confirmed the binding site (−2 343 to −2 335) of Runx1 in the promoter of the RIC1 gene. Strip diagrams from electrophoretic gels based on ChIP-qPCR products confirmed this result. g ChIP-qPCR confirmed the binding site (−707 to −697) of Runx1 in the promoter of the FGF20 gene. Strip diagrams from electrophoretic gels based on ChIP-qPCR products confirmed this result. These results are based on at least three independent experiments (n = 3). All significance data presented in a, d, e, f, and g are based on two-tailed Student’s t-tests
Fig. 7
Fig. 7
The expression of target candidates in cartilage. a qPCR results showing changes in TAPT1, RIC1, and FGF20 in chondrocytes induced by siRunx1. b qPCR results showing changes in TAPT1, RIC1, and FGF20 in chondrocytes induced by Runx1 overexpression. c, d IHC staining showing AAV-Runx1 overexpression-induced changes in TAPT1 expression in articular cartilage at 12 weeks after ACLT surgery (a) and the growth plate at 24 weeks after ACLT surgery (b). ef IHC staining showing AAV-Runx1 overexpression-induced changes in RIC1 expression in articular cartilage at 12 weeks after ACLT surgery (a) and the growth plate at 24 weeks after ACLT surgery (b). gh IHC staining showing AAV-Runx1 overexpression-induced changes in FGF20 expression in articular cartilage at 12 weeks after ACLT surgery (a) and the growth plate at 24 weeks after ACLT surgery (b). i Optical density quantitative analysis showing changes in TAPT1 expression in articular cartilage and the growth plate. j Optical density quantitative analysis showing changes in RIC1 expression in articular cartilage and the growth plate. k Optical density quantitative analysis showing changes in FGF20 expression in articular cartilage and the growth plate. These results are based on at least three independent experiments (n = 3). All significance data presented in a, b, i, j, and k are based on two-tailed Student’s t-tests

Similar articles

Cited by

References

    1. Klco JM, Mullighan CG. Advances in germline predisposition to acute leukaemias and myeloid neoplasms. Nat. Rev. Cancer. 2021;21:122–137. doi: 10.1038/s41568-020-00315-z. - DOI - PMC - PubMed
    1. Blyth K, Cameron ER, Neil JC. The RUNX genes: gain or loss of function in cancer. Nat. Rev. Cancer. 2005;5:376–387. doi: 10.1038/nrc1607. - DOI - PubMed
    1. Wang Q, et al. Disruption of the Cbfa2 gene causes necrosis and hemorrhaging in the central nervous system and blocks definitive hematopoiesis. Proc. Natl. Acad. Sci. USA. 1996;93:3444–3449. doi: 10.1073/pnas.93.8.3444. - DOI - PMC - PubMed
    1. Burchfield JS, Xie M, Hill JA. Pathological ventricular remodeling: mechanisms: part 1 of 2. Circulation. 2013;128:388–400. doi: 10.1161/CIRCULATIONAHA.113.001878. - DOI - PMC - PubMed
    1. Levanon D, et al. Spatial and temporal expression pattern of Runx3 (Aml2) and Runx1 (Aml1) indicates non-redundant functions during mouse embryogenesis. Mech. Dev. 2001;109:413–417. doi: 10.1016/S0925-4773(01)00537-8. - DOI - PubMed