. 2021 Dec 8;7(1):379.
doi: 10.1038/s41420-021-00715-6.

Oncogenic microRNA-181d binding to OGT contributes to resistance of ovarian cancer cells to cisplatin

Affiliations

Oncogenic microRNA-181d binding to OGT contributes to resistance of ovarian cancer cells to cisplatin

Wei Huang et al. Cell Death Discov. .

Abstract

Ovarian cancer (OC), a common gynecological cancer, is characterized by a high malignant potential. MicroRNAs (miRNAs or miRs) have been associated with the chemo- or radiotherapeutic resistance of human malignancies. Herein, the current study set out to explore the regulatory mechanism of miR-181d involved in the cisplatin (DDP) resistance of OC cells. Firstly, in-situ hybridization method was performed to identify miR-181d expression in ovarian tissues of DDP-resistant or DDP-sensitive patients. In addition, miR-181d expression in A2780 cells and A2780/DDP cell lines was determined by RT-qPCR. Gain- and loss-of-function experiments were then performed to characterize the effect of miR-181d on OC cell behaviors. We probed the miR-181d affinity to OGT, as well as the downstream glycosylation of KEAP1 and ubiquitination of NRF2. Further, in vivo experiments were performed to define the role of miR-181d in tumor resistance to DDP. miR-181d was highly expressed in the ovarian tissues of DDP-resistant patients and the A2780/DDP cell line. Ectopic expression of miR-181d augmented DDP resistance in OC cells. In addition, miR-181d was found to target the 3'UTR of OGT mRNA, and negatively regulate the OGT expression. Mechanistic results indicated that OGT repressed NRF2 expression through glycosylation of KEAP1, thereby inhibiting the DDP resistance of OC cells. Furthermore, miR-181d negatively orchestrated the OGT/KEAP1/NRF2 axis to enhance the OC resistance to DDP in vivo. Overall, these findings suggest that miR-181d-mediated OGT inhibition restricts the glycosylation of KEAP1, and then reduces the ubiquitination and degradation of NRF2, leading to DDP resistance of OC. This study provides new insights for prevention and control of OC.


Conflict of interest statement

The authors declare no competing interests.

Figures

Fig. 1
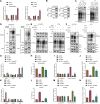
Fig. 1. miR-181d is highly expressed in DDP-resistant OC tissues or cells.
A Expression of miR-181d in DDP-resistant and DDP-sensitive OC cells in the GSE148251 dataset. B In-situ hybridization assay of the miR-181d expression in clinical tissue samples of chemo-resistant (n = 46) and chemo-sensitive (n = 32) OC patients. C CCK-8 assay evaluation of viability of A2780 and A2780/DDP cells after treatment with DDP at different concentrations (0, 10, 20, 50, 100, and 150 μmol/L) for 48 h. IC50 of A2780 = 12.72 μmol/L, and IC50 of A2780 DDP = 55.03 μmol/L. D RT-qPCR detection of miR-181d expression in A2780/DDP and A2780 cells, normalized to U6. Cell experiments were repeated three times independently. *p < 0.05 versus A2780 cells or chemo-sensitive OC patients.
Fig. 2
Fig. 2. miR-181d promotes resistance of OC cells to DDP.
A RT-qPCR detection of miR-181d expression in A2780/DDP cells after miR-181d inhibitor treatment normalized to U6. B CCK-8 assay of viability of A2780/DDP cells after miR-181d inhibitor treatment. C Flow cytometric analysis of A2780/DDP cell apoptosis after miR-181d inhibitor treatment in the presence or absence of DDP treatment. D Western blot assay of apoptosis-related proteins pro-caspase3, cleaved caspase-3, and proliferation-related protein PCNA in A2780/DDP cells normalized to β-actin after miR-181d inhibitor treatment. E RT-qPCR detection of miR-181d expression in A2780 cells after miR-181d mimic treatment normalized to U6. F CCK-8 assay of viability of A2780 cells after miR-181d mimic treatment. G Flow cytometric analysis of A2780 cell apoptosis after miR-181d mimic treatment in the presence or absence of DDP treatment. H Western blot assay of apoptosis-related proteins pro-caspase3, cleaved caspase-3, and proliferation-related protein PCNA in A2780 cells after miR-181d mimic treatment. Cell experiments were repeated three times independently. *p < 0.05 versus A2780/DDP cells treated with inhibitor-NC or A2780 cells treated with mimic-NC.
Fig. 3
Fig. 3. OGT is a direct target gene of miR-181d.
A Venn diagram of the target genes of miR-181d predicted by the starBase, microRNA.org, and TargetScan databases. The four ellipses in the figure represent the significantly downregulated genes in OC samples retrieved from the GEPIA and the candidate target genes predicted by the three databases. The middle part represents the intersection of the four sets of data. B Candidate target gene interaction network diagram. Each ellipse in the figure represents a gene, the lines between the ellipses indicate the presence of interaction between genes, and the red represents OGT. C The degree value statistics of core genes in the gene interaction network diagram. The more interacting genes represent the higher degree value and higher core degree. The x-axis in the figure represents the degree value, and the y-axis represents the gene. D Differential expression of OGT gene in OC and normal samples in the TCGA and GTEx databases. The x-axis indicates the sample type, the y-axis indicates the expression, the red box plot indicates the tumor sample, and the gray box plot indicates the normal sample (T Tumor, N Normal, *p < 0.01 versus normal samples). E Putative miR-181d binding sites in the OGT 3′UTR predicted by the microRNA.org database. F Binding of miR-181d to OGT confirmed by dual luciferase reporter assay. G Western blot assay and RT-qPCR detection of OGT protein and mRNA expression in A2780/DDP cells after miR-181d inhibitor treatment. H Western blot assay of OGT protein in A2780 cells after miR-181d mimic treatment normalized to β-actin. Cell experiments were repeated three times independently. *p < 0.05 versus A2780/DDP cells treated with inhibitor-NC or A2780 cells treated with mimic-NC or HEK293T co-transfected with mimic-NC and OGT 3′UTR WT.
Fig. 4
Fig. 4. miR-181d promotes resistance of OC cells to DDP by downregulating OGT.
A Western blot assay of sh-OGT knockdown efficiency in A2780/DDP cells. A2780/DDP cells were treated with inhibitor-NC + sh-NC, miR-181d inhibitor + sh-NC, or miR-181d inhibitor + sh-OGT. B RT-qPCR detection of miR-181d expression in A2780/DDP cells normalized to U6. C Western blot assay of OGT expression in A2780/DDP cells normalized to β-actin. D CCK-8 assay of A2780/DDP cell viability. E Flow cytometric detection of A2780/DDP cell apoptosis. F Western blot assay of pro-caspase3 and cleaved caspase-3 expression and quantitative analysis in A2780/DDP cells normalized to β-actin. G Western blot assay of PCNA expression and quantitative analysis in A2780/DDP cells normalized to β-actin. A2780 cells were treated with mimic-NC + oe-NC, miR-181d mimic + oe-NC, or miR-181d mimic + oe-OGT. H RT-qPCR detection of miR-181d expression in A2780 cells normalized to U6. I Western blot assay of OGT expression in A2780 cells normalized to β-actin. J CCK-8 assay of A2780 cell viability. K Flow cytometric detection of A2780 cell apoptosis. L Western blot assay of pro-caspase3 and cleaved caspase-3 expression and quantitative analysis in A2780 cells normalized to β-actin. M Western blot assay of PCNA expression and quantitative analysis in A2780 cells normalized to β-actin. Cell experiments were repeated three times independently. *p < 0.05 versus A2780/DDP cells treated with sh-NC, or inhibitor-NC + sh-NC or A2780 cells treated with mimic-NC + oe-NC. #p < 0.05 versus A2780/DDP cells treated with miR-181d inhibitor + sh-NC or A2780 cells treated with miR-181d mimic + oe-NC.
Fig. 5
Fig. 5. OGT augments glycosylation of KEAP1, and increases its stability and expression, consequently promoting the ubiquitination and degradation of NRF2, and thereby inhibiting DDP resistance of OC cells.
A Western blot assay of the expression and quantitative analysis of KEAP1 in A2780 and A2780/DDP cells overexpressing OGT normalized to β-actin. B Co-IP assay of the interaction between OGT and KEAP1 in A2780 cells or A2780/DDP cells. C Co-IP assay of KEAP1 glycosylation in A2780 cells or A2780/DDP cells. D Co-IP assay of the ubiquitination modification level of NRF2 in A2780 cells or A2780/DDP cells. E Western blot assay of changes in KEAP1 glycosylation in A2780 cells or A2780/DDP cells. F Co-IP assay of the ubiquitination degree of NRF2 in A2780 cells or A2780/DDP cells. A2780/DDP cells were treated with oe-NC + sh-NC, oe-OGT, oe-OGT + sh-KEAP1 or oe-OGT + oe-NRF2. G Western blot assay of the expression and quantitative analysis of OGT, KEAP1, and NRF2 in A2780/DDP cells normalized to β-actin. H CCK-8 assay of the change of A2780/DDP cell viability. I Western blot assay of cleaved caspase-3 expression and quantitative analysis in A2780/DDP cells normalized to β-actin. J Western blot assay of PCNA expression and quantitative analysis in A2780/DDP cells normalized to β-actin. A2780 cells were treated with oe-NC + sh-NC, sh-OGT, sh-OGT + oe-KEAP1 or sh-OGT + sh-NRF2. K Western blot assay determination of KEAP1, OGT, and NRF2 expression and quantitative analysis in A2780 cells normalized to β-actin. L CCK-8 assay assessment of A2780 cell viability. M Western blot assay of the cleaved caspase-3 expression and quantitative analysis in A2780 cells normalized to β-actin. N Western blot assay of PCNA expression and quantitative analysis in A2780 cells normalized to β-actin. Cell experiments were repeated three times independently. *p < 0.05 versus A2780/DDP or A2780 cells treated with oe-NC, A2780/DDP or A2780 cells treated with sh-NC or A2780/DDP or A2780 cells treated with oe-NC + sh-NC. #p < 0.05 versus A2780/DDP cells treated with oe-OGT or A2780 cells treated with sh-OGT.
Fig. 6
Fig. 6. miR-181d regulates DDP resistance of OC cells through the OGT/KEAP1/NRF2 axis.
A2780/DDP cells were treated with inhibitor-NC + oe-NC, miR-181d inhibitor + oe-NC or miR-181d inhibitor + oe-NRF2. A RT-qPCR detection of miR-181d expression in A2780/DDP cells normalized to U6. B Western blot assay of OGT, KEAP1, and NRF2 expression and quantitative analysis in A2780/DDP cells normalized to β-actin. C CCK-8 assay of A2780/DDP cell viability. D Western blot assay of pro-caspase3 and cleaved caspase-3 expression and quantitative analysis in A2780/DDP cells normalized to β-actin. E Western blot assay of PCNA expression and quantitative analysis in A2780/DDP cells normalized to β-actin. A2780 cells were transfected with mimic-NC + sh-NC, miR-181d mimic + sh-NC or miR-181d mimic + sh-NRF2. F RT-qPCR detection of miR-181d expression in A2780 cells normalized to U6. G Western blot assay of the expression and quantitative analysis of OGT, KEAP1, and NRF2 in A2780 cells normalized to β-actin. H CCK-8 assay of A2780 cell viability. I Western blot assay of the pro-caspase3 and cleaved caspase-3 expression and quantitative analysis in A2780 cells normalized to β-actin. J Western blot assay of PCNA expression and quantitative analysis in A2780 cells normalized to β-actin. Cell experiments were repeated three times independently. *p < 0.05 versus A2780/DDP cells treated with inhibitor-NC + oe-NC or A2780 cells treated with mimic-NC + sh-NC. #p < 0.05 versus A2780 cells treated with miR-181d mimic + sh-NC or A2780/DDP cells treated with miR-181d inhibitor + oe-NC.
Fig. 7
Fig. 7. miR-181d regulates the OGT/KEAP1/NRF2 axis to promote OC Resistance to DDP in vivo.
A2780 cells stably transfected with mimic-NC + sh-NC, miR-181d mimic + sh-NC or miR-181d mimic + sh-NRF2 and untreated A2780 cells were xenografted subcutaneously into the DDP-treated nude mice. A Tumor volume of nude mice measured at 5, 10, 15, 25 days after cell injection. B Representative images showing xenografts in nude mice. C Quantitative analysis of panel B. D RT-qPCR detection of miR-181d expression in tumor tissues of nude mice normalized to U6. E Western blot assay of the expression and quantitative analysis of NRF2, KEAP1, and OGT proteins in nude mouse tumor tissues normalized to β-actin. *p < 0.05 versus nude mice treated with PBS. #p < 0.05 versus nude mice treated with DDP + mimic-NC + sh-NC. & p < 0.05 versus nude mice treated with DDP + miR-181d mimic + sh-NC. n = 6 for nude mice in each group.
Fig. 8
Fig. 8. Schematic diagram of the mechanism by which miR-181d affects OC chemoresistance via the OGT/KEAP1/NRF2 axis.
miR-181d directly targets OGT and inhibits the expression of OGT, thereby inhibiting the glycosylation of KEAP1, reducing the ubiquitination, and degradation of NRF2 and promoting the expression of NRF2. By this mechanism, the viability of OC cells is promoted while cell apoptosis is suppressed, ultimately inducing the chemoresistance of OC.

Similar articles

Cited by

References

    1. Barkal AA, Brewer RE, Markovic M, Kowarsky M, Barkal SA, Zaro BW, et al. CD24 signalling through macrophage Siglec-10 is a target for cancer immunotherapy. Nature. 2019;572:392–6. doi: 10.1038/s41586-019-1456-0. - DOI - PMC - PubMed
    1. Mungenast F, Thalhammer T. Estrogen biosynthesis and action in ovarian cancer. Front Endocrinol. 2014;5:192.. doi: 10.3389/fendo.2014.00192. - DOI - PMC - PubMed
    1. Yan XY, Qu XZ, Xu L, Yu SH, Tian R, Zhong XR, et al. Insight into the role of p62 in the cisplatin resistant mechanisms of ovarian cancer. Cancer Cell Int. 2020;20:128.. doi: 10.1186/s12935-020-01196-w. - DOI - PMC - PubMed
    1. Riester, M, Wei, W, Waldron, L, Culhane, AC, Trippa, L, Oliva, E et al. Risk prediction for late-stage ovarian cancer by meta-analysis of 1525 patient samples. J Natl Cancer Inst. 2014;106:dju048. - PMC - PubMed
    1. Alexandri C, Daniel A, Bruylants G, Demeestere I. The role of microRNAs in ovarian function and the transition toward novel therapeutic strategies in fertility preservation: from bench to future clinical application. Hum Reprod Update. 2020;26:174–196. doi: 10.1093/humupd/dmz039. - DOI - PubMed